
Abstract
The reflection characteristics of radar waves in coastal high-rise buildings form a certain shielding area, which makes it difficult for vessel traffic service to control the ship dynamic situation in sheltered waters. To study the overshadowing influence of coastal buildings on the vessel traffic service radar, an expression model of shielding area is established based on the structure characteristics of buildings and the relative height of radar. Then, the coordinate system is established, and the range and height of the shelter area are calculated, according to the geometric relation. Based on the theory of radar electromagnetic wave diffraction, the target height is calculated. Finally, taking the prince’s Bay Cruise Terminal Building on the radar Shekou radar as an example, the shielding area and height are calculated and visualized by the numerical calculation model and verified by real vessel test and observation. The building with a height of 60 m has covered 973,090 m2 of sheltered area for Shekou radar. The results can be used not only to analyze the influence of buildings on existing vessel traffic service radar stations but also to provide an important reference for site selection of vessel traffic service radar stations.
Keywords
Introduction
Vessel traffic service (VTS) is a system based on traffic information to complete traffic control and then to supervise the navigation dynamics of ships. The radar subsystem is a part of VTS. The electromagnetic wave of VTS radar belongs to microwave and propagate uniformly in space. When radar electromagnetic wave meets obstacles, shielding and diffraction will occur. As the rapid development of ports, the coastal high-rise buildings will have strong reflection for radar electromagnetic waves, forming certain sheltered areas, namely, radar overshadowing areas, which makes it difficult for VTS to control the ship dynamic situation in sheltered waters and increases the difficulty of maritime supervision. Therefore, it is necessary to study the overshadowing influence of the coastal buildings on the VTS radar monitor of ports.
For the calculation of radar shielding area, D Mu et al., 1 based on the characteristics of suspension bridges, put forward a model to calculate the shielding area of suspension bridge to VTS radar through example analysis. Z Zhou et al. 2 studied the calculation method of radar terrain shielding area based on digital elevation models (DEMs), determined the blind area of radar by defining the terrain shading point, and finally obtained the range of radar detection ability at different heights. B Ren et al. 3 summed up the cause of radar shielding area, proposed a processing scheme of digital map, and got a method of rapid calculation of radar terrain shielding area. The simulation results proved the feasibility of the method. H Wu 4 proposed a method of processing image superposition, which can quickly find the overshadowed objects. The location of the overshadowed objects can be identified by using superposition of real images and radar images. Wu also proposed a method to predict the formation cause of shielding area of radar field surveillance.
HT Xue et al. 5 proposed a calculation model of shielding area based on turntable crawler object to quickly calculate the radar terrain shielding area when the aircrafts penetrate in low altitude. The distribution curves of terrain shielding area in various altitude and the visual model are also obtained through example calculation.
At present, few researches have been found focused on the overshadowing influence of coastal buildings on the VTS radar. The traditional methods of research are to calculate the size of the shielding area by means of geometrical optics. However, the problem is that these methods only take the obstructions into account and did not consider the diffraction of electromagnetic waves.
In terms of the model of radar electromagnetic wave diffraction, X Ma et al. 6 put forward the calculation model based on electromagnetic wave diffraction, which can reduce the amount of the calculation of shielding area and simplify the complexity of simulation.
Z Zheng 7 studied the diffraction regularities of electromagnetic waves and derived the formula of edge peak diffraction and circular peak diffraction. It provides a good reference for studying the diffraction of electromagnetic waves when obstacles are encountered. Based on radar performance parameters and radar diffraction theory, H Guo 8 quantitatively analyzed the overshadowing influence of wind motors on the azimuth, distance, and height detection of the shore-based radar. K Liu et al. 9 analyzed the characteristics of radar echo wave based on radar diffraction theory and the performance parameters and studied the influence of wind power generation apparatus on the navigation radar.
In terms of three-dimensional (3D) modeling, J Li and Y Liu 10 expounded the 3D modeling of buildings. The advantages of 3ds MAX and AutoCAD technology were combined and introduced into building 3D modeling. Based on the 3D modeling, the whole process of modeling was introduced to realize the requirements of the authenticity and accuracy of the 3D models of the buildings.
YP Pang 11 introduced the manufacturing process of the shipborne radar function simulation system and discussed the method of making 3D animation of ship tracking, search, and guidance function using 3ds MAX. The methods and techniques of the destroyer modeling were demonstrated, and the balance between the model precision and the calculation speed was discussed.
J Zhang 12 chose a radar as an example to design the modeling and scene and demonstrated the problems in the application of 3D simulation software and the solutions from the aspects of model establishment, lighting layout, and rendering adjustment.
In the verification of the shadowing effect, X Mou et al. 13 explored the effect of the third Wanzhou Bridge on maritime radar by full-scale trial simulation and predicted the influence of the third Wanzhou Bridge on maritime radar.
To solve the problem of difficult detection and inaccurate results in the current radar shielding area, a method for calculating and verifying the shielding area of marine traffic control radar is provided. In this article, a mathematical expression model of radar sheltered area is established, and a 3D model of buildings is introduced to quantitatively calculate the area and height of sheltered area. At the same time, the full-scale trial is used to verify the results. The research results can be used not only to analyze the influence of existing buildings on existing VTS radar but also to evaluate the influence of neighboring coastal buildings on the proposed radar stations and provide important theoretical references for the location of newly built VTS radar stations.
The expression of shielding area
According to the structure characteristics of the buildings and the relative height between the buildings and the radar, the mathematical expressions of the shielding area include finite continuous 3D shielding area, finite discontinuous 3D shielding area, infinite continuous 3D shielding area, and infinite discontinuous 3D shielding area.
The expression model of finite continuous 3D shielding area: the structures of buildings are continuous, and the heights of buildings are lower than the heights of radar. The model of the finite continuous shielding area can be expressed as A(x, y, z). The boundary algorithm of radar shielding area is introduced and the radar coordinates are taken as (x0, y0, h). Assume that there is an initial shielding surface A1, whose boundary satisfies the function of F(x, y, z) = 0. Taking one point of a1(x1, y1, z1) of the surface, the launching line of radar crossing the point of a1 is expressed as

The boundary surface of shielding area is expressed as

So, the finite continuous shielding surface A(x, y, z) is between the surface A1:F(x, y, z) = 0 and the surface A2:z = 0.
The expression model of finite discontinuous 3D shielding area: the structures of buildings are discontinuous, and the heights of buildings are lower than the heights of radar. The model of the finite discontinuous shielding area can be expressed as B(xi, yi, n, z, n, z0, z1, …, znn, k1, k2,·…, kn). Multigroup approach is adopted. The coordinates of the radar point are taken as b(0, 0, h). The coordinates of a random point on the horizontal projection of the shielding area are taken as (xi, yi, 0), and the shielding height is Bin. There are n coordinate points at the crossing points of the initial surface of the shielding area B1:F(x, y, z) = 0 and
The point of b, Bin, and Bn are on the same line, so according to the equation xBn/xi = yBn/yi = (zBn − h)/(zn − h), Zn is obtained. The height of the shielding area kn = zn −zn −1, and then, B is obtained.
The expression model of infinite continuous 3D shielding area: the structures of buildings are continuous, and the heights of buildings are higher than the heights of radar. The model of the infinite continuous shielding area can be expressed as C(x0, y0, φ0, ρ0, α, △). The polar coordinate approach is adopted. The coordinates of the point of radar is taken as c0:(x0, y0, h). The coordinates of a random point, named c1, on the horizontal projection C1:F(x, y, z) = 0 of the shielding area are taken as (x0, y0, φ0, ρ0), in which φ0 is the angle between the c1 and c0 and ρ0 is the distance from c1 to the horizontal projection point of radar.
The height of the point on the shielding initial surface is expressed as hi, and hi is the longitudinal coordinate solution to

the expression model of infinite continuous shielding area C is obtained.
The expression model of infinite discontinuous 3D shielding area: the structures of the buildings are discontinuous, and the heights of buildings are higher than the heights of radar or building groups form infinite discontinuous 3D shielding area. The model can be represented with combination of the methods A, B, and C.
Numerical calculation of shielding area
Establishment of coordinate system
First, the geographic range that the shielding area covered is determined. Based on the size of the area, a rectangle R is set up, which exactly covers the range of the shielding area. As for infinite shielding area, the area of the rectangle R can be properly reduced. Then, a map which includes rectangle R, buildings, and radar is established. To simplify calculation, a unified coordinate system is established, as shown in Figure 1. The position of radar is taken as the origin of coordinate, and the three directions of the west, south, and the space are axis. In the coordinate system, the O point is the radar water plane basis point. O1 is the radar antenna transmission point. The building is an irregular body, part of which is higher than the radar antenna transmission point, and the other part is lower than the point.
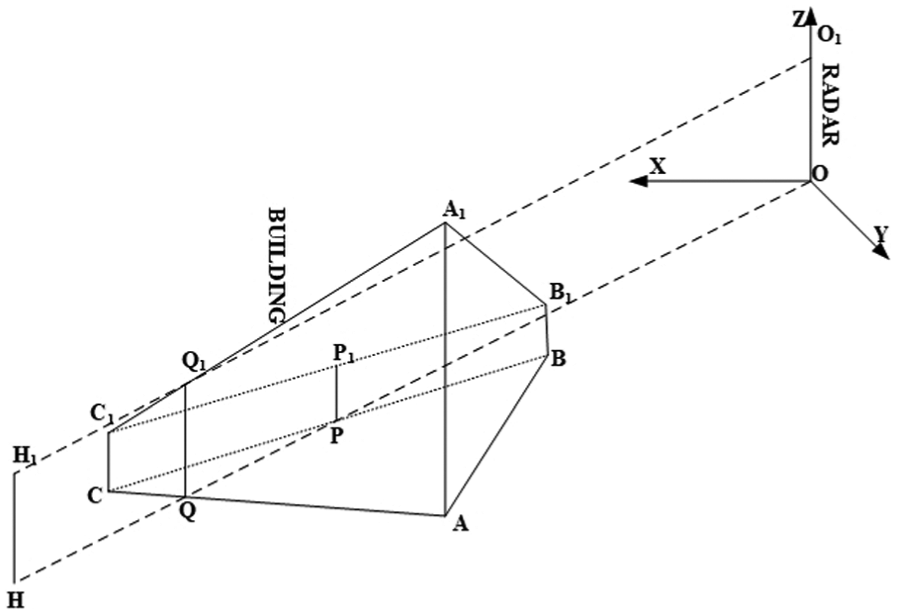
The 3D sketch map of buildings and radar.
The yellow sea datum is selected as the XOY datum, and the actual geographical coordinates of the radar and buildings in Beijing 54 coordinate system are taken as the coordinates of X and Y. The coordinates of the antenna launching point of radar are (X0, Y0, Z0), and the coordinates of the building angular point are (X1, Y1, Z1). When the coordinates of the antenna launching point of are switched to (0, 0, 0), the coordinates of an angular point of the buildings are switched to (X1 −X0, Y1 − Y0, Z1 − Z0).
Determination of vertical shielding line of buildings
Radar electromagnetic wave is under occlusion from buildings as it transmits along a straight line. The shadow is shielding area, as shown in Figure 2. Lines PP1 and QQ1 are defined as shielding line in the vertical direction.

Determination of vertical shielding line.
To determine the vertical shielding line of the building, we connect the O point and a random point H in the shielding area in Figure 1, with the connecting line crossed plane BCC1B1 and plane ACC1A1 at points P and Q, and draw the vertical lines PP1 and QQ1. As the line, OH rotates counterclockwise from point C to A, and the height of QQ1 is always greater than PP1. As long as the buildings are in the vertical raying range of radar electromagnetic wave, there will be two situations:
Situation 1. As shown in Figure 3, the slope of the line O1Q1 is greater than that of the line O1P1, namely, kO1Q1 > kO1P1. The shielding height of HH1 is decided by the line segment QQ1 and is unrelated that whether the slope is greater than 0. The vertical shielding line of buildings is QQ1, and the shielding height at point H is the height of vertical line HH1, namely, H0.
Situation 2. As shown in Figure 4, the slope of the line O1Q1 is smaller than that of the line O1P1, namely, kO1Q1 < kO1P1. The shielding height of HH1 is decided by the line segment PP1. The vertical shielding line of buildings is PP1, and the shielding height at point H is the height of vertical line HH1, namely, H0.
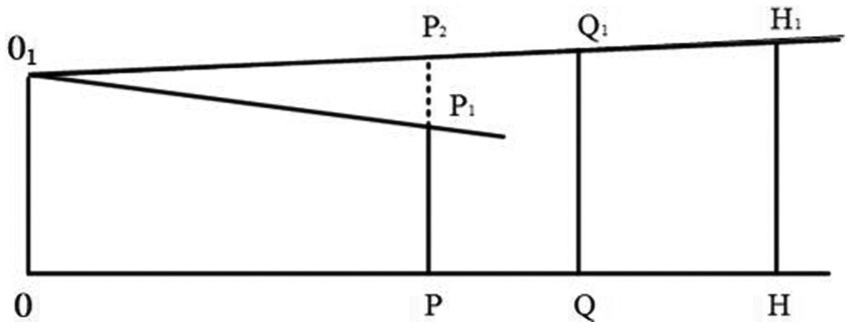
Sketch map of situation 1.

Sketch map of situation 2.
Geometric calculation model of shielding height
As the vertical shielding line of buildings is determined, taking the radar antenna as the center, the maximum detection range Rmax of radar as the radius, and the angle step
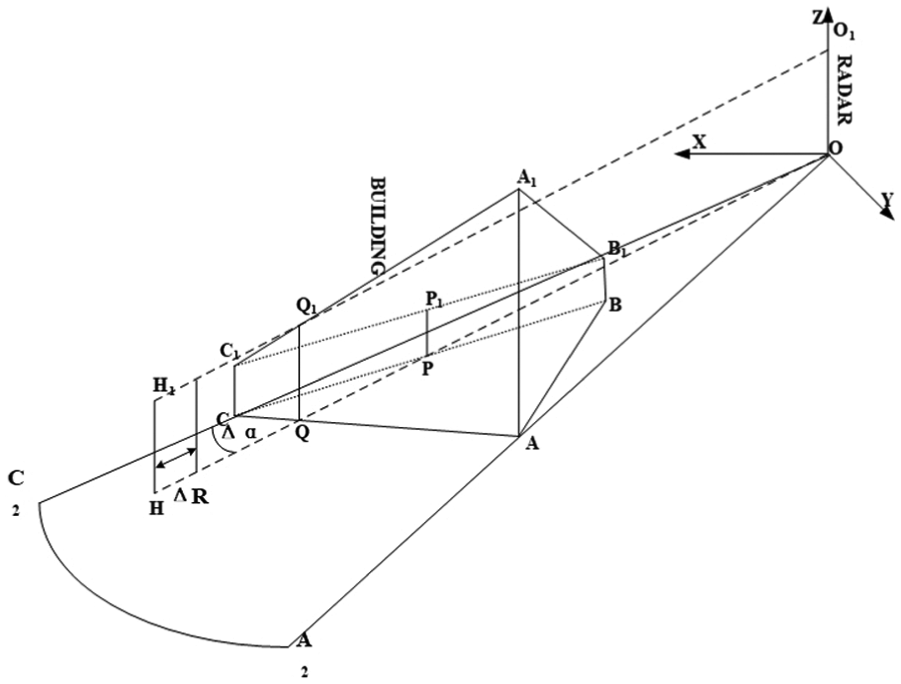
Calculation of geometric shielding heights.
The calculation steps of the geometric shielding height of each point are as follows:
Step 1. Determine the linear equation in the XOY plane and obtain the coordinates of P and Q. The coordinates of a random point in the shielding area are (a, b) and then obtain the ray OH: y = (b/a) x. Substitute the coordinates of each point on the XOY plane into the equation and then obtain line AB: y = k1x + b1, line BC: y = k2x + b2, and line AC: y = k3x + b3. The coordinates of point P are obtained through the simultaneous equations OH and BC (or BA). The coordinates of point Q are obtained in the same way through the simultaneous equations OH and AC.
Step 2. Determine the plane equation in the space. Suppose the equation of the plane A1B1C1 is Ax + By + Cz + D = 0. The space coordinates of A1, B1, and C1 are known, and the coefficients of the equation of the plane A1B1C1 are obtained, thus the plane equation is obtained. Substituting the coordinates of P and Q into the equation of plane A1B1C1 and the space coordinates of P1 and Q1, the value of
Step 3. Obtain the space radar ray equation after the determination of the vertical shielding line. In the sketch map of situation 1,
Step 4. Calculate the geometric shielding height. As shown in the sketch map of situation 1, when
Likewise, as shown in the sketch map of situation 2, when kO1Q1 < kO1P1 and ZQ1 > ZP1. The linear equation of O1P1 is
Calculation model on the basis of radar wave diffraction theory
Based on peak diffraction model, 14 the situations that obstacle block radar electromagnetic wave can be classified as follows. One situation is that the height of obstacle is lower than that of antenna, and the other is that the height of obstacle is higher than that of antenna. When the height of the obstacle is lower than that of the radar antenna, the obstacle has a certain shielding effect on the radar, as shown in Figure 6.

Shelter of obstacles.
In Figure 6, hT is the height of the radar antenna, h is the height of the obstacles, and the hR is the height of the target, indicating that when the target is within the radar geometric plane, that is, the highest point of the target is on the line of radar and obstacles. Based on diffraction theory, when electromagnetic wave attenuation volume A < 12 dB, diffraction height H (m) is

When the height of the obstacle is greater than the height of the connecting line of radar antenna and the obstacles by H (m), the diffraction attenuation of the electromagnetic wave reaches 12 dB, and the target will not be detected by radar. Therefore, the height H1 (m) of the target in the shielding area is given in the following.
When the electromagnetic wave attenuation amount A = 12 dB, the radar echo of the target is not attenuated, and the diffraction height H (m) is as follows

When the height of the obstacle is smaller than the height of the connecting line of radar antenna and the obstacles by H (m), the electromagnetic wave does not attenuate and the target detection is effected by the obstacles. Therefore, the radar zero-attenuation echo height of the target in the shadow fan area should be

The decrease in the arc scope of the sensitivity of obstacle is
Based on the above calculation model, 15 the geometric height hR, the target spotting height H1, and the height of echo zero-attenuation of the target radar H2 can be calculated by MATLAB programming. In the calculation of the geometric height hR, the diffraction of radar electromagnetic wave is not considered. The target spotting height is calculated based on the diffraction characteristic of electromagnetic wave when blocked and the peak diffraction model. The result is the minimum height that the target can be detected by radar. The height of echo zero-attenuation of the target radar means the required height that the echo of radar not being affected by buildings, which has great guiding significance to flying objects and has little guiding significance to the ships navigating in the shielding area.
By calculating the spotting target height of all the points in every direction of
3D modeling and simulation of blind area
3D modeling
The visualization of simulation process and results is realized by establishment of a 3D model and simulation test. Radar electromagnetic wave transmits in space at a constant speed along a straight line. The particle streaming system in 3ds MAX is used to place particle source in the position of radar antenna (particle emitter). The particle emitter launches a great number of particles, taking place during the transmission of radar electromagnetic wave. Occlusion occurs when particles transmit along a straight line and the sheltered area of building to radar will be obtained based on the building model.
First, the coordinates of the base graph are corrected. Taking the radar station as the base point, model is built up and superimposed on the map layer. The positions of radar and building can be viewed in the map. According to the corrected map, the relative coordinates of the key points of the building and the radar station (x, y) are measured.
Taking the elevation datum level as the horizontal plane, the elevation value z of the key point of the building is measured. According to the coordinates of key points (x, y, z), 3D models of the coastal buildings which need to be considered are built up. The buildings bind to the full direction guide, as shown in Figure 7. After it is switched to editable polygon, the accurate coordinates are input in the mobile transformation tool to determine the precise location of the model. After the establishment of model, as shown in Figure 8, particle flow source (particle emitter) occurs in the position of radar to take place during the transmission of electromagnetic wave.

Model of building.
Model of radar.
Simulation test
After establishing the building and radar model, setting up the particle emission source, the simulation test is carried out. To facilitate the analysis of simulation results, baffles perpendicular to datum plane are set in different positions within the scope of particle diffusion to intercept particles. (The attribute of particles is set as when transmitting along a straight line, the particles stay in the blocked position if encountered with base map, baffle, and building model.) The accuracy of the calculation results is verified through the analysis of the distribution and heights of intercepted particles.
Taking Shekou radar station and the buildings in Shenzhen Prince Bay Cruise for example, Shekou radar station, with longitude and latitude 22° 28 ′32 ″N, 113° 54′ 56″ E, located in the northeast of the home port of Shenzhen Taizi Bay Cruise at a distance of 900 m, is mainly used in the supervision of the Shenzhen Bay waters. The buildings in the cruise home port consist of a cruise center and waiting buildings on three embankments. The peak height of the cruise center is 67.5 m, and the lowest point height is 16.62 m. The height of the waiting building is 20.3 m. The high-rise buildings under planned construction will shelter the Shekou radar station, forming an infinite continuous 3D shielding area and a finite continuous 3D shielding area in the basin of Shekou port waters.
In this simulation, three baffles are set being flush with the embankment line, as shown in Figure 9, that is, Baffle A: A1–A2–A3–A4, Baffle B: B1–B2–B3–B4, and Baffle C: C1C2C3–C4–C5. The points are on the boundary of the non-shielding area and shielding area and the boundary of different shielding area. Baffles A, B, and C can intercept the particles that are set in the position of baffles, and the shelter height of buildings can be obtained.

Top view of baffle position.
The particles were intercepted by the baffles during transmitting along the straight line. The distribution of particles intercepted in Baffle A is shown in Figure 10. The color of red represents particles, while the height of the white area is the height distribution of the shielding area of the baffle position. The height difference between the adjacent two dark lines is 10 m. The geometric height that the buildings shelter the radar can be viewed in the particle distribution in baffles. The intercepted particle distribution is Baffle B, and Baffle C is shown in Figures 11 and 12.

Particle distribution diagram of Baffle A.

Particle distribution diagram of Baffle B.

Particle distribution diagram of Baffle C.
Case study
Numerical calculation
From the illustration of section “Simulation test,” the relative position relationship of Shekou radar station and the cruise home port is shown in Figure 13. First, the calculation boundary in the XOY plane is determined. The connection line of the position of Shekou radar station O and the vertex of the southeast side of the jetty E is the right boundary OM. The connection line of point O and the side angle point C of the northwest of the cruise center is the left boundary ON. Therefore, the calculation water area is narrowed.

Location of the cruise home port and radar station.
The geometric shielding height and target spotting height are imported into ArcGIS, and the results are superimposed on the corrected map for comparison and analysis, as shown in Figure 14.
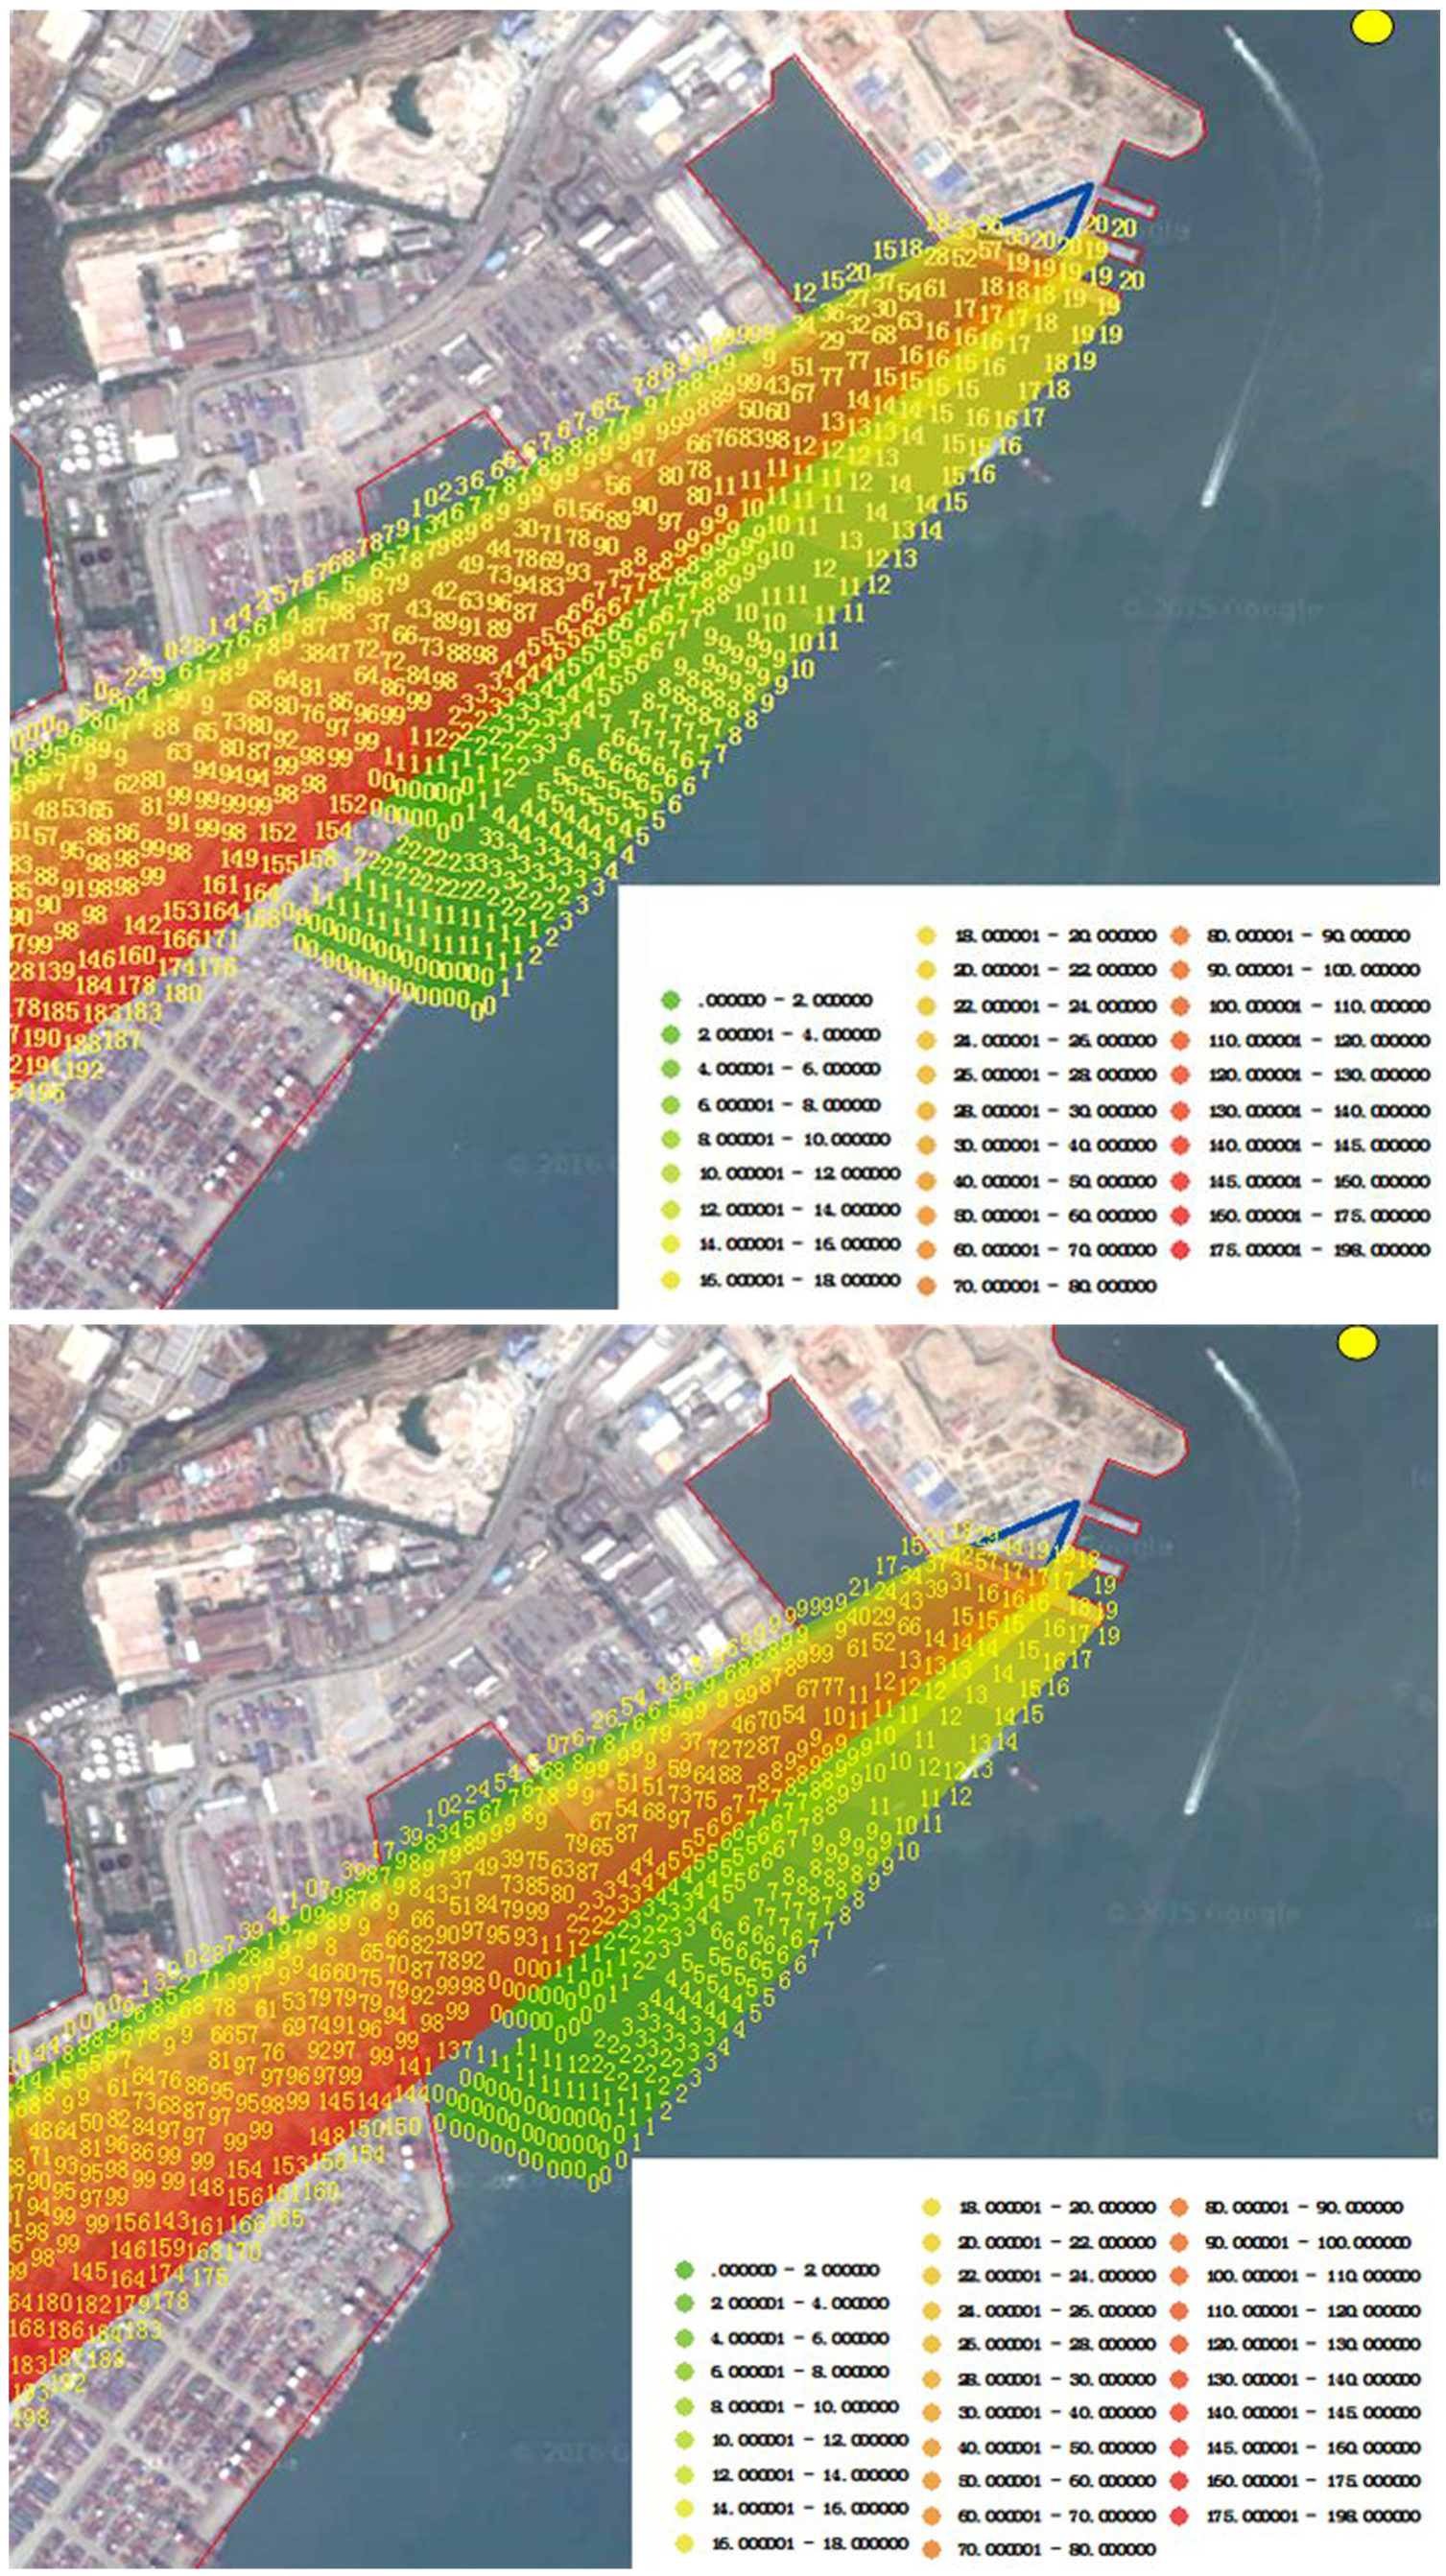
Shielding area and height: (a) geometric shielding height and (b) target spotting height.
The shielding area of Shekou radar station is shown in Figure 15. The points, whose geometric heights are zero, and the wharf shoreline are connected to obtain the boundary of the geometric shielding area. The points, whose spotting heights are zero, and the wharf shoreline are connected to obtain the boundary of shielding area with consideration of electromagnetic wave diffraction. In Figure 15, the area with the consideration of electromagnetic wave diffraction is smaller than the area without the consideration of electromagnetic wave diffraction, and the difference in the results in the two situations is the enclosed area that is rounded by the red boundary line. Based on the calculation, the shielding area is 1,066,798 m2 when the diffraction is not considered, while the area is 973,090 m2 when the diffraction is considered.

Length of the boundary line of the shielding area in Shekou radar station.
3D simulation test
Based on the 3D simulation model of radar, particle emission test is conducted. Based on the top view of simulation result, the sheltered area in the research can be seen clearly. The areas covered by particles are radar-monitored waters, while the waters without particles are the sheltered areas, as shown in Figure 16. Because radar waves and particles transmit along a straight line, the areas that are accessible for particles can be covered by Shekou radar station.

The shielding area obtained by 3D simulation.
The numerical results are compared with the 3D simulation results, as shown in Table 1, which records the height values of the points in the three baffles.
Comparison of numerical and 3D simulation results.

3D: three-dimensional.
From Table 1, the shielding height obtained by 3ds Max simulation and numerical calculation without considering the diffraction is similar, which is higher than that of considering the diffraction. This is because the diffraction phenomenon does not occur when the particles are blocked by the building in the 3D simulation, and the diffraction height of the electromagnetic wave is not considered. By comparing the calculation results with the simulation results, we can see that the shielding height is small when considering diffraction, and the results are closer to reality.
Full-scale trial verification
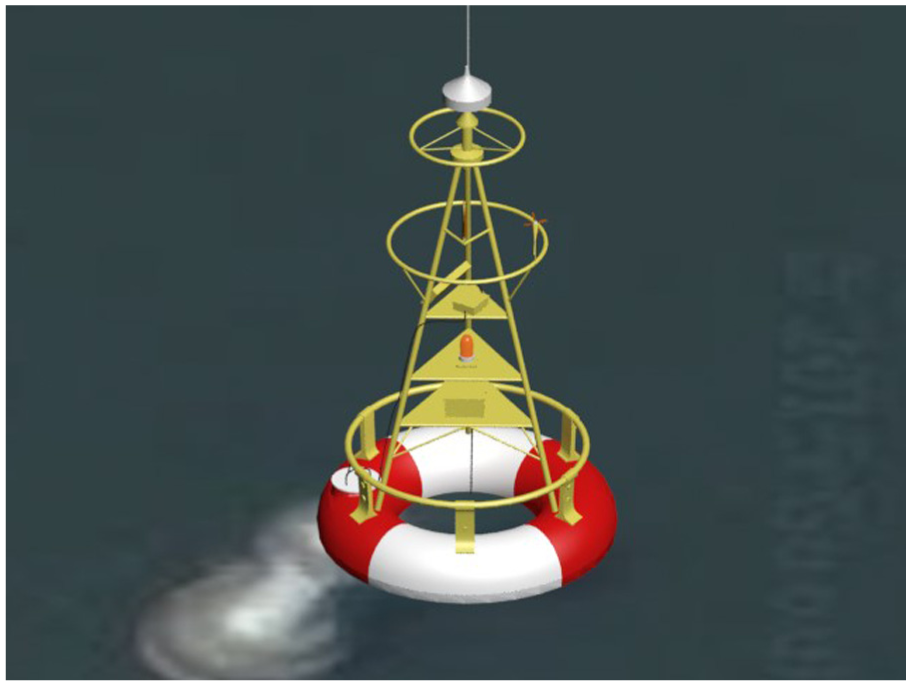
To verify the boundary of the shielding area, a maritime supervision cruise (Figure 17) is selected to carry out the real ship test. The test ship starts from the waters of Bay 2, heading 060°, sails to the turning point, turns left to about 090°, and then finally navigates to the berth near Bay 3. The speed of the test ship is sustained at 2–3 kn. It can be seen from the navigation route that the location, where the radar echo signal of the test ship is lost, is theoretically the boundary of the shielding area. The tracks of the test ship are compared with the radar echo image. As shown in Figure 18, the radar echo tracks of the test ship are consistent with the navigation tracks.

The real picture of the maritime cruise.

Comparison of full-scale trail and radar echo: (a) initial position, (b) turning point position, (c) position where radar echo is lost, and (d) final position.
In Figure 18(a), initially, test ship radar echo does not be influenced by the shelter of the buildings. Figure 18(b) indicates that after the test ship navigates for a while, the radar echo of the ship can still be spotted. At this time, the test ship has not entered the shielding area. In Figure 18(c), when the test ship turns about 90° and navigates for a while, the radar echo suddenly disappears, indicating that the test ship has entered the shielding area. The point where the radar echo of the test ship disappears is the boundary of the shielding area.
Figure 18(d) indicates that when the test ship navigates to the nearby waters of Bay 3 berth, the radar echo is not being observed all the time. This is because the test ship has entered the shielding area of buildings and the navigation routes cross the shielding area. The target spotting height in the shielding area is about 7–8 m (formed by ship building) and 28–107 m (formed by cruise center). In addition to the difference in datum plane and the actual water level of 0.22 m, the actual height of shielding area above water level is about 7.22–8.22 m and 28.22–107.22 m. The above water height of the test ship is about 3 m, which is far below the water surface level. Therefore, as the test ship enters the shielding area, the radar echo never appears.
Figure 18(d) indicates the point where the radar echo of test ship disappears and the boundary of the shielding area obtained by calculation is similar. The real ship test results are identical to the calculation results.
To make further research on the shelter effect of the buildings in cruise center on Shekou radar station, observation in Shenzhen VTS center is conducted for the ships navigating in the shielding area. The route of SHE GANG 6 HAO navigates from inside port to outside port. As shown in Figure 19, SHE GANG 6 HAO is the ship, with length of 36 m and width of 10 m, and the ship type is tug.

AIS track map of SHE GANG 6 HAO.
Comparison of the points with fixed ship radar echo and the calculation results of the shielding area is analyzed to verify the results with the consideration of diffraction, as shown in Figure 20.

Comparison of constant echo spotting and shelter area.
When the ship navigates through the shielding area and arrives at the position where the ship is not influenced by the shielding effect of buildings, the echo of radar will no longer change. As shown in Figure 20, in the interval that the radar echo of the ship increases to be constant, the target spotting height is zero. Currently, the navigation of the ship does not affect by the shelter of buildings, which is consistent with result of real ship observation. By comparison, it can be indicated that the geometric shielding height is not zero. Affected by the shelter of the buildings, the radar echo of the ship increases slowly, which is inconsistent with the result of actual observation. The comparison shows that the result with the consideration of electromagnetic wave diffraction is more accurate and consistent with actual situation.
Conclusion
Based on the characteristics of the structure of buildings and the relative height of radar, four types of shielding area expression models are established. At the same time, a calculation model of radar sheltered area by buildings is built up. Taking the Prince’s Bay Cruise Terminal Building on the radar Shekou radar for example, the shielding area and target spotting height are calculated and visualized, and the feasibility of the calculation model is verified.
Based on the calculation results, full-scale trial and observation are implemented to verify the boundary of shielding area. The test results show the correctness and engineering project feasibility of the calculation model.
To reduce the shielding effects of coastal buildings on VTS radar station, the numbers of closed-circuit television (CCTV) monitoring system, and VTS radar station, the maritime supervision department can be added, and the automatic identification system (AIS) data supervision can be strengthened for maritime supervision department to ensure the navigation safety of the ships in port waters.
Footnotes
Handling Editor: Nicolas Garcia-Aracil
Declaration of conflicting interests
The author(s) declared no potential conflicts of interest with respect to the research, authorship, and/or publication of this article.
Funding
The author(s) disclosed receipt of the following financial support for the research, authorship, and/or publication of this article: This study was supported by NSFC (71372202, 51479157, 51579202, 51679182), Natural Science Foundation of Hubei Province (2014CFB856), and China Central Universities Basic Research Funds (2015IVA042).