
Abstract
To carry out state identification and fault diagnosis of mechanical equipment, a new method is proposed for fault diagnosis of mechanical equipment based on the reconstruction of feature vector in the fractional Fourier transform domain. First, the time series of vibration signals are performed by fractional Fourier transform in different orders, according to statistical characteristic in the fractional Fourier transform domain. The kurtosis coefficients are then used for searching the optimal order. Next, taking the normal signal as the tracking target, the difference between the detection signal and the normal signal in fractional Fourier transform domain is calculated in the optimal order, so the normal signal is filtered and the state vector is extracted. The characteristic parameters of the correlation dimension, the zero-order moment, and the kurtosis coefficient are then restructured as a feature vector, and finally, the states are recognized using the k-nearest neighbor cross-validation estimation method. The effect of feature extraction is analyzed by correlation coefficient and diagnostic effect is evaluated using the correct rate of diagnosis. Experiment and analysis illustrates that this proposed target tracking filter fault diagnosis method based on reconstruction of feature vector in fractional Fourier transform domain is simple and intuitive. This method has a favorable feature extraction effect, high accuracy rate of diagnosis, high state recognition efficiency, and good recognition stability, making it a viable option for quantitative real-time state recognition and fault diagnosis of mechanical vibration equipment.
Keywords
Introduction
The fractional Fourier transform (FRFT) is a unified time-frequency transform tool. As a generalized Fourier transform, FRFT not only has the characteristics of general time-frequency analysis tools which can better reflect these properties of the signal but also exhibits advantages in interference suppression. Most general time-frequency analysis tools are one-dimensional transform, so FRFT has advantages including less computation and no cross coupling.1–3 There is currently extensive research and application of FRFT in quantum mechanics, optical signal processing, time-frequency filters, adaptive filters, parameter estimation, time-frequency analysis, fault diagnosis in the circuit, and signal decomposition. In existing fault diagnosis applications, however, the feature parameter is often calculated and extracted directly from the state time series and the difference between states is not obvious. The selected and extracted state feature cannot reflect the characteristics of the related state to an appropriate level, leading to minimal difference of state and low fault diagnosis accuracy. Due to the complexity of the algorithm and the large amount of computation required, this approach is not conducive to real-time fault diagnosis. There has been little study into FRFT application in fault diagnosis, particularly its application in state recognition and fault diagnosis analysis of general mechanical equipment detection signal, nor research into the combining of FRFT with correlation dimension and statistical moment.4,5
On the basis of analyzing the statistical moment and fractal characteristics of FRFT, a quantitative state recognition method of target tracking based on the combination of FRFT statistical moments and correlation dimension is explored here. The state is recognized using k-nearest neighbor cross-validation (CV-KNN), which provides a new method of real-time state recognition and fault diagnosis for general mechanical vibration equipment.
Central moment and fractal characteristics in FRFT domain
FRFT
FRFT is a generalized form of Fourier transform and a potential time-frequency analysis tool in the field of signal processing. It can be interpreted as a representation of the fractional Fourier domain in the time-frequency plane when the coordinate axis rotates at any angle around the origin. 6
If

where

where
As a linear operator, Fourier transform can be regarded as counterclockwise rotation of
The statistical moments of the FRFT spectrum
The distribution characteristics of the signal one-dimensional energy spectrum of

where n = 0, 1, 2, 3, …,
According to the definition of moment, the zero-order moment

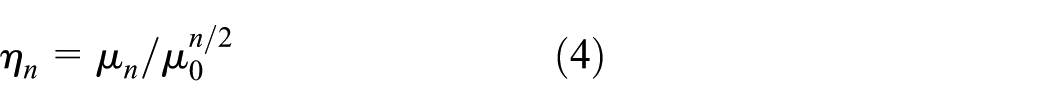
Kurtosis coefficient of corresponding energy spectrum
Correlation dimension of FRFT spectrum
Correlation dimension is proposed on the basis of space reconstruction. It is a method to calculate the fractal dimension of the attractor for the corresponding dynamic system by the observed time series. This method is sensitive to the inhomogeneity of the attractor, so it can reflect its dynamic structure. 10 Correlation dimension is a measure of the complexity of the studied system and is a parameter to describe the distribution of phase space. 12
The complexity of signal energy spectrum
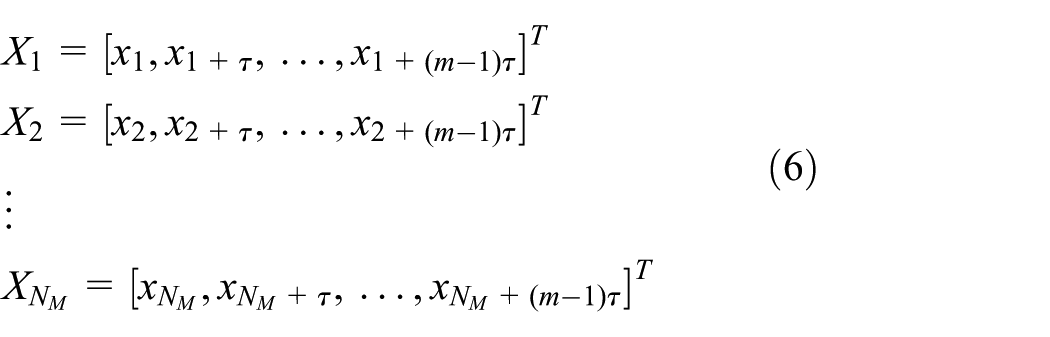
where
The definition of correlation integral of

where
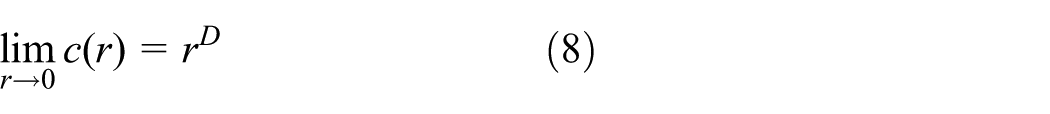
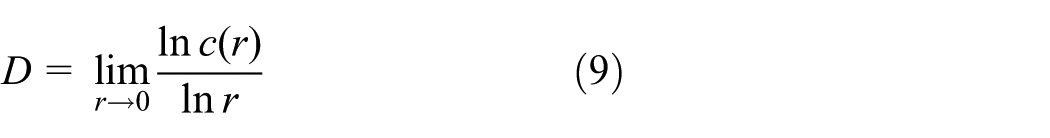
Correlation dimension D is16,17
Target tracking fault diagnosis algorithm based on statistical moments and correlation dimension in the FRFT domain
Statistical moment and fractal characteristics of FRFT for detection signals
Due to the Gaussian noise and cross interference problem in the original detection signal, the resolution of the state feature parameter extraction of the original detection signal is low. FRFT can suppress cross interference and Gaussian noise. To determine the detection signal of vibrating equipment in different states, the order range between 0 and 4 for FRFT is used; the zero-order moment μ0, kurtosis coefficient Kx, and correlation dimension D for the corresponding FRFT mode vector is calculated; and the statistics moment and fractal characteristics of FRFT can then be analyzed.
Figure 1 illustrates the (p, u) plane of FRFT mode in the order of p = 0–4 for speed regulation valve vibrating signals in different working conditions. Figures 2–4 show the distribution diagram of
The changes of kurtosis coefficient, correlation dimension, and zero-order moment of vibration signal FRFT mode along with different orders show obvious anisotropy in polar coordinates. The anisotropy of zero-order moment distribution is weaker with the minimum at
Kurtosis coefficient is a parameter to measure the peak distribution of the FRFT mode vector quantitatively. It can be used to search the peak value and determines the optimal order. In extracting state characteristics, the kurtosis coefficient reflects the aggregation of energy distribution and the suppression effect of signal interference. Near the order of p = 1 and p = 3, the sharp degree is larger, energy distribution is more concentrative, and the suppression effect of signal interference is the best. The correlation dimension is a quantitative measure parameter for the complexity of FRFT mode in the corresponding order and can quantitatively reflect distribution complexity characteristics. The zero-order moment reflects the total energy of the FRFT mode vector. Kurtosis coefficient, correlation dimension, and zero-order moment are the three comprehensive evaluation parameters of state characteristics. Normal state and fault state can be recognized according to these parameters, but limitation still exists if further recognition of specific fault type is required.
In comparing the computation amount between correlation dimension and statistical moment, results show that correlation dimension requires a high degree of computation and time to process, making it unsuitable for the complex computation of FRFT mode in all different orders. The zero-order moment among each working state shows little difference, kurtosis coefficient is negative, and the difference in most angle range is insignificant and limited only in the order near p = 1 (α = π/2) and p = 3 (α = 3π/2). The energy spectrum peak is also sharper and aggregation is the best. Therefore, in order to reduce computation and improve state recognition efficiency, the peak is searched and the optimal order should be determined by calculating kurtosis coefficient, then the correlation dimension of FRFT mode can be calculated in the optimal order.

(p, u) Plane of FRFT mode.

Distribution diagram of

Distribution diagram of

Distribution diagram of
The basic principle of the target tracking fault diagnosis method
Based on the analysis of statistical moments and fractal characteristics for the FRFT mode of vibration signal, to better extract the characteristic state of the signal and recognize the working state accurately, a target tracking fault diagnosis method based on statistical moment and correlation dimension of FRFT is proposed. This method takes the normal signal as tracking target, with kurtosis coefficients used for searching the optimal order. The difference between detection signal and the normal signal of FRFT mode is calculated in the optimal order, so the normal signal is filtered and the feature vector is extracted. The correlation dimension, kurtosis coefficient, and zero-order moment of three characteristic parameters of feature vector are then calculated with the states recognized using the estimation algorithm of CV-KNN. Status categories of equipment are recognized and the fault diagnosis is carried out in this way. To summarize, a detection signal of vibration equipment can be understood as the superposition of normal signal, fault features, and added Gaussian noise. It can be expressed as

where s(t) is the normal signal, d(t) is the fault feature signal, and w(t) is the added Gaussian white noise. After transposition, the equation can be expressed as

According to the operation characteristics and noise suppression characteristics of FRFT, the residual vector of

Following this, the correlation dimension, zero-order moment, and kurtosis coefficient of the residual vector are calculated as parameters quantitatively measuring the state characteristics.
After target tracking filtering, the signal of y(t) is obtained through fractal Fourier inverse transform from the residual vector

In order to test the effect of feature extraction, Pearson correlation coefficient between the original signal of X and residual signal of Y after target tracking filtering is calculated, its expression is
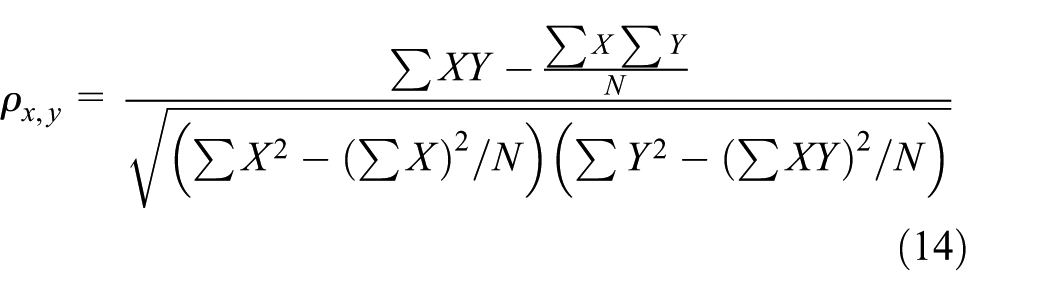
If
Algorithm and steps of target tracking fault diagnosis based on statistical moments and correlation dimension of FRFT
The algorithm and steps are as follows:
FRFT is utilized for the detection signal in different orders and the (p, u) plane of FRFT mode is established.
Kurtosis coefficient of FRFT mode vector is calculated in different orders, the curve of the kurtosis coefficient is fit, and the curve peak searched to obtain the corresponding optimal order.
Taking the normal signal as the tracking target, the difference between detection signal and the normal signal of FRFT mode in the optimal order is calculated, so the normal signal is filtered and the residual mode vector is extracted as the state feature vector.
Correlation dimension D, kurtosis coefficient
Taking state characteristic parameters obtained by multiple experimental detection and the corresponding state values as learning and training samples, the state of the actual detection signal is predicted using the CV-KNN algorithm. 18 The accuracy rate of prediction is calculated to evaluate the effect of diagnosis and prediction. This is done by separating the training sample and test sample through the m-cross-validation method, then calculating Euclidean distance between test samples and training samples using equation (15). The nearest K samples are selected and then the number of every category is calculated and the largest number of category labels is determined as the corresponding working state. Among them, recognition accuracy (precision, %) equals the right sample number is divided by the sum of recognition sample number at 100%

The process of state recognition and fault diagnosis is shown in Figure 5.

Flow chart of target tracking fault diagnosis method by FRFT.
Experiment verification and result analysis
The speed-regulating valve is a part of the machine (Figure 6(c)).The vibration signal was obtained by testing the speed-regulating valve in daily working conditions. The test system was composed of an ST-1-03 eddy current displacement sensor, LabVIEW software by National Instruments, the data acquisition card PCI-6014, DC power of PS-3030D, and a front-end processor and computer. Normal condition and four fault states were set in the test. During the test, the oil pressure range of speed-regulating valve ranged from 1 to 6 MPa, and the sampling frequency was 1024 Hz. The principle, experimental scene, and the back panel based on LabVIEW of vibration testing are illustrated in Figure 6(a)–(e).
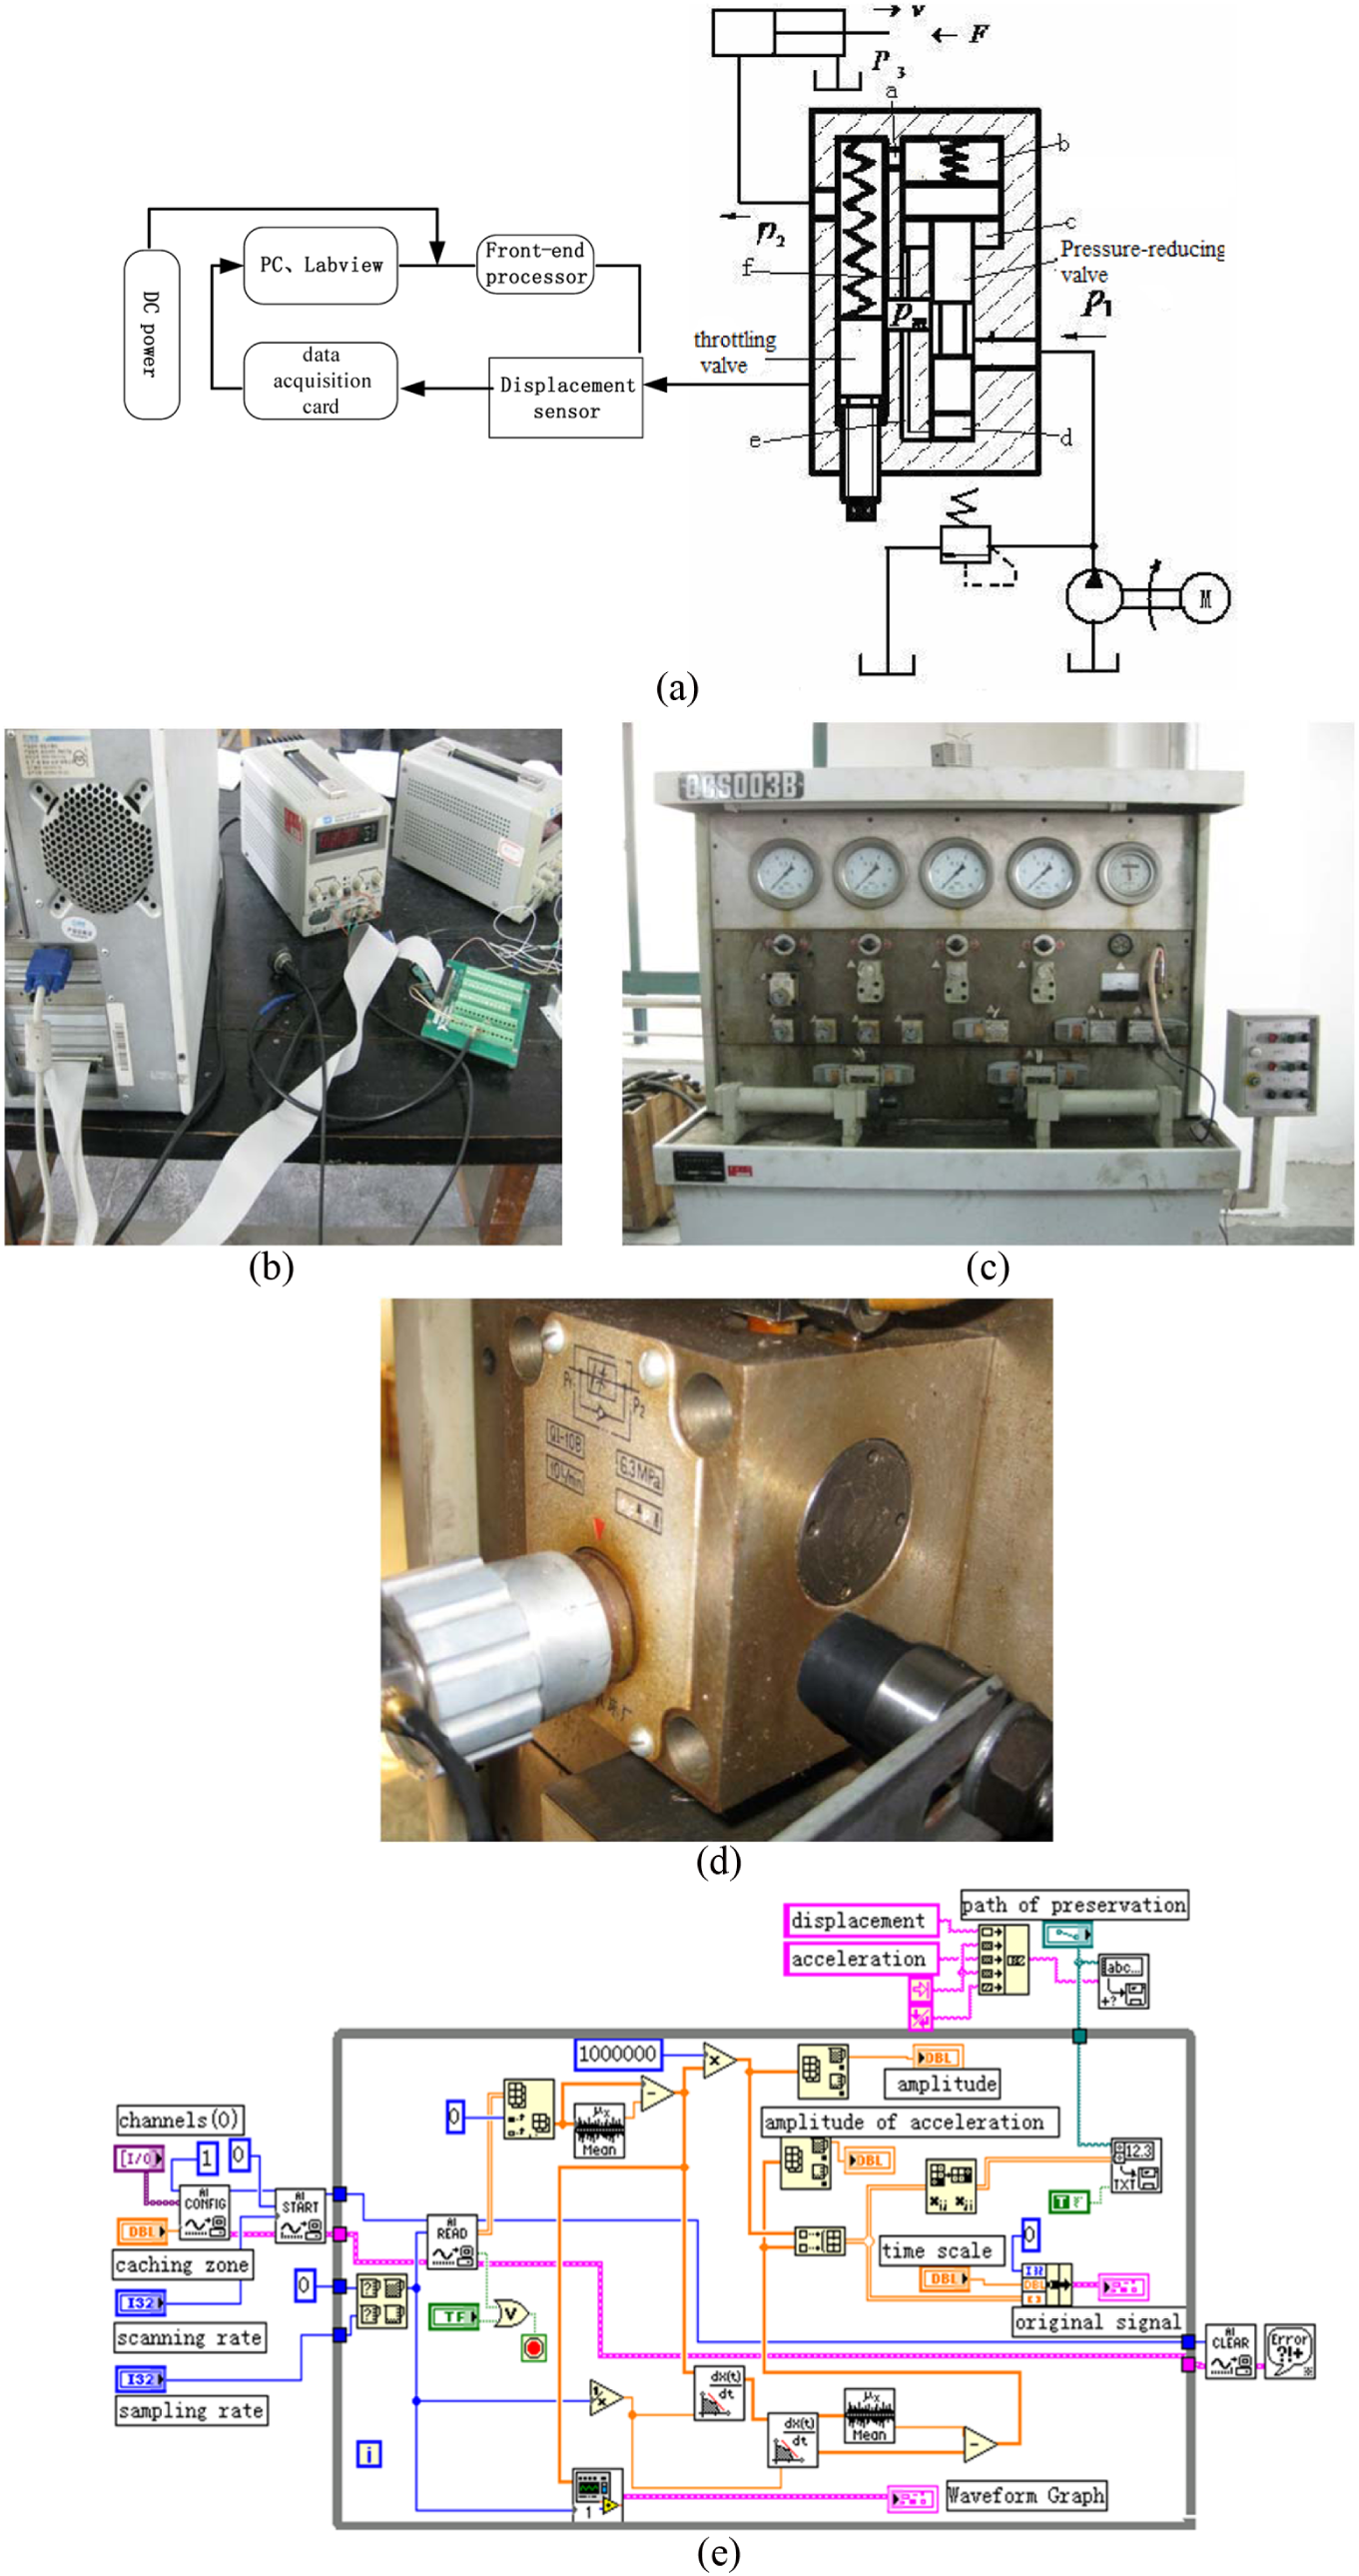
Principle and experimental scene of vibration testing: (a) the principle of vibration testing (a: channel 1; b: oil chamber; c: shoulder cavity; d: oil cavity; e: channel 2; f: channel 3); (b) experimental instrument of vibration testing; (c) the experimental machine; (d) the installation of senor on the speed-regulating valve; and (e) the back panel based on LabVIEW.
Vibration signal detection of the speed-regulating valve was performed in five working states being the normal state, the fault 1 state of spring deformation, fault 2 state of debris wound in the spring, fault 3 state of the valve core coming off, and fault 4 state of debris wound in the spring with the valve core off. At each state, 1025 points were detected and the detection time was 2.048 s. The interval was [–16,16] after the u-coordinate normalized and the scale factor S = 0.032 s. The FRFT mode vector of the detection signal in the order of p = 0–4 in which the interval is 0.02 was calculated under different conditions. The kurtosis coefficient of corresponding mode vector was then calculated and the
To compare the fault diagnosis effect, the feature vector was obtained using both the direct method and the target tracking diagnostic method. For the direct method, the FRFT mode vector in the optimal order was directly taken as the feature vector and then three characteristic parameters of feature vector were calculated. For the target tracking diagnostic method, each FRFT mode vector of detection signals and normal signals was, respectively, obtained in optimal order and then the residual vector, which is the state feature vector, was obtained by their subtraction. This distribution is shown in Figure 7. The three parameters are presented in List 1 and the Pearson coefficients between original signal and state character signal obtained by fractal Fourier inverse transform from the state vector are listed in Table 1.

Feature vector distribution of FRFT model after target filter.
State characteristic parameters of speed-regulating valve obtained by two diagnostic methods.

A total of 105 data groups of the speed-regulating valve were obtained through experimental testing. The feature parameters collected by the two feature extraction methods mentioned above and their corresponding state values were estimated, respectively, using the k-nearest neighbor (KNN) and CV-KNN method. For the KNN estimation method, 45 group parameters were taken as training samples and the other 50 or 60 groups were used for state prediction and recognition by the KNN method. The prediction results are presented in Figure 8(a) and (b) and the related parameters and prediction results are listed in Table 2. For the CV-KNN estimation method, 105 groups or 95 group parameters were selected for state prediction and recognition using CV-KNN method for m times. The relationship of correct rate recognition along with m (the times of cross-validation) and k are shown in Figure 9(a) and (b) and the related parameters and prediction results are listed in Table 3.

State estimation results of the speed-regulating valve by KNN: (a) KNN direct estimation method and (b) KNN target tracking filtering estimation method.
Related parameters and state estimation results by KNN.

KNN: k-nearest neighbor.
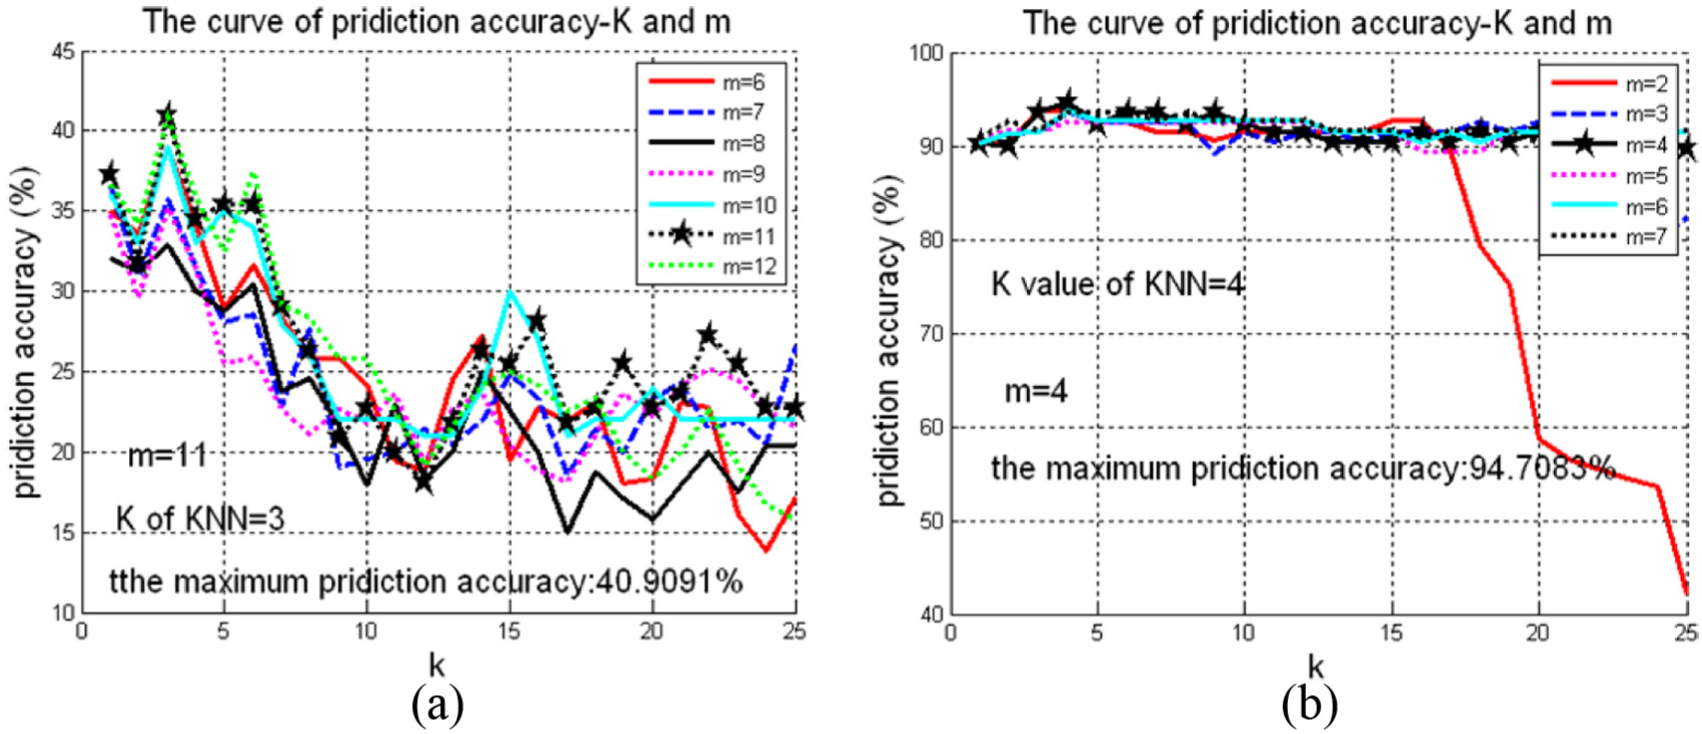
Correct rate changes along with m and k of the speed-regulating valve by CV-KNN: (a) CV-KNN direct estimation method and (b) CV-KNN target tracking filtering estimation method.
Related parameters and state estimation results by CV-KNN.

CV-KNN: k-nearest neighbor cross-validation; KNN: k-nearest neighbor.
Above methods are popularized and applied to pressure-reducing valve. A total of 51 vibration signal samples of time series are obtained by testing pressure-reducing valve in normal state and 3 fault states (foreign body in oil inlet, fault in oil outlet, fault in oil inlet and outlet). KNN direct estimation method, KNN target tracking filtering method, and CV-KNN target tracking filtering method are used, respectively. Following data are obtained when 23 samples are trained and 28 samples are tested, the correct rate of recognition is 46.43% using KNN direct estimation method, while the correct rate of recognition is 89.29% using KNN target tracking filtering method. The correct rate of recognition is 96.16% using CV-KNN target tracking filtering method when k = 2 and m = 2. This is in accordance with the identification results applied to the speed-regulating valve, and it also shows the superiority of CV-KNN target tracking filtering method in fault diagnosis.
By detecting the vibration signal of the real-time state of the speed control valve, state recognition is carried out by the FRFT target tracking filter and the KNN estimation method. The recognition result is the basis of the monitoring equipment operation condition. The real-time state recognition process is illustrated in Figure 10.

Flow chart of real-time status recognition.
Considering the calculated characteristic parameters and analysis of prediction results, the following points can be made:
Compared with the direct method, zero-order moment and kurtosis coefficient of FRFT mode vector in the optimal order by target tracking method decrease obviously, while correlation dimensions increase. After the target tracking filter, the total energy of FRFT mode vector decreases obviously, the spectra peak becomes flat, and distribution becomes more complex. The data also show that the difference of three parameters between different states clearly increases, and the state difference is more obvious.
The absolute value of the correlation coefficients in List 2 obtained by two kinds of methods is smaller, while the value obtained by the target tracking filter method reduces discernibly and is closer to zero than the value obtained by direct method. This demonstrates that there is low correlation between the FRFT filtered signal and the original normal signal, and the method of target tracking and filtering can be more effective in extracting state characteristics.
Comparing the state recognition effect of two methods in List 2 and List 3, the state recognition correct rate of target tracking method is about 95% and is far higher than the direct method. The target tracking method can more accurately recognize and diagnose faults. State recognition correct rate of the CV-KNN method based on FRFT target filter is the highest, making it more suitable for state recognition and fault diagnosis. The predicted result is largely affected by the cross-validation number of m and KNN of k.
The running speed of computation for the state recognition process by FRFT target tracking filtering method is faster than the direct method. The FRFT target tracking filtering method can be suitable for the real-time state recognition and diagnosis.
Conclusion
Using the analysis of fractal characteristics and statistical moments of the FRFT of vibration signal as a foundation, an algorithm for fault diagnosis based on FRFT target filter is proposed. A flow chart of the fault diagnosis method for target tracking in FRFT is also presented. Through testing and analysis of the effect of diagnosis through experiment, the following conclusions are obtained:
Kurtosis coefficient is a parameter to measure the peak distribution of FRFT mode vector quantitatively. It is a suitable method which provides a smooth Lorentzian peak for the kurtosis coefficient curve that can precisely search peak position and then obtain the optimal order.
Correlation dimension, zero-order moment, and kurtosis coefficient are three parameters of quantitative measure state characteristics. They can be used for quantitative state recognition and fault diagnosis.
The target tracking and filtering method based on the FRFT domain reconstruction feature vector with normal working state can suppress noise and interference, extract state features accurately, and effectively identify state and diagnose faults.
Combined with CV-KNN method, the algorithm of target tracking method based on statistical moment and correlation dimension in FRFT domain is simple, the correct rate of state recognition is high, the stability of diagnosis result is favorable, and diagnosis efficiency is strong. This method can be applied to real-time fault diagnosis and real-time state recognition for general mechanical vibration equipment.
Footnotes
Handling Editor: Jan Torgersen
Declaration of conflicting interests
The author(s) declared no potential conflicts of interest with respect to the research, authorship, and/or publication of this article.
Funding
The author(s) disclosed receipt of the following financial support for the research, authorship, and/or publication of this article: This work was funded by the Guiding Science Project of Fujian province (2018H0031), Science Project of Fujian Province (2014H6021), Putian Science and Technology Project (2015G2013), The Youth Science and Technology Project of the Fujian Provincial Education Department (JA15437), Opening Foundation of Fujian Laser Precision Machining Engineering Technology Research Center, and Key Laboratory of Modern Precision Measurement and Laser Nondestructive Detection (2016JZA010).