
Abstract
The applied straightening moment and the springback after unloading with respect to the straightening process of rectangle-section metal bars have a direct influence on the straightening accuracy and efficiency. In this article, an asymmetrical hardening material model is first proposed to describe the stress–strain curves considering the asymmetrical features of yield stress and plastic hardening stage in tension and compression, and it is also compared with the traditional linear hardening material model. To accurately evaluate the elasto-plastic bending deformation and the springback in the straightening process, an analytical model for the loading and unloading moments is then established. The strain and stress distributions in elastic and plastic regions during the straightening process are also discussed in this article. Finally, the straightening experiments of rectangle-section metal bars under different heat-treated conditions are conducted on the ROSE-JZ50 straightening machine with displacement sensors, force sensors and strain gauges to validate the proposed analytical straightening model.
Keywords
Introduction
Metal bars, such as linear guide rail, motor shaft and tube, are important parts applied in various automated equipment. Especially, the accuracy demanded for the straightness is increased when they are used as the guiding components. Three-point pressure straightening approach has been applied to the straightness correction of linear guide rails. The straightening stroke is normally calculated using initial deflection and springback to guarantee the minimum residual deflection. 1
The springback effects have a significant influence on the accuracy of straightening process. Springback is usually regarded as the elastically driven deformation after the straightening loads are removed from workpiece, which is a common phenomenon during the unloading in the bending process. Therefore, the straightening accuracy can be improved by an accurate prediction of springback, and it is also a challenge for bending analysis.
The advancement of straightening theory and technology relies on the development of elasto-plastic bending theory. Established straightening models are summarised as follows.
The analytical model based on straightening moment and curvature
The aim of the model is to reveal the relationship between moment and curvature in the straightening process, including the curvature ratio, moment ratio and deflection ratio. Megharbel et al. 2 established the theoretical moment model of straightening process for pipe based on elasto-plastic bending theory. They also demonstrated the influences of geometrical model, deflection distribution and straightening times on the prediction accuracy of straightening process. Natarajan and Peddieson 3 established the straightening moment–curvature model based on the pure bending theory and small deformation theory. The relationship between initial curvature and strain distribution was also presented by bending experiments. Song and Yu 4 established the predictive model of springback for the T-section rail, as well as the analytical equations of residual curvature, considering the work hardening material model. Yin et al. 5 proposed an analytical model of H-beam about the multi-roller straightening process based on pure bending theory to explore the relationship between curvature and residual deflection.
However, the curvature equation is normally obtained by the multi-point fitting of the measured data based on straightening moment and curvature. Due to the fitting errors in the calculation of straightening model, the analytical model based on straightening moment and curvature is not applicable to the high-precision straightening process.
The analytical model based on straightening pressure and deflection
The load–deflection straightening models have been widely used in three-point pressure straightening process. The mathematical model of straightening stroke is established based on the relationship between the applied straightening pressure and the initial deflection of workpiece. Tsai and his collegues6,7 developed the load-stroke straightening model for the cantilever beam with rectangular cross section under uniformly distributed loading. Kosel et al. 8 proposed the deflection model of symmetrical beam in the elasto-plastic bending process considering repeated loading–unloading process. In the relevant research of Zhao and Song, 9 the multi-step straightening method was applied on the longitudinally submerged arc welding pipes. Besides, they proposed a quantitative method to calculate the theoretical straightening moment and deflection. Mujika et al. 10 performed the analysis corresponding to three-point and four-point bending straightening process, in which the load–displacement curve was obtained with modulus matches and experimental curves considering the effects of horizontal displacements.
In sum, compared with the analytical model based on straightening moment and curvature, the predictive accuracy of the analytical model based on straightening pressure and deflection is higher without the fitting errors. Besides, the load–deflection straightening model can be directly applied to the straightening process through the force control.
The straightening model based on finite element method and intelligent algorithm
In addition to the theoretical models, the numerical methods and intelligent algorithms are also widely applied in the modelling of straightening process. It is effective to use the finite element analysis method for the straightening process of workpieces with complex geometrical features and different material properties. Choi et al. 11 performed the numerical analysis for the springback of rebar bending process, as well as the finite element analysis of dynamic mechanical behaviour during the bending process. Zhang and Wu 12 simulated the bending and springback process of minor-diameter thick-walled tube to reveal the springback laws. Petruška et al. 13 presented a finite element formulation aiming at the modelling of cross roll straightening process with respect to circular bars based on Eulerian description of elasto-plastic material properties. Besides, the intelligent algorithms, including neural network algorithm, data mining algorithm and adaptive algorithm, have been applied to promote the predictive accuracy of straightening stroke and the stress distribution under different loading conditions. Kazan et al. 14 developed the predictive model of springback in the wipe-bending process based on artificial neural network, considering sheet thickness, tooling geometry, lubrication conditions, material properties and processing parameters. Song and Yu 15 proposed the predictive model of springback using finite element method, and the material parameters were identified by the artificial neural network approach.
The constitutive models with respect to the material properties of linear guide rails have a direct influence on predicting the loading moment and springback of straightening process. The material models in recent research mainly include the following: ideal plastic hardening model, linear work hardening model and power-exponent work hardening model. Carden et al. 16 established the constitutive models of low-strain behaviour with linear work hardening material model, and the corresponding springback angle and curvature were measured by the strip draw-bend tests. Eggertsen and Mattiasson 17 investigated the differences of hardening parameters obtained by bending tests and tensile/compressive tests, considering cyclic loading history. Chongthairungruang et al. 18 investigated the springback effect of U-shape forming process with the anisotropic material model and the kinematic work hardening material model. Nikhare 19 predicted the springback of three-dimensional (3D) channels with the power-exponent work hardening model considering geometric change and welded blank.
The above material models are established by the experimental data of uniaxial tensile tests to explore the constitutive relationship between strain and stress. Besides, the stress–strain responses are assumed to be approximately the same in tension and compression. However, the experimental results have revealed that the asymmetries exist in both the initial yield stress and subsequent flow stress in continuous tensile and compressive tests. These asymmetrical features were first reported by Lou et al. 20 for O-tempered magnesium, and the results showed that there were differences in the yield stresses and the hardening curves. Lee et al. 21 defined the asymmetrical mechanical behaviour of magnesium alloy with the discrete linear hardening in tension and compression, and the constitutive models of asymmetrical elasto-plastic bending were developed to accurately evaluate the springback.
In this article, to accurately predict the applied straightening moment and the springback after unloading, an asymmetrical hardening material model is proposed to describe the stress–strain relationship in tension and compression. The analytical model is then established to evaluate the straightening moment and the springback in the straightening process using both asymmetrical hardening material model and traditional linear hardening material model. Finally, the straightening experiments of the rectangle-section linear guide rails have been conducted on the ROSE-JZ50 straightening machine to validate the proposed analytical straightening model.
Material model considering asymmetrical hardening features
The accuracy of material model is one of the key factors influencing the prediction results for the straightening process. The constitutive relationship between strain and stress, which is nonlinear for the elasto-plastic bending process, is normally simplified to linear hardening material model. The stress–strain curves in tension and compression are assumed symmetrical in the linear hardening material model. In order to consider the asymmetrical features revealed by the uniaxial tension and compression tests, an asymmetrical hardening material model is proposed to explore the influences of material model on the straightening process.
Tension and compression tests
The material of workpiece used in this article is S55C (medium-carbon steel) and its chemical composition is listed in Table.1. The true stress–strain curves of S55C steel are obtained by the uniaxial tension and compression tests conducted on the electro-hydraulic servo universal testing machine (MTS SHT4106-G).
Chemical composition of S55C steel.

The geometry of specimen for the uniaxial tension and compression tests is shown in Figure 1. According to the heat-treated conditions, the specimens are divided into two groups: normal specimens and quenched and tempered specimens. In each group, three specimens have been tested by the uniaxial tension and compression tests to guarantee the reliability of experimental results.

Schematic representation of specimens for the (a) uniaxial tension tests and (b) compression tests.
The stress–strain curves of different specimens by the uniaxial tension and compression tests are shown in Figure 2. The tensile process consists of three main stages: elastic deformation stage, yield stage and hardening stage. The relationship between strain and stress is approximately linear in the first stage, and Young’s modulus E and the elastic limit

Measured stress–strain curve of S55C steel by uniaxial tension and compression tests: (a) normal specimen and (b) quenched and tempered specimen.
The measured material parameters by the uniaxial tension and compression tests are listed in Table 2. In terms of the specimens under different heat-treated conditions, the yield stress in tension and compression, as well as the flow stress in the hardening stage, is obviously different, and this phenomenon is more significant in the tests of quenched and tempered specimens. The flow stresses during the hardening stage of tensile and compressive process are both concave-down shape. However, the plastic hardening rate in the hardening stage of compressive process is similar to that in tensile process.
Material parameters obtained by the uniaxial tension and compression tests.

Linear hardening material model
The linear hardening material model is commonly used to describe the constitutive relationship between strain and stress in elasto-plastic analysis. It assumes that the stress–strain curves of tension and compression are symmetrically distributed based on the results of uniaxial tension test. The linear hardening material model is fitted considering the actual range of straightening strain to improve the accuracy of the material model, as shown in Figure 3. 22 Despite having some slight differences, the fitted linear hardening material model can represent the main features of the stress–strain curves obtained by the uniaxial tension tests. The linear hardening material model is expressed as follows


Stress–strain curves of linear hardening material model: (a) normal specimen and (b) quenched and tempered specimen.
Asymmetrical hardening material model
According to the results of the tension and compression tests as shown in section ‘Tension and compression tests’, it is noticed that the yield stresses and the hardening curves are asymmetrical in tension and compression, especially for the heat-treated specimens. The asymmetrical hardening material model is proposed to improve the accuracy of constitutive equation in the elasto-plastic bending process. The stress–strain curves for the normal specimen and the quenched and tempered specimen are illustrated in Figure 4.
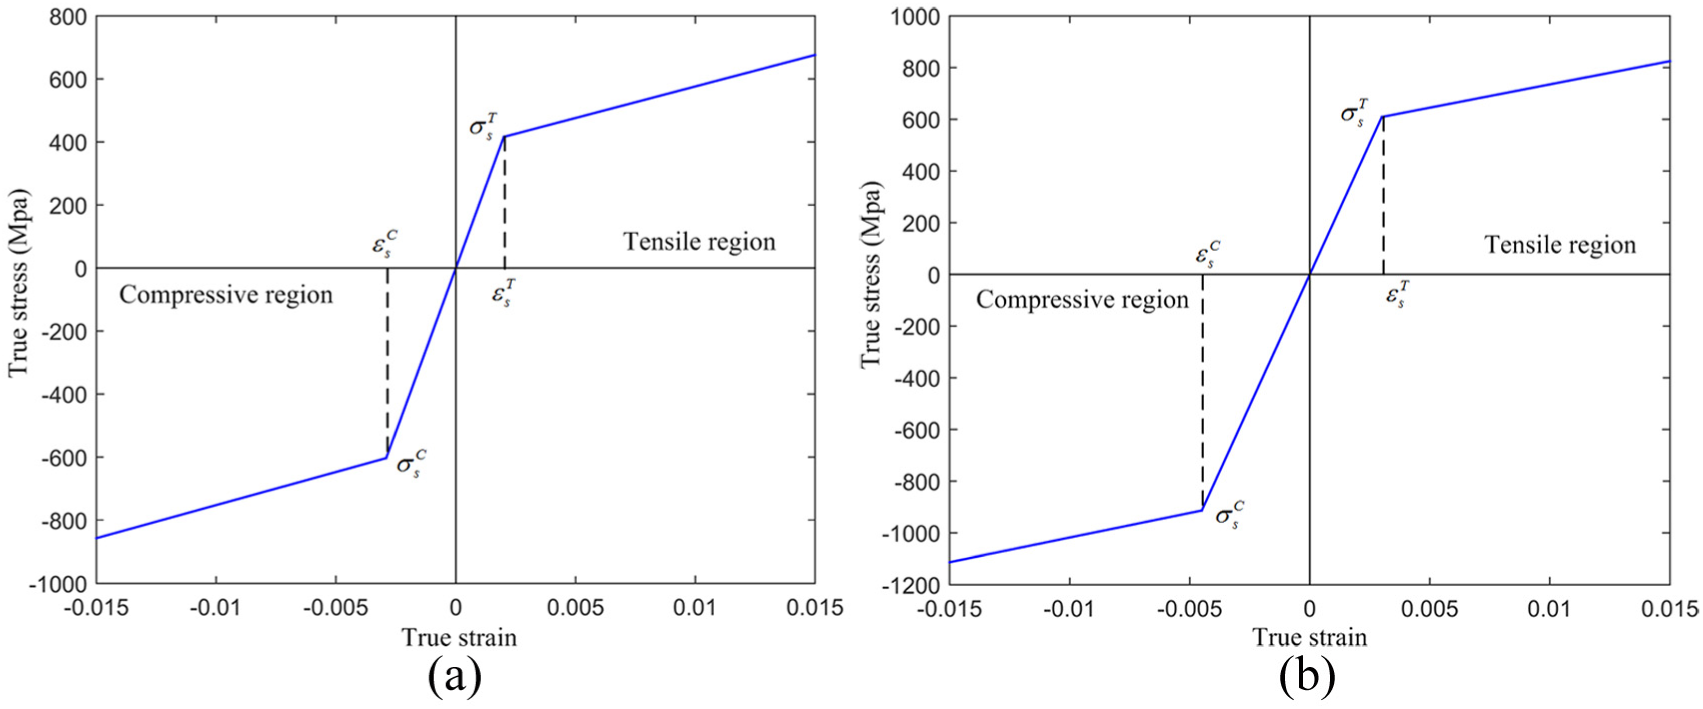
Stress–strain curves of asymmetrical hardening material model: (a) normal specimen and (b) quenched and tempered specimen.
The asymmetrical hardening material model can be expressed as follows

Analytical model for the straightening process
Basic assumptions
The schematic representation for the straightening process of rectangle-section linear guide rails is illustrated in Figure 5, in which the indenter and the fixed supports are horizontally installed. The cross section of linear guide rail is regarded as a rectangle of width B and height H. Based on the assumptions for symmetrical material model, the assumptions for the analytical model considering asymmetrical stress–strain behaviour are summarised as follows:
The plane section remains planar during straightening process.
The transverse stress between longitudinal fibres is ignored.
The strain of neutral surface is constantly equal to zero.
The strain during straightening process is proportional to height coordinate from neutral surface.
The deflection of workpiece is far smaller than the distance of two supports.
The elastic modulus for the tension and compression is the same.

Schematic representation of the straightening process.
Straightening moments
The straightening process is actually the bending process with external moment. According to the moment equilibrium theory, the internal bending moment is equal and opposite to the applied external moment. Besides, the position of neutral surface is determined by the geometry of cross section and the stress–strain curve. Due to the asymmetrical features of the proposed material model, the neutral surface moves during the elasto-plastic bending process. Based on the assumption about elastic symmetry, the position of neutral surface is initially at the centreline of geometrical model. However, the neutral surface moves in the plastic deformation stage. The partial unloading caused by the translation of neutral surface is ignored in the modelling of elasto-plastic bending process. As the position of neutral surface is always in the elastic region for common straightening processes, the loading and unloading processes can be regarded as the same.
The strain distribution during the elasto-plastic bending process can be given as follows

where A is the curvature variance at the neutral surface.
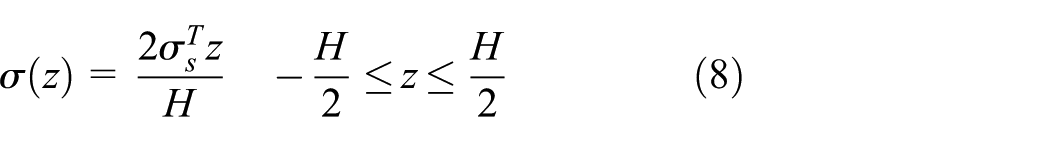
When the maximal stress caused by the applied straightening moment is smaller than the yield stress in both tensile and compressive regions, the initial stage of the straightening process is purely elastic deformation. The strain and stress distribution along the height direction is shown in Figure 6. As the elastic modulus is assumed to be the same for the both tension and compression, the translation of neutral surface in this stage is zero

The stress distribution in the cross section can be calculated as follows


Strain and stress distribution in the elastic deformation stage.
The corresponding straightening moment can be calculated by the integration multiplying the stress and the coordinate from real neutral surface

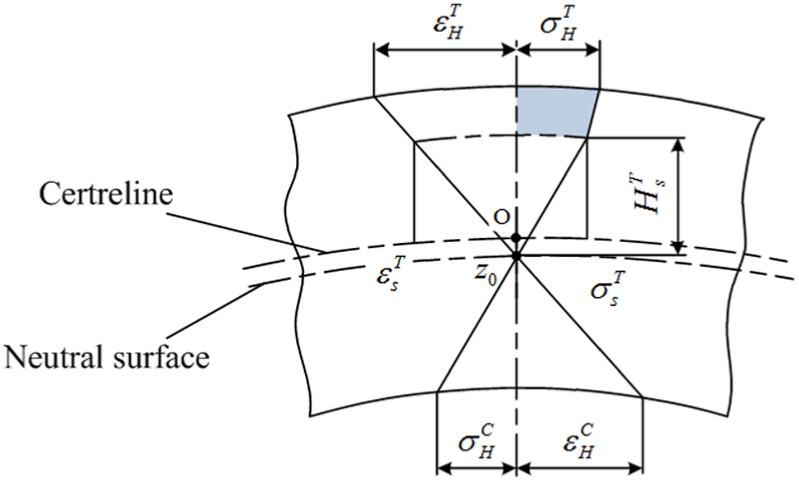
With the increase in the applied straightening moment, the yield would originate at the outer surfaces of workpieces. Depending on the symmetrical linear hardening material model, the plastic deformations generate simultaneously in both tensile and compressive regions. However, in terms of the asymmetrical hardening material model, the plastic deformations generate sequentially in the tensile and compressive regions, and the asymmetry would result in the translation of neutral surface. The yield initially occurs in the tensile region because of the lower yield stress, and the strain and stress distribution is shown in Figure 7 when the outer surface of tensile region reaches elastic limit.

Strain and stress distribution at the elastic limit of tensile region with
The strain on the surface of tensile region can be given as follows

where
The stress distribution in the cross section at this moment can be expressed as follows
Then, the bending moment of elastic limit can be calculated as follows

When the applied straightening moment increases, the plastic deformation continues from the outer surface of tensile region, while the elastic deformation remains in compressive region. The strain and stress distribution before the compressive yield is shown in Figure 8, and the strain distribution in this stage can be calculated by equation (3).
Strain and stress distribution with
For the corresponding curvature of the applied straightening moment, the height of elastic region from the neutral surface in the tensile region can be calculated as follows

In this stage, the stress distribution in the cross section of workpiece is calculated as follows

where
Then, the applied straightening moment is given as follows

As shown in equations (10) and (12),
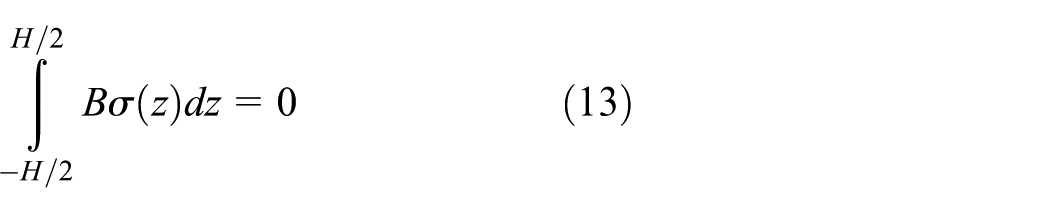
Based on equation (13), the relationship between

According to equation (12), the applied straightening moment in this stage can be finally calculated as follows

In the following loading process, the plastic deformation would occur at the outer surface of compressive region, as shown in Figure 9. The stress of the outer surface in compressive region is exactly equal to the elastic limit in compression. The strain can be calculated as follows


Strain and stress distribution at the elastic limit of compressive region with
Based on the equilibrium conditions shown in equation (13), the relationship between

Then, the applied straightening moment is given as follows
The plastic deformations of both tensile and compressive regions would reach the linear hardening stages with


Strain and stress distribution with
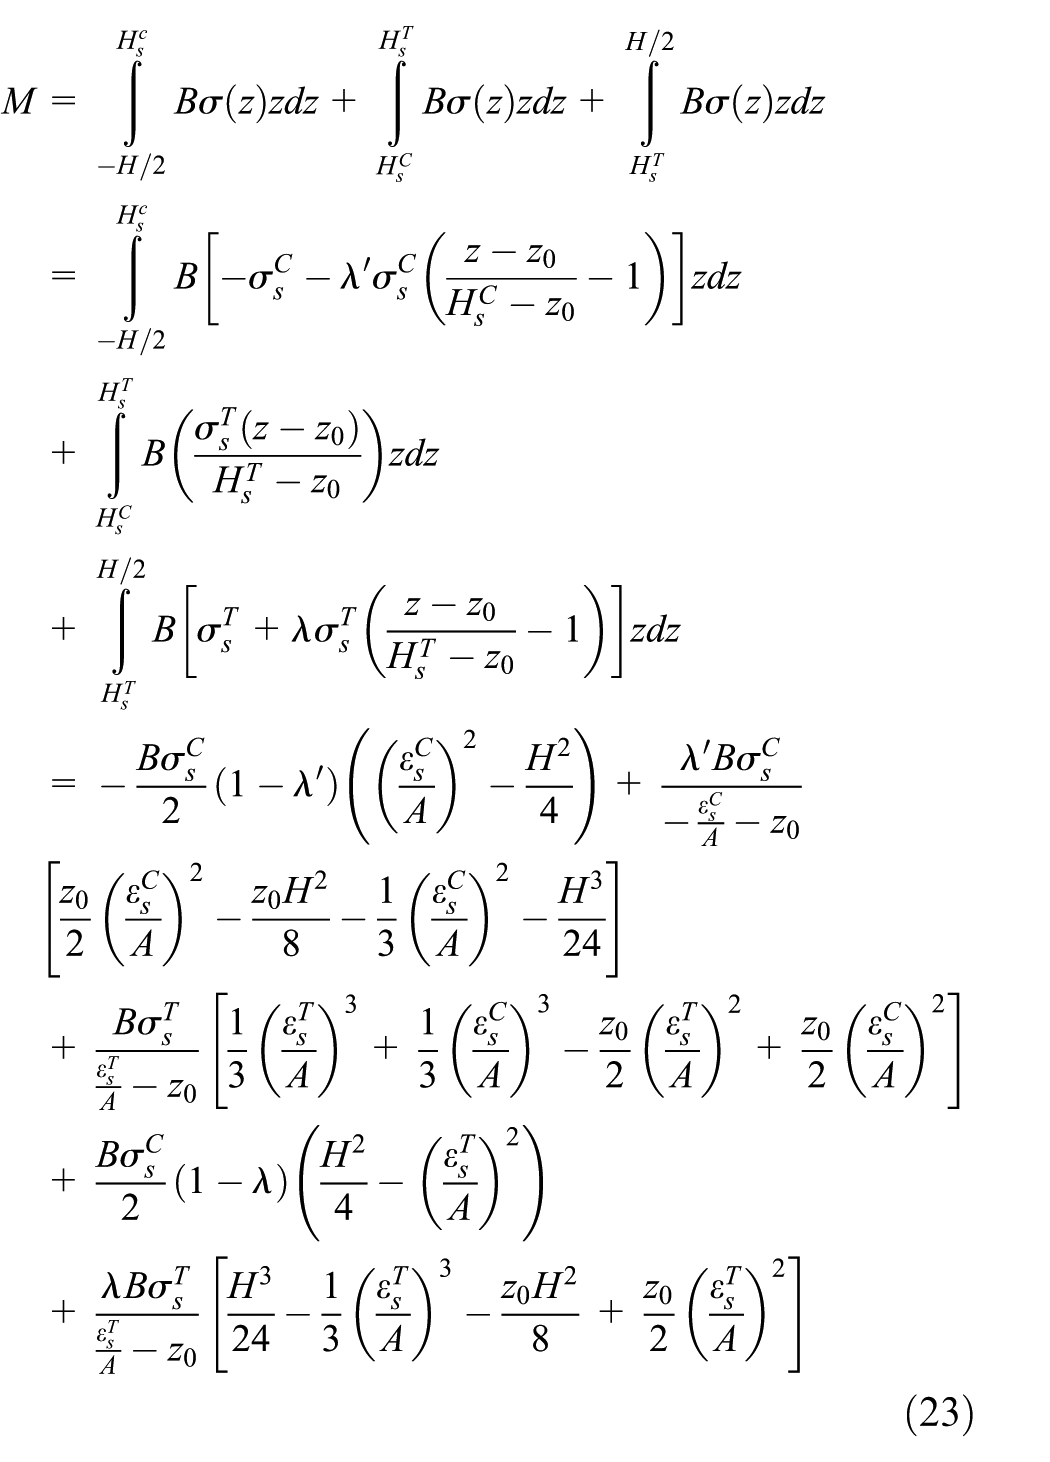
The stress distribution in the cross section during this stage can be calculated as follows

where
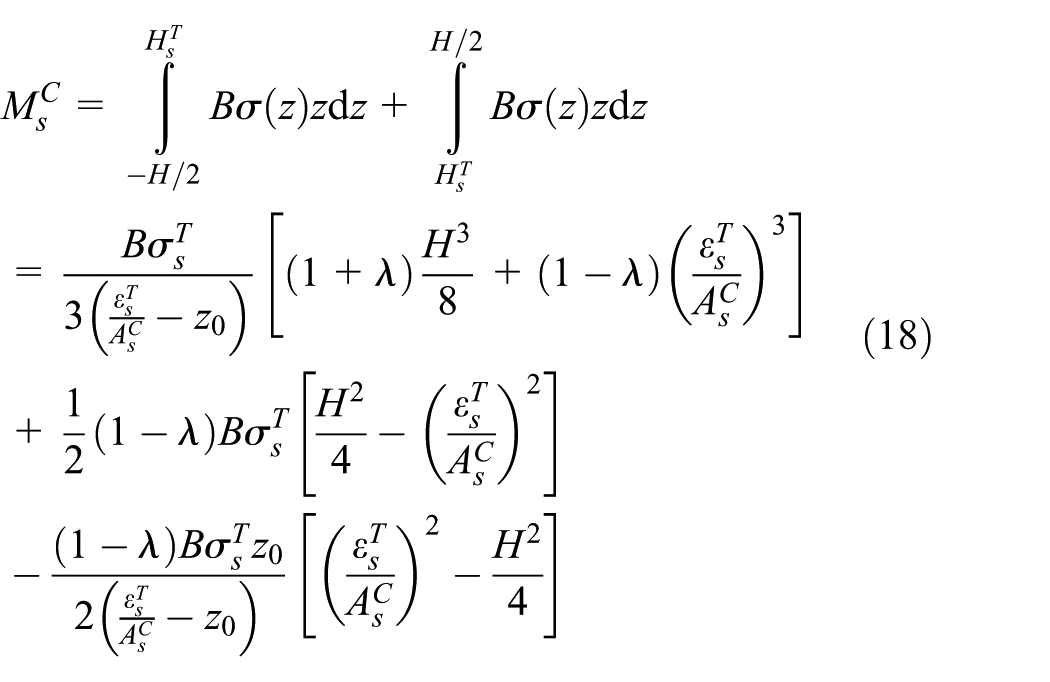
The corresponding moment can be calculated as follows

The position of neutral surface can be obtained by the following equilibrium equation

Finally, the applied straightening moment in this stage is calculated as follows
Experiments
The schematic representation for the straightening experiments is illustrated in Figure 11, in which an inductive pen and a linear scale are used to measure the deflection of workpiece and the displacement of indenter, respectively. Besides, a pressure sensor is horizontally fixed on the indenter to measure the actual applied force during the straightening process. The strain gauges are symmetrically pasted on both sides of workpiece using quarter-bridge circuit, thereby obtaining the surface strains and observing the asymmetry during straightening process. The experimental platform (straightening machine: ROSE-JZ50) of three-point pressure straightening tests is illustrated in Figure 12.

Schematic representation of straightening tests with displacement sensors, pressure sensors and strain gauges.

Experimental platform for straightening tests (straightening machine: ROSE-JZ50).
Results and discussion
The material parameters for the normal specimen and the quenched and tempered specimen adopted in the straightening experiments are listed in Table 2. Figure 13 demonstrates the moment–curvature curves for different specimens using the linear hardening material model (Figure 3) and the asymmetrical hardening material model (Figure 4). It can be noticed that the straightening process can be divided into three regions with the increase in bending curvature. As shown in Figure 13(a), the specimen deforms elastically within
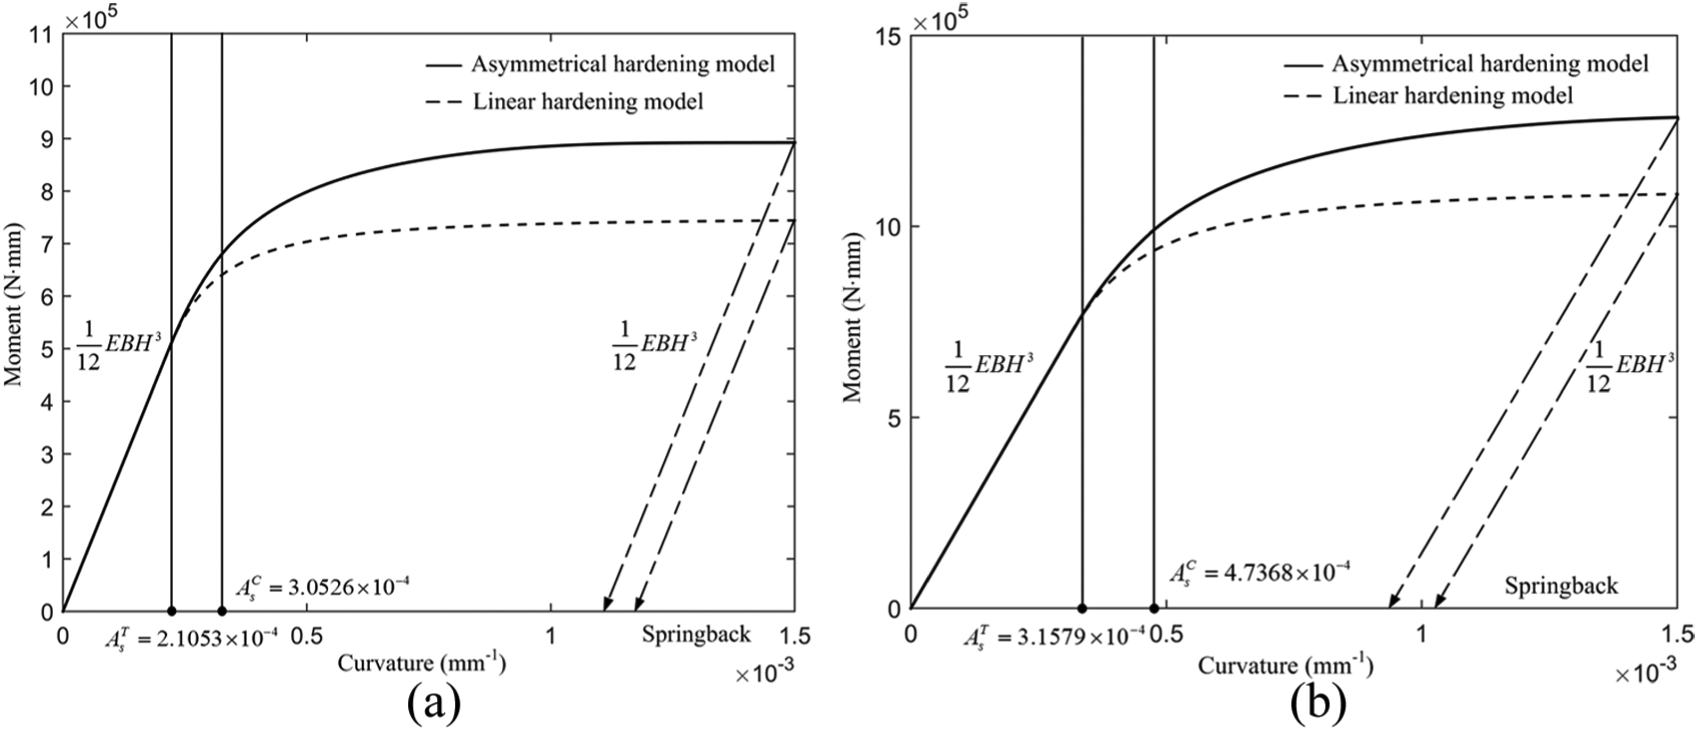
Comparison of moment–curvature curves using the linear hardening material model and the asymmetrical hardening material model: (a) normal specimen and (b) quenched and tempered specimen.
Besides, the moment–curvature curves for the same specimens using the linear hardening material model are compared with those using the asymmetrical hardening material model, as shown in Figure 13. Due to the asymmetrical features of yield stress and flow stress, the moment calculated with the asymmetrical hardening material model is larger than that with the linear hardening material model in plastic regions.
The variation of the elastic and plastic regions, as well as the deviation of neutral surface during bending process, is calculated and shown in Figure 14. It can be noticed that the plastic deformation initiates at the tensile region and then occurs in the compressive region as a result from the asymmetrical features of material model. The neutral surface moves to the compressive region in the second stage, mainly caused by the linear hardening of tensile region. As the yield stress in compression is larger than that in tension, the neutral surface keeps in the compressive region during the bending process.

Variation of elastic and plastic regions: (a) normal specimen and (b) quenched and tempered specimen.
To explore the strain variations of outer surfaces during the straightening process, the relationship between curvature and surface strains with the linear hardening material model and the asymmetrical hardening material model is calculated and shown in Figure 15. In terms of the straightening process with the linear hardening material model, the surface strains are symmetrically distributed about the centreline of cross section. However, due to the deviation of neutral surface calculated with the asymmetrical hardening material model, the asymmetrical features of surface strains in tensile and compressive regions are illustrated in Figure 15. Figure 16 demonstrates the relationship between deflection and surface strains based on experimental and theoretical results using the asymmetrical hardening material model. It can be detected that the asymmetrical features of deflection–strain curves exist in the experimental results, even though it is not very obvious because of the limitation of measuring accuracy.
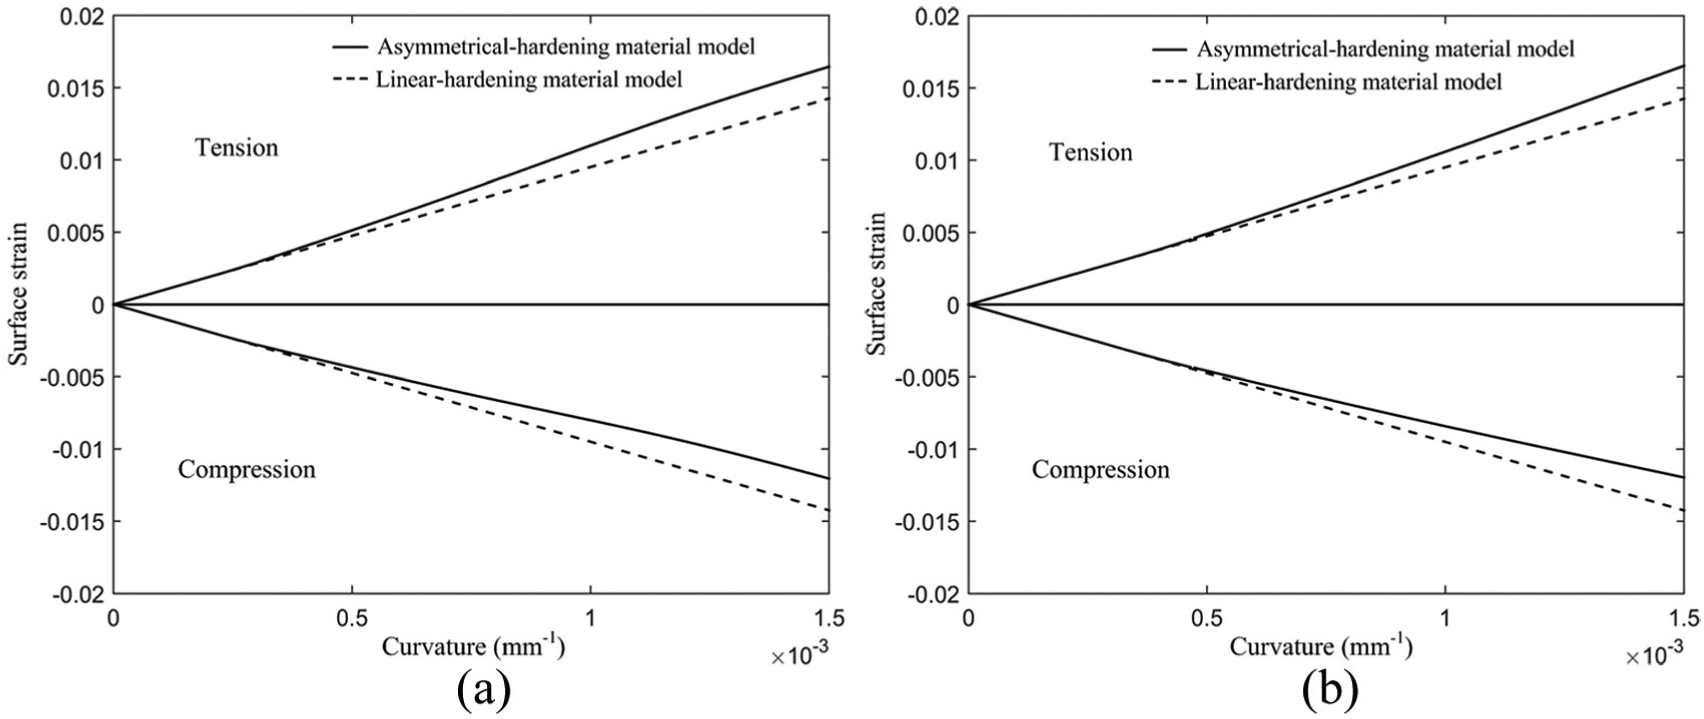
The relationship between curvature and surface strains with the linear hardening material model and the asymmetrical hardening material model: (a) normal specimen and (b) quenched and tempered specimen.

The relationship between deflection and surface strains based on experimental and theoretical results with the asymmetrical hardening material model: (a) normal specimen and (b) quenched and tempered specimen.
When the applied external moment M is unloaded after the straightening, the unloading process can be regarded as the elastic effect caused by the loading moment M, if the unloading process would not lead to the reverse yielding. Based on the assumptions in section ‘Basic assumptions’, the relationship between the springback and the applied straightening moment is given as follows

where
To guarantee the accuracy of straightening process, the residual deflection

where u is the maximum of the required linearity.
As a result, the straightening stroke is calculated as follows

where
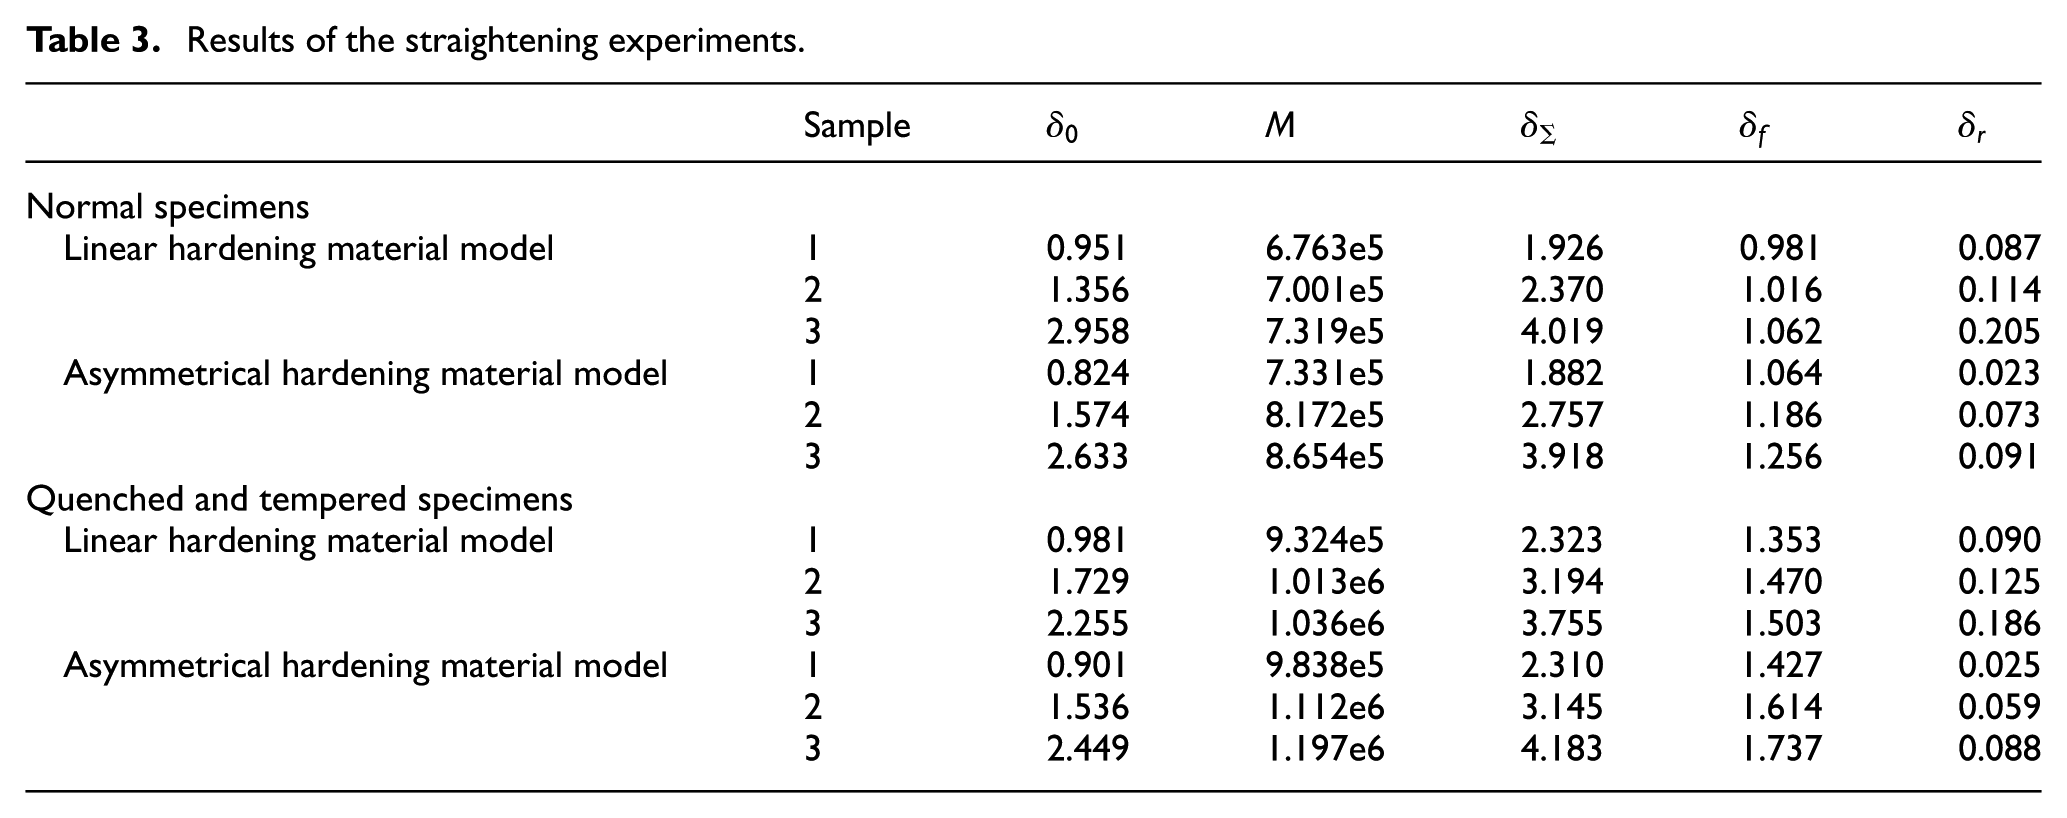
Finally, the straightening experiments are conducted to validate the predictive accuracy of the proposed method, in which the straightening stroke for different specimens is predicted using the linear hardening material model and the asymmetrical hardening material model, respectively. The straightening parameters and the experimental results are listed in Table 3, including initial deflection
Results of the straightening experiments.
Conclusion
In this article, the asymmetrical hardening material model is proposed to describe the stress–strain curves considering the asymmetrical features of yield stress and plastic hardening stage revealed by the uniaxial tension and compression tests. The analytical models for the loading moment, unloading moment and springback are also established with both asymmetrical hardening material model and traditional linear hardening material model. The following could be concluded:
The asymmetrical hardening material model is proposed to describe the stress–strain curves considering the asymmetrical features in tension and compression, including the yield stress and the flow stress in hardening stage.
Based on the assumptions for the straightening process, the analytical model is established to evaluate the elasto-plastic bending deformation and the springback using both asymmetrical hardening material model and traditional linear hardening material model.
Finally, the straightening experiments for the rectangle-section linear guide rails have been conducted on the ROSE-JZ50 straightening machine to validate the proposed analytical straightening model. The comparison of experimental and theoretical results demonstrates that the proposed method can effectively improve the accuracy of straightening process.
Footnotes
Appendix 1
Handling Editor: Farzad Ebrahimi
Declaration of conflicting interests
The author(s) declared no potential conflicts of interest with respect to the research, authorship and/or publication of this article.
Funding
The author(s) disclosed receipt of the following financial support for the research, authorship and/or publication of this article: This work was supported by the National Natural Science Foundation of China (nos 51675393, 51375197 and 51505355), the Fundamental Research Funds for the Central Universities (no. 2016-YB-021) and the Chinese Government Scholarship by the China Scholarship Council (no. 201706950051).