
Abstract
Bearings are crucial for industrial production and susceptible to malfunction in rotating machines. Image analysis can give a comprehensive description of vibration signal, thus, it has achieved much more attention recently in fault diagnosis field. However, it brings lots of redundant information from a single spectrum image matrix behind rich fault information, and massive spectrum image samples lead to exacerbation of this situation, which readily results in the accuracy-dropping problem of multiple local defective bearings diagnosis. To solve this issue, a novel feature extraction method based on image sparse representation is proposed. Original spectrum images are acquired through fast Fourier transformation. Sparse coefficient that reveals the underlying structure of spectrum image based on raw signals is extracted as the feature by implementing the orthogonal matching pursuit and K-singular value decomposition algorithm strategically, and then two-dimensional principal component analysis is applied for further processing of these features. Finally, fault types are identified based on a minimum distance strategy. The experimental results are given to demonstrate the effectiveness of the proposed method.
Introduction
Bearings as general components cover a broad range of rotating machinery and play a crucial role in it. Some data imply that bearing failure is one of major causes of machine failure, 1 which may lead to serious break-downs and cause significant economic losses and even casualties.2–4 Thus, it is necessary for bearing fault diagnosis, which has attracted sustained attention with the enhancement of the machinery automation during the past decades.
Analysis of vibration signal is a preferred idea for local bearing fault diagnosis generally, and fault diagnosis of bearings is actually a classification task. Based on the above idea, plenty of signal processing methods have been designed to extract features, such as Hilbert–Huang transform (HHT) 5 and wavelet analysis. 6 Then, various features extracted from vibration signal in form of scalars or vectors are used for fault classification, such as amplitude, spectral kurtosis, and skewness.7,8 For the purpose of improving the performance of classification, research about fault diagnosis and classification has paid much attention to multi-features information fusion,9–14 which involves time domain, frequency domain, or time–frequency domain. For example, Khelf et al. 15 selected several relevant features via indicator evaluation for fault diagnosis of rotating machines. However, end effects or mode-mixing problem limits accuracy of the signal mode decomposition in HHT, and energy leakage is inevitable whatever wavelet basis is. 16 Features extracted based on these methods as fault indicators are insensitive to local damage and easily influenced by even weak noise.
Recently computer visual technology has been applied in the field of fault diagnosis. 17 Visual identification by image maybe the most direct and efficient approach. 18 The images of vibration signals contain rich information related to time domain, frequency domain, or time–frequency domain, and diagnosis based on images has been paid more and more attention. Li et al. 19 first realized bearing fault–type recognition directly based on spectrum image of vibration signal. However, due to interference factors in images, several diagnostic results are still unsatisfactory. In general, these methods have some limitations in mining useful information from signals for bearing fault diagnosis and classification.
Currently, there has been a growing interest in the study of sparse representation as the core theory of the signal compressed sensing (CS), and it provides the possibility of solving the above problem. Signals are described as sparse linear combinations of prototype atoms by using an over-complete dictionary and sparse coefficient. 20 Rubinstein et al. 21 made enormous contributions to the sparse representation theory and proposed the K-singular value decomposition (K-SVD) algorithm in this field. Mallat and Zhang 22 pointed out that a signal can be considered as several atoms that are key component elements of an over-complete dictionary linear combination. The effectiveness of sparse representation based on vibration signal has been preliminarily explored for mechanical diagnosis. 23 Sparse representation has been applied to bearing fault classification. 24 Qin et al. 25 structured a synthetical transform basis dictionary, and then fault components of vibration signal were extracted by iteratively using basis pursuit algorithm. Liu et al. 26 employed matching pursuit (MP) with time–frequency atoms for feature extraction, and it is proved to be a promising method compared with continuous wavelet transform and envelope detection.
In this article, a novel bearing fault diagnosis method is proposed, and it uses the sparse coefficients of spectrum image as the features based on vibration signal. First of all, the frequency spectrum images of normal and faulty bearings are achieved based on fast Fourier transformation (FFT) of vibration signals, where all images are with the same resolution. Then, sparse coefficient of spectrum image is extracted as the feature by implementing the orthogonal matching pursuit (OMP) 27 and K-SVD algorithm strategically. Essentially, over-complete dictionary learning is employed as an adaptive feature extraction method regardless of any prior knowledge. Finally bearing fault categories are classified by using a minimum distance method after feature dimension reduction based on two-dimensional principal component analysis (2DPCA).
The rest of this article is organized as follows. Section “The principle of sparse representation” sketches out the principle of sparse representation. Section “Fault diagnosis based on the spectrum image sparse representation” introduces fault diagnosis based on the spectrum image sparse representation, including image generation with FFT, feature extraction based on sparse representation and classification strategy. Section “Experimental verification” presents the experimental analysis. The conclusions are given in section “Conclusion.”
The principle of sparse representation
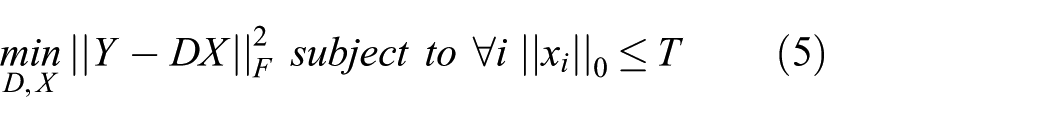
In recent years, most of the published work related to sparse representation has been focused on fault diagnosis. Sparse representation is a modeling of the signal and is used to represent the signal characteristics. Formally, if x is a column signal, the sparsity assumption 28 can be described by the following sparse approximation problem

In the above formulation,

In this formula, x is described as the sparse decomposition coefficient, and D is the over-complete dictionary matrix whose column is called atom

Through the previous operation, signal model

where the coefficient
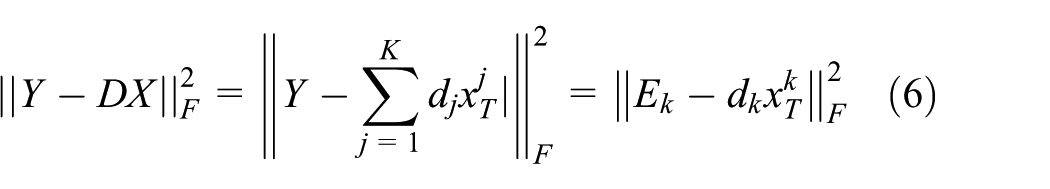
An essential issue in formulation equation (2) is the choice of the dictionary. The early dictionary is predefined by a set of basis functions and cannot change, such as discrete cosine transforms (DCTs), curvelets, wavelets, and so on. K-SVD algorithm
21
is a dictionary-learning method for better adapting the given example data, and sparse representation can be generated based on the learned over-complete dictionary in a sparse coding stage. It is flexible for training of dictionaries and works in conjunction with any pursuit algorithm, for example, OMP algorithm. Given a set of signal samples
Where

The given signal

SVD is employed on
Fault diagnosis based on spectrum image sparse representation
In this section, the framework of spectrum image sparse representation is illustrated in Figure 1. Note that NO, IF, BF, and OF represent normal bearing, inner-race fault, ball fault, and outer-race fault successively, and more details are in the following sections.

The framework of the proposed method.
Image generation with FFT
Vibration signal presented in the form of image is intuition. In this research, FFT spectrums of vibration signals are caught as original images. In order to generalize the proposed method, x-axis of spectrum is set as frequency in Hertz, and the y-axis is set as the amplitude. Therefore, the sampling rate directly affects the x-axis of the spectrum image for a selected signal. Its y-axis is a fixed suitable scale when generating the frequency spectrum. Then, the parameter of the original image is just the resolution. Once the pixel size is selected, the original image is created.
Feature extraction based on sparse representation
These original images contain rich information related to structural information of spectrum, for example, FFT amplitudes and characteristic frequencies. In order to mine underlying information from original image, sparse representation based on an over-complete dictionary is applied to feature extraction from the obtained original image. We can efficiently extract the underlying information from original images by implementing OMP and K-SVD strategically. Details of the proposed feature extraction method are shown as follows:
Classification strategy
For purpose of classifying the bearing faults, features based on frequency spectrum images sparse representation of bearings which are unknown fault categories must be identified. First of all, several training original image samples are addressed through above feature extraction method to obtain the corresponding training features with different faults. Considering that two-dimensional (2D) features, 2DPCA method is used for feature space dimension reduction in our work. The process of 2DPCA and the proposed classification strategy will be attributed as follows:

where

where
Then fault identification based on these extracted sparse features will be carried out via a minimum distance strategy.
Supposing that the p feature matrix extracted from the Q training original image samples is
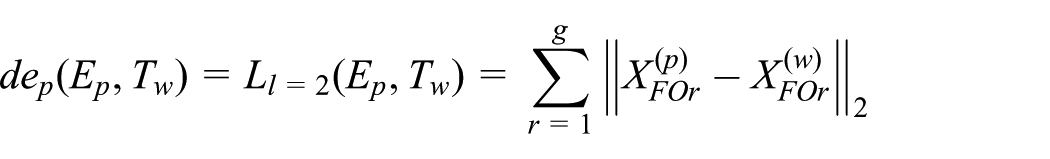

That is, if

Flow chart of bearing fault diagnosis based on the spectrum image sparse representation.
Experimental verification
Experimental setup and database preparation
In order to validate the performance of the proposed fault diagnosis scheme experimentally, rolling bearing public data provided by the bearing data center of Case Western Reserve University are used. 32 The test rig is shown in Figure 3, mainly containing a 2 hp motor, a torque sensor/encoder, a power meter, accelerometers, and electronic control unit. With the help of accelerometers attached to the rack with magnetic bases, the vibration data in this article are sampled at 12 kHz from drive end bearing, which is of single-point faults created by electrical discharge machining with four kinds of fault diameters (0.007, 0.014, and 0.021 in) under different load conditions varied at L0 = 0 hp/1797 r/min, L1 = 1 hp/1772 r/min, L2 = 2 hp/1750 r/min, and L3 = 3 hp/1730 r/min, and each fault degree corresponds to four faults (inner-race fault (IF), outer-race fault (OF), and ball fault (BF)). In this experiment, there are four groups of health condition data of normal bearing (NO), and the other three kinds of faulty ones under each load condition. In order to simulate actual diagnosis, we focus on the scenario that the labeled training samples including NO, IF, OF and BF are collected under one load condition (called training load condition) and unlabeled test samples are obtained under other load condition (called test load condition). Totally 12 different diagnostic tests are performed, and the details of the experimental scenario are presented in Table 1.

Bearing test rig of Case Western Reserve University Data Center.
Description of the scenario setup.

NO: normal bearing; IF: inner-race fault; BF: ball fault; OF: outer-race fault.
The spectrum images are generated based on FFT by selecting 1024 sampling points. The y-axis of the frequency spectrum is fixed with a suitable scale. Then each spectrum image is obtained with image size
With the purpose of further demonstrating the superiority of the proposed method, the baseline approaches and several successful methods are carried out simultaneously.
Baseline 1: Linear support vector mechanism (SVM) classifier with no projection technology is made, that is, we use the original FFT amplitudes without learning a new representation.
Baseline 2: Nearest-neighbor classifier with a new representation is learned by projecting technology.
NN SPI: Nearest-neighbor classifier based on the spectrum image is created. 19
Both a and b are classical methods, which have achieved success in many fault diagnosis applications. Method c is one of the state-of-the-art method in image recognition field.
Diagnosis results of the proposed method
The diagnosis results of the four methods, with fault size being 0.007, 0.014, and 0.021 in, are illustrated in Figures 4–6, respectively.

The results with fault size being 0.007 in.

The results with fault size being 0.014 in.

The results with fault size being 0.021 in.
Each figure consists of four subfigures and has the same fault size in Figures 4–6. In each subfigure, the right of the symbol “->” represents the training load condition, and the left side represents the test load condition. In order to illustrate the diagnostic procedures of the proposed method, “L2->L1” in Figure 4(b) is taken as an example shown in Figure 7. First, all spectrums are blocking, and then sparse decomposition coefficients are obtained via dictionary update and sparse coding stages. From the result in Figure 7, it is clear that sparse decomposition coefficients of different fault categories extracted based on labeled training spectrums are of obviously different three-dimensional (3D) structures. Second, the projected space is established based on sparse decomposition coefficients of training spectrums through 2DPCA. Afterwards, unlabeled test coefficients are projected onto this space. It is evidently shown that features extracted in this space are of satisfactory clustering and classification in Figure 7, and the predicted result in Figure 4(b) and 7 verifies its effectiveness.

Illustration of the proposed method for bearing fault diagnosis.
From the diagnostic results in Figures 4–6, it is obvious that the highest accuracies for fault diagnosis are always obtained when training set is the same with the test set. Meanwhile, when there is much difference between training set and test set, the classification accuracy is generally low for compared methods. The performance of Baseline1 is very poor and it fails to detect fault in this scenario. For example, in Figures 5 and 6, many classification accuracies are about 75%. Especially in Figure 4, a lots of classification accuracies are only around 50%. Baseline2 is superior to Baseline1. However, in Figures 4(b) and 6(d), classification accuracies are about 75%. Nearest-neighbor classifier based on the spectrum image (NN SPI) is slightly better than Baseline2. Unfortunately, in Figure 4(a), the classification performance only reachs 55.95% when using L0 as training samples and L3 as test samples. What is exciting is that the performance of the proposed method is far better than other three methods, and the accuracies of the proposed method are almost 100%. Although the results of the four cases (L0->L1 in Figure 4(b), L0->L2 in Figure 4(c), L0->L3 in Figure 4(d), and L0->L1 in Figure 5(b)) are not 100%, they all exceed 98%. We can conclude that the proposed method can effectively distinguish bearing fault categories in this scenario that working conditions between training set and test set are very different.
Discussion
The spectrum image based on FFT is a very intuitive display of vibration signal, and signals in different health conditions are of different distributions. However, due to interference of redundant information, it is difficult to extract useful fault signature directly from the spectrum image efficiently. The sparse representation provides a different view to mine the useful information from the spectrum image of vibration signal. Taking “L2->L1” in Figure 4(b) as an example shown in Figure 8, features extracted from different methods are visualized via t-distributed stochastic neighbor embedding (t-SNE). 33 The right of the symbol “-” represents the training or test, and the left side represents the health condition. From Figure 8, it is very obvious that features extracted from the proposed method can reflect the health condition of bearings more accurately and be of preferable clustering than other compared methods. In addition, vast compared experiments are carried out to verify the effectiveness of the proposed method.

Feature visualization via t-SNE 33 based on different methods.
For further illustration about the superiority of the proposed method in the field of bearing fault diagnosis, a comparative research between the current work and published literature is listed in Table 2.
Comparisons between the current work and some published work.
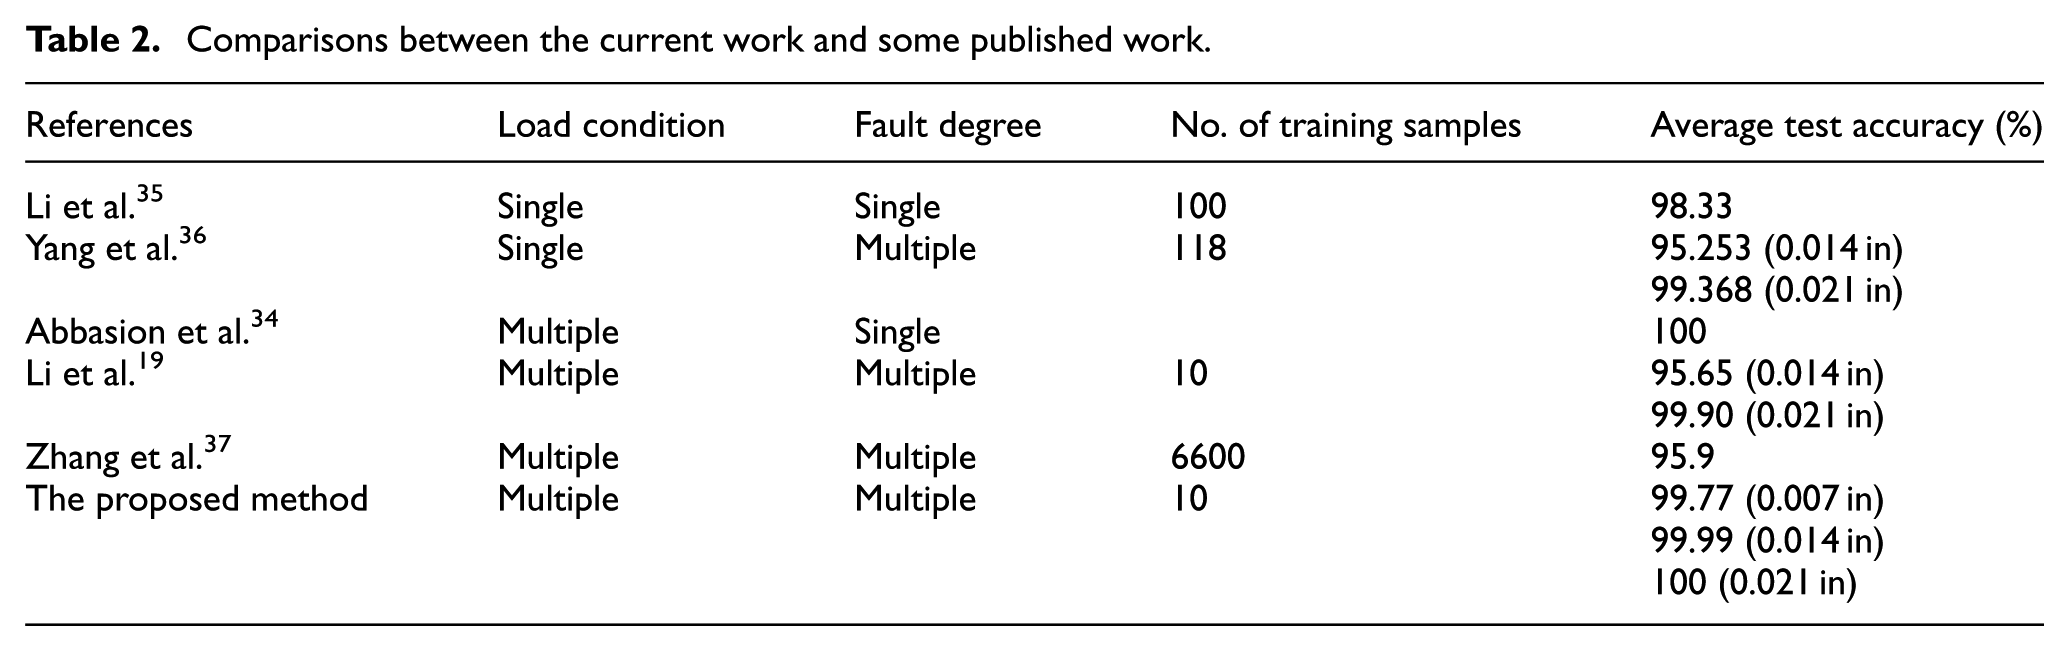
In order to make a fair comparison, all these work use the same bearing data 32 as used in this article. The majority of previous work focuses on only fault diagnosis under a single-load condition and fault degree. Under load 3-hp condtion, Li and Zhang 35 used a fault diagnosis method based on the supervised locally linear embedding projection (SLLEP) to identify faults with fault size being 0.021 in. The extracted features by this method are deeply influenced by the regularization parameter, and the number of training samples is considerably higher than that of the proposed method. In Abbasion et al., 34 features extracted based on wavelet denoising and SVM method were used to diagnose faults under 2-hp condition with fault size being 0.007 in. In a study by Yang et al., 36 SVMs and fractal dimension based on the fractal dimension feature (FDF) were applied for bearing fault diagnosis under single-load condition with fault size being 0.014 in and 0.021 in. Taking different load conditions into account, Li et al. 19 directly used the spectrum image of vibration signal as a feature to diagnose the bearings fault types: however, unfortunately several cases are still around 75%. In a study by Zhang et al., 37 a method based on deep convolutional neural networks with wide first-layer kernel (WDCNN) was proposed to diagnose three data sets. Three data sets include 10 kinds of health conditions (NO and IF, BF, OF with fault size being 0.007, 0.014, and 0.021 in) under three load conditions (Load1, Load2, and Load3), respectively, which is similar to L0, L1, L2, and L3 all in this article. The average accuracy of WDCNN is 95.9%, whereas average accuracy of the proposed method is 99.92%. It is worth mentioning that the performances of the proposed method are superior to the other methods listed in Table 2.
Conclusion
In this article, a novel fault diagnosis approach for bearings based on the spectrum image sparse representation technique has been proposed. The sensitive features were extracted from a small amount of spectrum image samples, and then such sensitive features were used to diagnose faults. Specifically the original spectrum image is obtained through FFT. Then, the sparse decomposition coefficient feature is extracted via a combination of OMP and K-SVD algorithm from the original spectrum. Finally, with the help of similarity measurement based on minimizing Euclid distance, the fault identification is realized based on the Eigen of the sparse decomposition coefficient matrix obtained by 2DPCA method. The proposed method provides a novel perspective for mining the useful information from a small amount of spectrum image matrix samples to reduce interference of redundant information, and then, it solves the accuracy-dropping problem of multiple local defective bearings diagnosis. Different experiment tests under different loads and motor speeds demonstrated the effectiveness and feasibility of the proposed method.
Footnotes
Handling Editor: Zengtao Chen
Declaration of conflicting interests
The author(s) declared no potential conflicts of interest with respect to the research, authorship, and/or publication of this article.
Funding
The author(s) disclosed receipt of the following financial support for the research, authorship, and/or publication of this article: This work is supported by National Key R&D Program of China (2016YFC0802900), National Natural Science Foundation of China (No. 51475455), Natural Science Foundation of Jiangsu Province (No. BK20160251), and the Priority Academic Program Development of Jiangsu Higher Education Institutions (PAPD).