
Abstract
The ball screw is an important component of machine tools, and its degradation assessment is therefore critical for the health management of the entire machine tool. Generally, the degradation assessment includes health indicator construction and degradation modeling. However, the health indicator is often constructed manually with prior knowledge, and its sensitivity can be affected by various factors. In addition, most existing degradation models rely on a large amount of failure data, which is not practical for the ball screw due to its high reliability. To solve these problems, this article presents a novel ball screw performance evaluation method. First, the raw data collected in the normal status are used to train the variational autoencoder, and then, the online raw signals are input into the learned variational autoencoder to construct health indicators. After that, the kernel density estimation is utilized to estimate the probability distribution of health indicator points in a dynamic sliding window, and then, the deterioration can be evaluated by summarizing the probability distribution that exceeds a predefined threshold. Experimental results show that the presented methodology can establish the health indicator automatically and adaptively. Also, it can evaluate the ball screw performance effectively and quantitatively when only data in healthy state are available.
Keywords
Introduction
The ball screw is designed to transform rotary motion into linear motion with high accuracy and efficiency; therefore, it is widely used for precision positioning in machine tools. 1 Due to the tough working environment and complex operational conditions, damages often develop gradually on the ball screw, leading to various kinds of defects or failures. As a key part of the machine tool, if the ball screw deteriorates severely or even fails, the quality of the processed work pieces cannot be guaranteed. Also, the breakdown of the whole machine tool may ensue, which can bring hazards to the manufacturing process. Consequently, it is of great significance to detect faults in their early stage and evaluate the degradation accurately during the entire working life of the ball screw. Based on the deterioration evaluation results, effective maintenance can be conducted in time, which can not only improve the reliability and safety of the machine tool but also reduce maintenance costs.
Condition-based maintenance (CBM) refers to the maintenance policy that plans maintenance according to condition monitoring (CM) data such as vibration signals, temperatures, and currents. 2 Much research has been done on the CBM regarding mechanical components, such as bearings and gears.3–6 Vibration signals are the most widely selected data, as they are easy to be acquired and can well indicate the degradation process. Hence, vibration data are collected and applied to describe the health status of the ball screw in this research. By comparing the condition of a ball screw at a CM point with its normal state, the deviation of its status can be determined, and the severity of degradation can be identified. 7
Generally, two steps are necessary for degradation analysis: health indicator (HI) construction and deterioration evaluation. First, an HI should be constructed from the sensor data to represent the condition of a specific component. The HIs can be features extracted from CM data using signal-processing techniques, including time domain techniques,8–10 frequency domain techniques, 11 and time–frequency domain techniques.12–14 However, these HIs depend largely on prior knowledge about signal-processing methods. 15 In addition, the accuracy of degradation assessment models is dependent on the sensitivity of the HI. But the sensitivity of features can be affected by various factors such as operational condition and location of sensors. Hence, it is difficult to determine which feature is more sensitive to the deterioration of the system. Moreover, a lot of strategies, such as the Mahalanobis distance,16,17 self-organizing map (SOM),18,19 and Gaussian mixture models (GMM) 20 were applied to fuse multiple features into an HI. These approaches can take advantage of the information from multiple domains, but the number of features to be combined is often determined subjectively. Therefore, it is indispensable to explore an adaptive HI construction method that can extract the most useful characteristics directly from vibration signals.
The autoencoder is an algorithm for data compression, which can map the input into a lower dimension through an encoder network and reconstruct the input according to the compressed space with a decoder network. The objective of the autoencoder training process is to minimize the reconstruction error. It has been used for fault detection and dimension reduction in the CBM for machinery. Thirukovalluru et al. 21 developed an autoencoder-based method to generate feature set for diagnosis, while in this study, the input were features extracted by signal-processing techniques. Timusk et al. 22 used the autoencoder to detect defects by comparing the information buried in the real-time data with that hidden in the signals collected in the normal condition. However, the autoencoder was trained via traditional features, and they did not study degradation severity differentiation with the autoencoder. Jia et al. 15 proved that the autoencoder could mine information about faults in machinery from the CM data without extracting features manually. And Mao et al. 23 extended this work with autoencoder extreme learning machine to improve computational efficiency. However, these two investigations both focused on fault diagnosis, and the raw signals had to be transformed into the frequency domain before they were input into the autoencoder. As a result, in this study, we explore constructing an HI from raw data with the autoencoder and employing the HI to represent the health state of the ball screw for degradation estimation. Specifically, the raw data collected in the normal condition are first employed to train a specific autoencoder, variational autoencoder (VAE). Then, the online raw signals are input into the learned VAE, and the reconstructed data can be obtained. The learned VAE can reproduce signals similar to the training data with small reconstruction errors. When processing data which differ a lot from the training data, the reproduction error will be large. Therefore, we use the reconstruction error as the HI to reflect the deviation degree from the normal condition like the results obtained by support vector data description 24 and GMM 20 do. But it is not necessary to extract features manually when constructing the proposed HI.
Another challenge in deterioration analysis is how to evaluate the degradation quantitatively. Most of the existing research concentrates on estimating the degradation by building empirical models to describe the degradation path. Gebraeel et al. 25 presented an exponential model to illustrate the bearing deterioration and estimated remaining useful life (RUL) distributions through Bayesian inference. Peng and Tseng 26 proposed a general linear degradation model to evaluate the mean time to failure of products. Zhao et al. 27 utilized the Paris law to describe the development of gear crack and predicted the failure time distribution at different CM points. Si 28 developed an adaptive nonlinear model to forecast the RUL with CM data. The above methods require empirical knowledge about the specific system, which prevents their application to complex systems and new equipment. In addition, in these approaches, the deterioration is identified by updating the parameters of degradation models, which needs a large amount of failure history data to initialize the parameters. However, the ball screw is a highly reliable product, which means that it is time-consuming to obtain adequate failure history data. Hua et al. 29 put forward a reliability evaluation method based on kernel density estimation (KDE) for equipment under the assumption that only the data collected from the normal functioning mode are available. But they focused on the online reliability assessment and did not study the identification of the early defect. Hence, in this study, we develop a degradation estimation model with the KDE to identify the deterioration at the early stage and estimate the degradation throughout the entire lifetime of the ball screw when no empirical information and failure history data are available. Specifically, a sliding window is employed to capture the HI points of the ball screw sequentially, and then, the deterioration is identified through the probability density function (PDF) of these points estimated by the KDE. With this model, the degradation of the ball screw can be estimated effectively and quantitatively.
The rest of this article is organized as follows. Section “Background theory” provides a brief introduction to the background theory, including the VAE and the KDE. The proposed method is described in section “Proposed degradation assessment method for the ball screw.” Section “Applications and discussions” verifies the presented approach using real test data and discusses the results. Finally, the conclusions are summarized in section “Conclusion.”
Background theory
VAE
An autoencoder is a network with three layers that attempts to reproduce input data at the output layer, as shown in Figure 1. The target of the training process is to minimize reconstruction error, and then, the hidden layer can capture the essential characteristics of the training data. Hence, the autoencoder is an unsupervised learning algorithm, and it can be used for dimension reduction.

The structure of an autoencoder.
The VAE is a special autoencoder, which tries to represent the input at a high level with a PDF instead of several hidden nodes,
30
as depicted in Figure 2. In the picture,
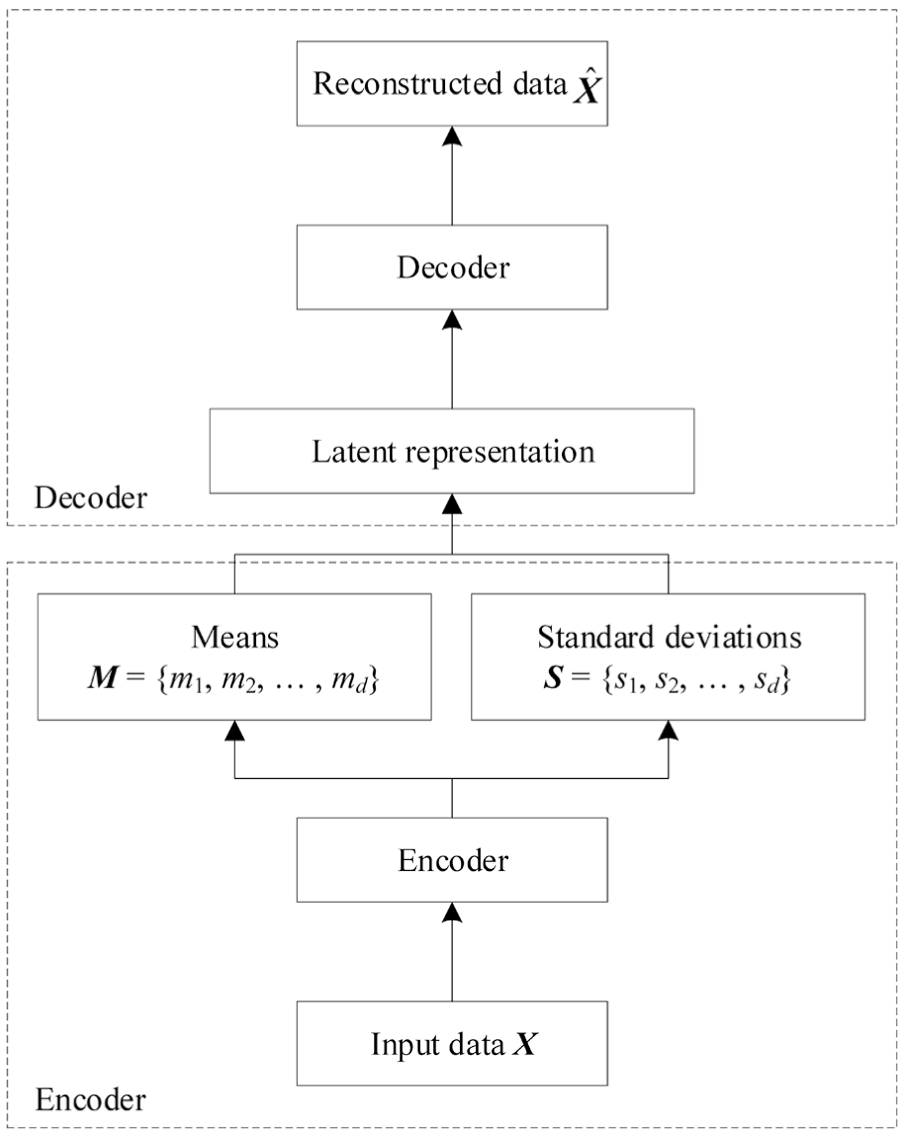
The framework of the VAE.
Let
In order to solve the above problems, a recognition model q
The marginal likelihood of the data set

where the first term is the Kullback–Leibler (KL) divergence of the recognition model
With an easy transformation, equation (1) becomes
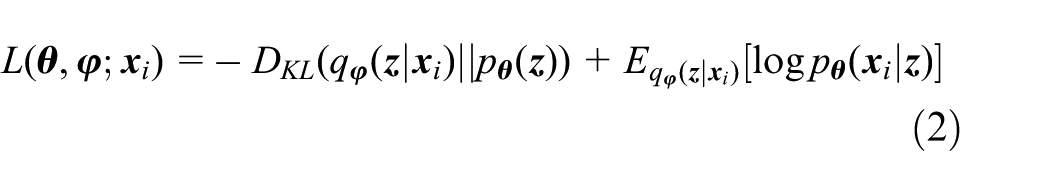
Equation (2) is the objective function during the optimization process of the VAE. In general, it is formidable to solve

where
Then, the network can be introduced to implement the optimization process. Since the KL divergence is added as a loss function among the training process, the VAE can learn well-formed latent spaces with a faster convergence speed than the classical autoencoders without overfitting. Consequently, it is utilized for HI construction in this work.
KDE
The KDE is a nonparametric Parzen window density estimation approach, 31 which can be defined as follows.
Let {x1, x2, …, xn} be i.i.d. random variables, and then, the PDF at point x can be approximated by

where h denotes the neighborhood scope of x, namely, Parzen window, and xj represents the given sample. K(
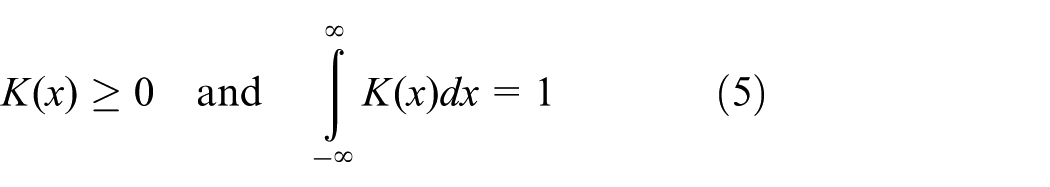
The estimated value of the PDF at point x is determined by the number of samples located in the Parzen window with the center x, as illustrated in Figure 3. More data points will produce larger density

Kernel density estimation.
Proposed degradation assessment method for the ball screw
In this article, we present a deterioration evaluation method for the ball screw by incorporating the VAE and the KDE, as shown in Figure 4. It consists of two parts—HI construction and degradation estimation. In the first part, raw vibration signals collected in the normal functioning mode are used to train the VAE, and then, the online raw data are input into the learned model to construct the HIs. In the latter part, a degradation model is built with the KDE, and the HI series are input into the model to estimate the deterioration of the ball screw. More details about these two parts are described as follows.

The framework of the proposed method.
Health indicator construction using the VAE
In this section, we attempt to construct the HI without extracting features manually from the vibration data, which includes two modules: offline training and online monitoring, as illustrated in Figure 5. The raw vibration signals acquired in the normal functioning mode are used to train the VAE in the former part, and then, the learned VAE can reproduce signals similar to the training data with small reconstruction error. When processing data which differ a lot from the training data, the reproduction error will be large. During the failure process, the measurement deviates increasingly from the healthy data with the development of the degradation. If the data acquired at different states are input into the trained VAE, the reconstruction error will have a positive relationship with the corresponding severity of deterioration, which can reflect the performance of the ball screw. Hence, we use this strategy to construct the HI during the monitoring process. At each CM point, the online raw signals are input into the learned VAE, and the VAE will reconstruct it. By comparing the input and the output, the reconstruction error can be obtained, called variational autoencoder reconstruction error (VAERE), which is defined by the mean squared error (MSE), as described by

where T denotes the number of the sampled points in a vibration sequence.
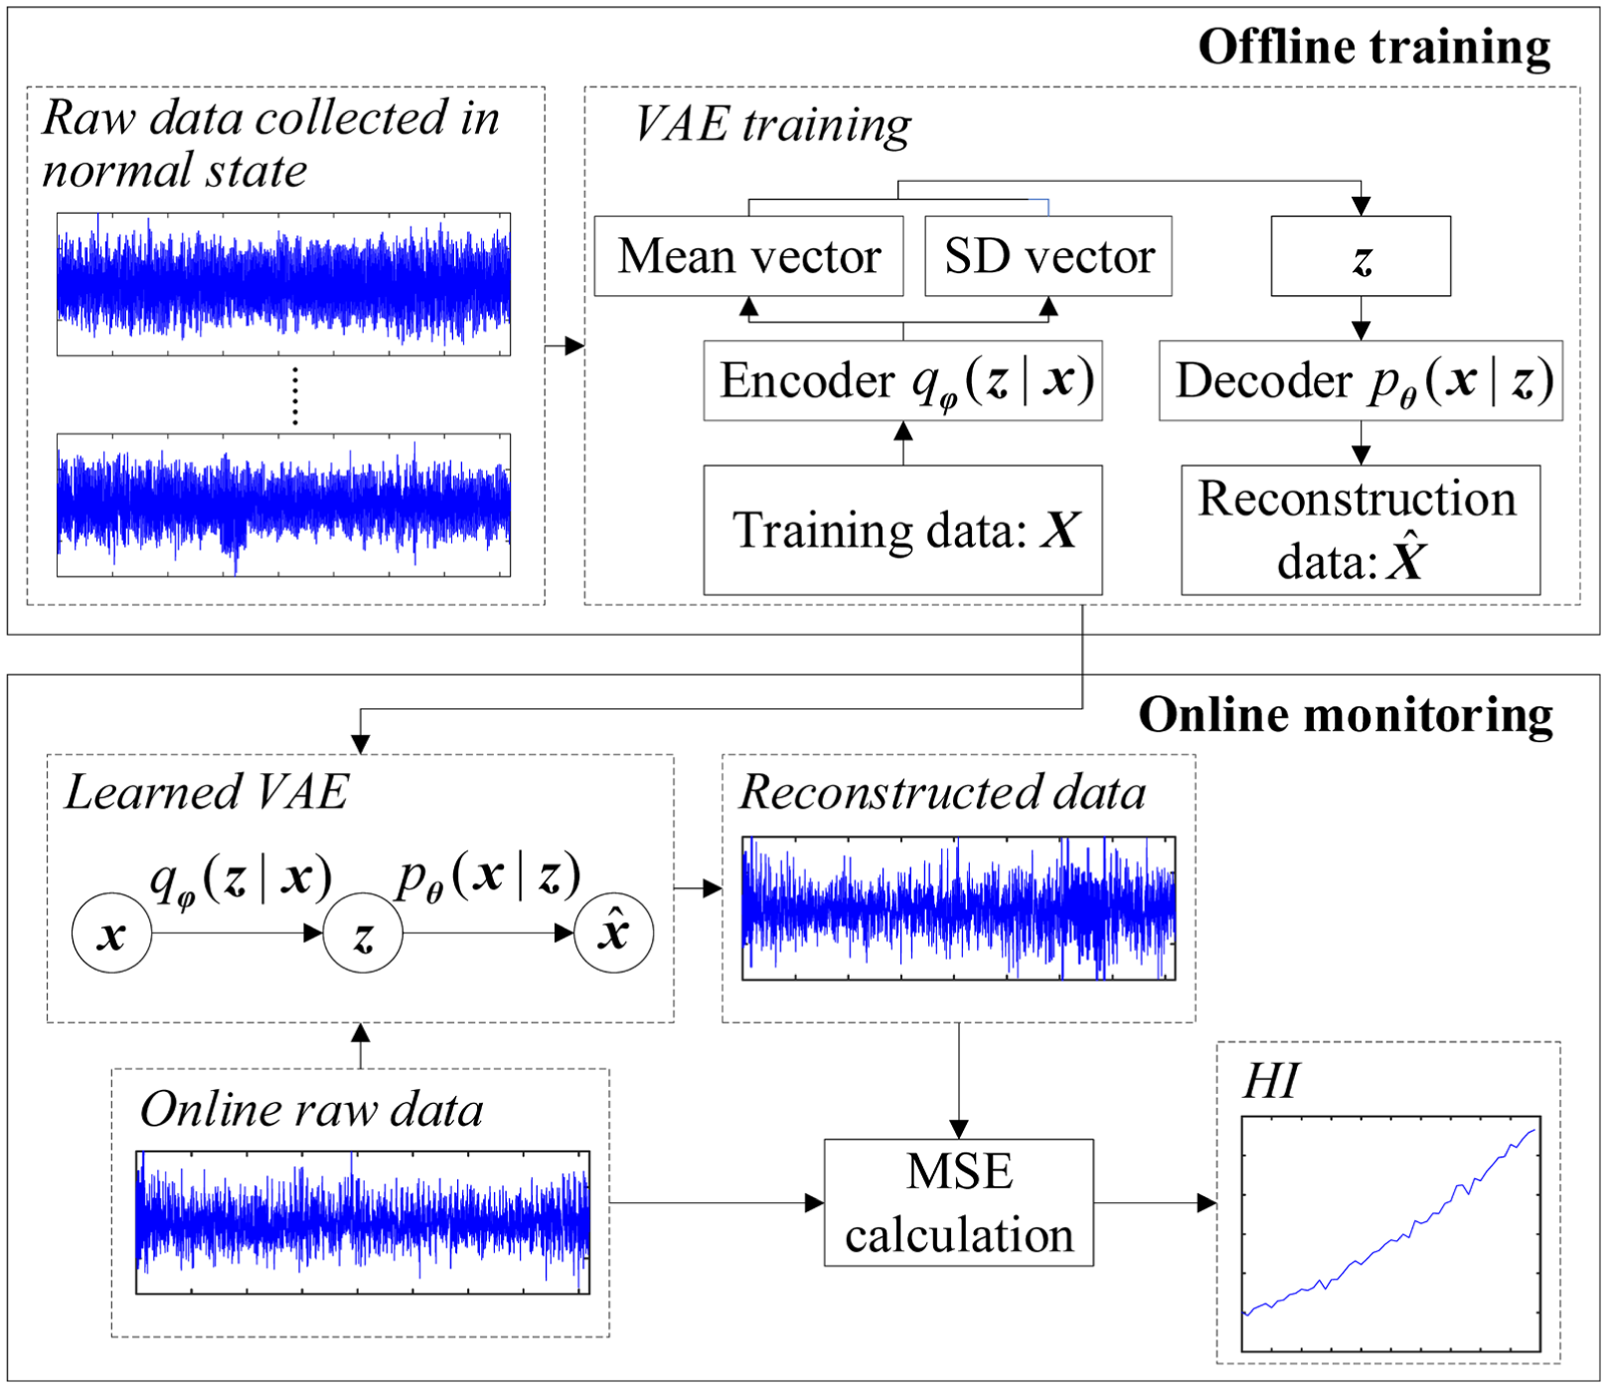
HI construction method based on the VAE.
Accordingly, the VAERE is employed as the HI to represent the health status of the ball screw at any CM point. The VAE serves as a preprocessor of the KDE-based degradation assessment model.
KDE-based degradation assessment model for the ball screw
During the entire operational life of the ball screw, it degrades gradually and endures various degradation stages. If the defects can be detected at a relatively early stage, maintenance can be conducted in time. Consequently, it can stop the ball screw from further deterioration and improve the processing quality of the machine tool. It is also important to assess the degradation over the whole lifetime of the ball screw, which can guide the predictive maintenance and replacement. In literature, 29 the authors proposed a reliability estimation method with the KDE, namely, a dynamic kernel estimation model, as shown in Figure 6. They assume that the degradation process is a nonstationary stochastic process, and a sliding window is used to capture the HIs at different CM points. Then, the probability distribution of the points in the window is utilized to reflect the severity of degradation. In the dynamic kernel estimation model, the input layer is made up of the points in a specific window. The sampling layer contains sampling points within the same interval generated from the input layer, and these samples are arrayed in an ascending sort order. The output is the conditional PDF of the points in the current window.

Dynamic kernel estimation model.
Suppose the length of the window is k, which means that the number of points sliding into a window is k. When estimating the PDF of samples in window H, the samples

where
The degradation of the ball screw is a random process, and then, the data sequence made up of the HIs at different inspection intervals is a random series. Hence, we employ the dynamic kernel estimation model to perform online degradation assessment for the ball screw. By summarizing the probabilities of the abnormal HIs, the deterioration can be estimated. To identify the abnormal HIs, a threshold should be defined. In this research, we attempt to detect the degradation as early as possible and assess the severity of deterioration, so we use the threshold for degradation detection to define the abnormal HIs. In order to obtain the threshold V, the PDF of the normal HIs is calculated with the KDE. Let the confidence level be 99.9%, which means the false alarm rate during normal operational condition is 0.1%, 20 and then, the threshold V can be obtained by

where P(
During online CM, at any assessment interval tH, the PDF of the HIs in the sliding window H is estimated. Then, the degradation at the CM point can be evaluated by figuring out the distribution of the samples that exceed the threshold V
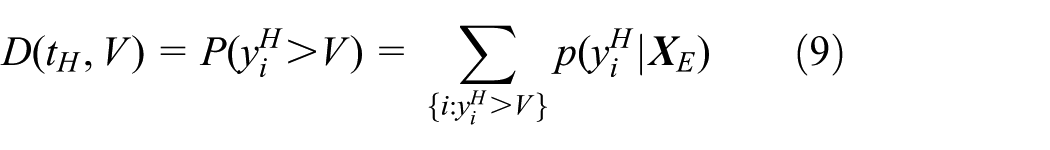
where
Let the sliding distance be s, which means that when implementing degradation assessment at time tH + 1, the number of samples in window H that will remain in time window H + 1 is k − s, and the number of the newly added points is s. Set H = H + 1, and the extent of deterioration can be obtained by combining the dynamic kernel estimation model and equation (9). Hence, we can track the degradation at different time instants with a sliding window, as depicted in Figure 7. In Figure 7, the x axis implies different CM points and the y axis represents the HI.

The tracking process of degradation.
Applications and discussions
In this section, real-test data were employed to demonstrate the proposed method and verify its effectiveness. The run-to-failure test was conducted for the ball screw, and vibration data were collected during its whole operational life for methodology verification.
Experimental system and vibration data
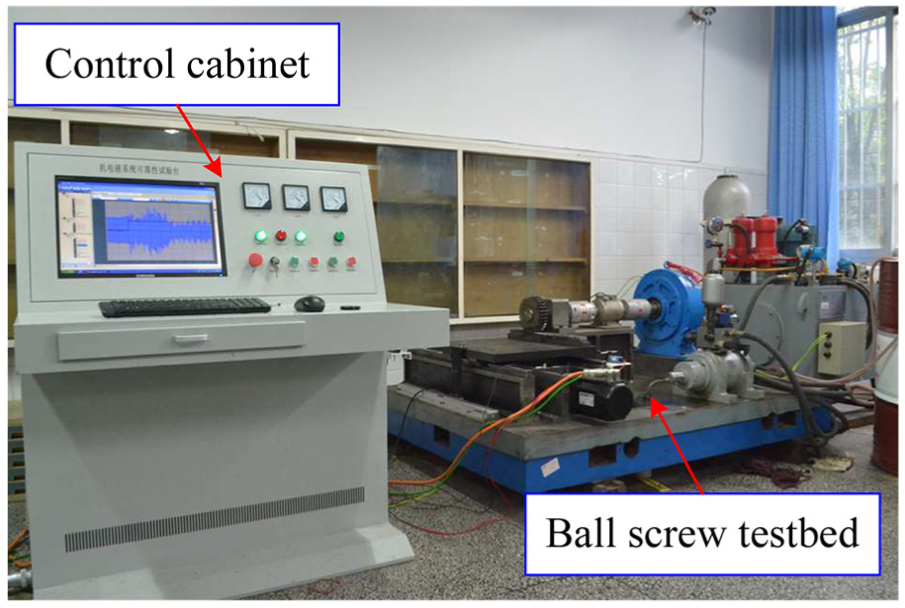
Due to the high reliability of the ball screw, it often takes a long time for the ball screw to fail in real application. To solve this problem, we designed and manufactured an experimental system to conduct accelerated tests on the ball screw, as shown in Figure 8. It consists of two parts—the testbed for ball screw accelerated tests and the control cabinet. By exerting high dynamic load on the ball screw, the time for the ball screw to fail is reduced. This experimental system can carry out tests for the diagnosis and prognosis of the ball screw.
Experimental system for ball screw accelerated life tests.
The testbed for accelerated tests is shown in Figure 9, which contains two modules—moving structure and exerting structure. The first module simulates the movement of the ball screw in real applications, and the second module exerts load on the ball screw. In the exerting structure, a magnetic powder brake is applied to produce the torque, and then, the torque is exerted on the carriage through gear and rack, by which the load is exerted on the ball screw axially. To acquire the CM data of the ball screw, an accelerometer is attached to the ball nut, as shown in Figure 10. During the test, vibration signals are collected through the accelerometer to reflect the health condition of the ball screw. The control cabinet includes the controlling system and acquisition system. The former is to control the rotation of the motor and the output of the magnetic powder brake, and the latter is to capture the output of the sensors.

The testbed for ball screw accelerated tests.

Installation position of the accelerometer.
The tested ball screw is the FFZD4005-3 brought from NANJING GONGYI, and its main parameters are illustrated in Table 1. The rated dynamic load of a ball screw is the constant load which makes the ball screw fail after 106 revolutions, and the rated dynamic load of FFZD4005-3 is 13 kN. In real application, the ball screw usually serves for 8–10 years, and therefore, its actual dynamic load is often much smaller than the rated dynamic road. Currently, the mechanism of ball screw degradation has not been studied thoroughly and revealed clearly. Hence, in this test, the axial load of the ball screw was required to be smaller than 50% of its rated dynamic load to ensure the ball screw deteriorates as it do in practice. Specifically, the torque outputted by the magnetic powder brake was set to be 300 N m, and the arm of force is 0.064 m. According to equation (10), the axial load was 4687.5 N, 36.06% of the rated dynamic load. In addition, the practical feed speed is often in the range of 1–5 m/min, and the pitch of FFZD4005-3 is 5 mm. Therefore, a rotating speed ranging from 200 to 1000 r/min is reasonable, and it was set to be 1000 r/min in the test. In this article, we focus on the degradation of the ball screw under constant working condition, so the load and the rotating speed remained the same from the beginning to the end of the test. The sampling frequency was 5000 Hz, and the CM data were collected from normal working status to failure. Vibration signals were acquired within the same time interval, 30 min, and the number of the total CM points was 215

where Tq is the torque, Fm is the axial load, and lq is the arm of force.
Main dimensions of the ball screw.

Degradation severity classification
Degradation severity recognition refers to the identification of health states of the ball screw, such as healthy, slight deterioration, and severe deterioration. The health conditions can be distinguished according to the selected HI, so an appropriate HI is important for accurate severity identification.
In this case, vibration data collected at healthy, slight degradation, and severe degradation stage were utilized to verify the VAE-based HI construction approach. In all, 600 samples of normal vibration signals were employed to train the VAE, whereas the testing data set included 200 samples in the normal state, 200 samples at the slight degradation stage, and 100 samples at the severe degradation status. During the experiment, we found that the VAE with three latent points was enough to reconstruct the training data, so we defined the hidden layers d = 3. Figure 11 illustrates the VAE-based HIs of the three health stages, and it can be obviously observed from the picture that the different classes are distinguished effectively. To be specific, the severe degradation samples can be differentiated from the other two categories, and most of the HIs at the slight deterioration state can be separated clearly from the normal HIs. In addition, the VAERE has a positive relationship with the deterioration level, and it increases with the development of the degradation.

VAERE corresponding to vibration signals at different stages.
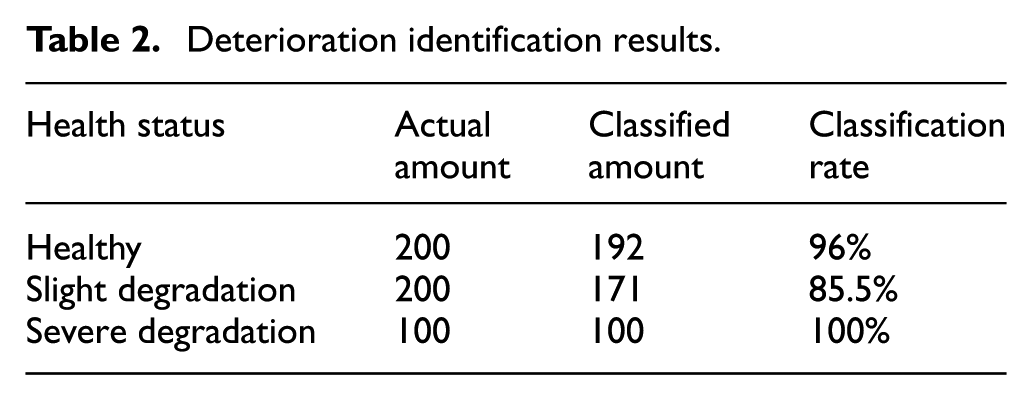
To verify the presented feature’s effectiveness in discriminating different states quantitatively, we calculated the mean and SD of VAEREs in the former two conditions and used them to identify the health status. Specifically, the two means are represented as μ1 and μ2, and the SDs are denoted as σ1 and σ2. Then, we define two thresholds: τ1 = μ1 + 2σ1 and τ2 = μ2 + 2σ2. With them, the state of the ball screw can be estimated. When the VAERE δ ≤ τ1, then the ball screw is considered in the healthy state; when δ > τ1 and δ ≤ τ2, then the ball screw is determined in the slight degradation condition; when δ > τ2, then we regard the ball screw in the severe deterioration status. Using the abovementioned mechanism, the degradation severity classification results are shown in Table 2. It can be seen that different states can be discriminated effectively with the VAERE, especially for the healthy state and the severe degradation, with the classification rates of 96% and 100%, respectively. Since the incipient fault is easy to be mixed up with the normal state, the recognition rate of the slight degradation is lower, 85.5%. Therefore, the VAERE can effectively distinguish different states of the ball screw.
Deterioration identification results.
To further demonstrate the effectiveness of the VAE-based HI construction approach, the related similarity (RS) 32 and the minimum quantization error (MQE) based on the SOM with manually extracted features 18 were used for comparison. The RSs of raw vibration signals at different stages are shown in Figure 12, and Figure 13 depicts the results of the MQE. Specifically, the RS was obtained by calculating the similarity between the current raw measurement and the raw data acquired at the normal stage, and the MQE was generated by using the SOM to fuse 10 statistical features and 2 time–frequency domain features. Compared with the RS and the MQE, the VAERE is capable of differentiating the three health states better. This result verifies that the VAE can mine the intrinsic characteristics of vibration data adaptively and it can be used to construct HIs for degradation assessment.

RS corresponding to vibration signals at three stages.

MQE corresponding to vibration signals at three stages.
HI series
To estimate the degradation online, the values of the HI should be obtained first according to the online data, as illustrated in Figure 5. In this case, the raw vibration signals collected at the former 75 CM points are data obtained in the healthy state, and they were used to train the VAE. During online CM, raw vibration data acquired at the measurement time instants were input into the learned VAE to obtain the HI series, as illustrated in Figure 14. It is seen that the VAERE grows as the working time of the ball screw increases, which reflects the development trend of degradation. In addition, the typical feature, Kurtosis, was also calculated, as illustrated in Figure 15. Compared with the Kurtosis, the VAERE is more stable and shows clearer variance trends during the entire deterioration stage. Hence, it is more suitable for degradation assessment. Although the VAERE can effectively imply the health state of the ball screw, the beginning point of the deterioration cannot be identified. Also, the degradation cannot be evaluated quantitatively. Therefore, the KDE algorithm was employed to overcome these deficiencies.
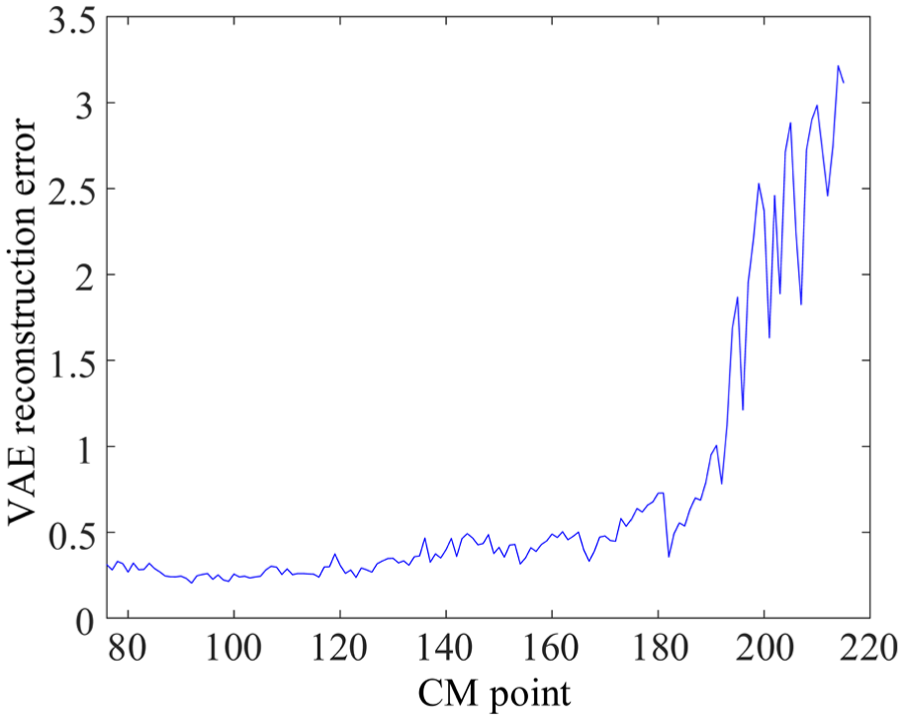
VAERE at different CM points.

Kurtosis at different CM points.
Degradation assessment for the ball screw
As discussed in section “Proposed degradation assessment method for the ball screw”, the HIs were input into the dynamic kernel estimation model to implement degradation estimation. Set the length of the sliding window k = 25 and the sliding distance s = 1. To obtain the degradation threshold V, the KDE was used to calculate the probability distribution of the healthy HIs obtained at the former 75 CM points, and the results are illustrated in Figure 16. The degradation threshold V was calculated through equation (8) with the false alarm rate 0.1%, and the result is 0.3978. Then, the threshold was utilized to estimate the deterioration.

PDF of VAERE at the normal condition.
During the online CM, the HI series was input into the dynamic kernel estimation model successively to track the degradation at different CM points, as depicted in Figure 7. Figure 17 shows the probability distribution of different sliding windows. From Figure 17, we can see that the distributions are narrow at the beginning and they remain relatively stable. The reason for this is that the ball screw works normally at the start, and the vibration data collected during this period are similar to the training data of the VAE. Hence, the measurements can be reproduced with small errors, most of which are less than the threshold V. With the development of deterioration, the HIs at the degradation stage slide into the window, and the probability distribution becomes increasingly wider. Also, as the working time increases, the probability distribution below the threshold V becomes smaller and smaller.

Probability distribution of different windows.
Figure 18 illustrates the degradation assessment result obtained by integrating the PDFs in Figure 17 and equation (9), which are confined in the range [0, 1], and it can reflect the degradation intuitively and quantitatively. Besides, we can see from the picture that the deterioration speed varies during the whole degradation process. Specifically, it degrades slowly at first, and then, the degradation rate grows rapidly. At the end of the deterioration process, the degradation speed becomes slow again until the system fails.

Degradation assessment result for the ball screw.
Since the false alarm rate is 0.1%, we define that the ball screw begins to degrade when the degree of deterioration exceeds 0.1%. The local enlargement of the degradation assessment result is shown in Figure 19, and the dashed line denotes the threshold V. It can be observed from Figure 19 that the ball screw starts to deteriorate at CM point t = 119, and there is a relatively long time for physical damage to accumulate. Therefore, it is necessary to detect early deterioration so that appropriate maintenance can be conducted in this period to recuperate the health of the ball screw, which can prevent the defect from further development and prolong its service life.

Local enlargement of the degradation assessment result.
To further illustrate the effectiveness of the proposed method, a existing state assessment method proposed by ZL Liu et al. 33 was employed to identify the ball screw condition for comparison. First, the different degradation stages were divided with the Fuzzy c-means algorithm. The results show that the ball screw begins to degrade at t1 = 120, which is very close to our method, and the severe degradation status starts at t2 = 173. Then, the supervised learning was utilized to discriminate the three states, and the recognition results are shown in Table 3. It is observed that the healthy state and severe degradation condition are easy to be identified, whereas the slight degradation is more difficult to be differentiated, which can be explained as follows. At the beginning of the degradation, the difference between the collected signals and the signals in the healthy state are not obvious, so it is easy to classify these points as normal conditions. Similarly, the samples in the end of slight deterioration are arduous to be separated from the ones in the severe degradation state.
Recognition rates of Liu’s method.

For an intuitional comparison, the classification accuracy of our method was derived according to Figure 18, as shown in Table 4. The time thresholds for slight degradation and severe degradation were 119 and 173, which were determined by our method and Liu’s approach, respectively. Besides, the two thresholds of degradation level were 0.3978 and 0.7, respectively. Comparing Tables 3 and 4, we can see that our method has a more stable performance in condition discrimination. The superior properties of the presented method are due to the following two reasons. First, the health indicator in our approach was constructed with the VAE instead of extracting features manually, which can mine the intrinsic characteristics of the signal. Second, we used the PDF of both historical and current observations to identify the health status, which avoids the randomness brought by condition recognition only with the current information and is especially useful for ball screw state differentiation.
Classification accuracy of our method.

Accordingly, both our method and Liu’s method can find the start point of degradation, but Liu’s approach can also determine the time threshold for severe degradation. However, our method can recognize the state more accurate and identify the deterioration quantitatively. Also, Liu’s method needs the condition monitoring data during the whole life to construct the health assessment model, while our methodology only uses the available measurements till the current time. Therefore, our method is more suitable for identifying the ball screw performance.
Conclusion
In this article, we present a new HI construction approach with the VAE and a novel KDE-based deterioration assessment algorithm to track the degradation of the ball screw under the assumption that only healthy data are available.
A run-to-failure test for the ball screw was carried out to collect vibration signals during its overall life cycle, and the data were utilized to manifest the validity of the presented method in this work. The results show that the HI constructed through the VAE is capable of representing the health status of the ball screw. In addition, by combining the HIs and the degradation evaluation model based on the KDE, slight deterioration can be detected in time, and the degradation severity can be estimated quantitatively during the whole degradation process.
Since the proposed methodology needs no prior knowledge or failure history data, it will be more applicable in practice. Moreover, the proposed approach can be extended to estimate the degradation of other mechanical components such as bearings, gears, and cutting tools.
Footnotes
Handling Editor: Xihui Liang
Declaration of conflicting interests
The author(s) declared no potential conflicts of interest with respect to the research, authorship, and/or publication of this article.
Funding
The author(s) disclosed receipt of the following financial support for the research, authorship, and/or publication of this article: This research was financially supported by the National Natural Science Foundation of China (Grant No. 51775452).