
Abstract
The traditional adaptive cruise control system generally requires 25–40 km/h velocity to function. Moreover, the adaptive cruise control system cannot decelerate to the stop state, cannot adjust for stationary objects, and has limited scope of application. This study achieved the traffic jam tracking function of vehicles through the simultaneous use of millimeter wave and laser sensors and the analysis of the driving behavior of skilled drivers. The spacing and acceleration control of a vehicle is optimized based on the premise of ensuring safety and comfort by providing smooth, comfortable, safe, and radical control modes for driver selection, thereby increasing the probability that adaptive cruise control adopted by drivers. In addition, the collision avoidance function is added for safety reasons. Finally, actual vehicle experiments show that the distance and acceleration errors are in the expected range of errors of drivers. Moreover, the validity and practicability of the proposed adaptive cruise control algorithm are verified.
Keywords
Introduction
The development of vehicle technology and transportation has resulted in vehicles becoming an indispensable part of the lives of people. The improvement of the quality of life and pursuit of achievements have made the safety of vehicles and intelligent driving the main trends of vehicle development. In recent years, the rapid increase in vehicle production and ownership has triggered numerous traffic accidents, traffic congestion, environmental pollution, and a host of other issues. The World Health Organization reported that the number of road traffic deaths reached 1.25 million globally in 2015 and road traffic injuries have been the first cause of death among young people aged 15–29 years old, and traffic accidents cost up to 3% of gross domestic product (GDP). 1
Statistics indicates that man-made traffic accidents account for over 90% of all traffic accidents, over 70% of which are caused by human negligence. Distraction, misjudgment of traffic conditions, and lack of situational awareness are the main reasons for induced human errors. 2 From the discovery of the situation to the reaction, the control cycle of adaptive cruise control (ACC) or stop and go (SG) is substantially limited. That is, a driver often takes approximately 1 s to avoid the occurrence of a vast majority of traffic accidents effectively. During traffic congestion, a driver needs to complete numerous shifts, that is, he needs to step on the throttle and brake pedals (a driver also needs to step on the clutch pedal when using vehicles with manual transmission), thereby causing fatigue. Accordingly, SG can free the driver from this repetitive and boring operation. At low speeds, the engine will produce substantial harmful gas emissions due to incomplete combustion. ACC can maintain the gradual acceleration and deceleration of a vehicle, while SG can provide an optimized energy saving control technology. 3 In addition, vehicles equipped with ACC and SG can maintain the appropriate spacing, thereby effectively improving road traffic.4,5
In the past few decades, many institutions and researchers, such as the European Prometheus program, 6 US Path program, 7 and ASV program of Japan, 8 have exerted considerable effort to develop ACC. Subsequently, ACC gradually penetrated into the low-end market. ACC is divided into two types based on the control structure, namely, hierarchical control9,10 and direct control.11,12 Hierarchical control means that the upper decision-making layer calculates the desired acceleration based on the real-time environmental information of a vehicle. Meanwhile, the lower control layer completes the closed-loop control of the desired acceleration by establishing an inverse vehicle dynamics and mapping the throttle and brake. By contrast, direct control uses a centralized controller, in which the input is the sensor acquisition data and the output is the throttle and brake controls. Direct control structure is susceptible to model mismatch and poor robustness. The control parameters of the hierarchical control structure are relatively fixed and cannot adapt to the external complications of a traffic environment. This condition limits the application scope and reduces the usage rate of ACC.
The current study presents a sub-control framework to solve these problems and improve the adaptability of the ACC system to the complex traffic environment. The most typical division of the operating mode is dividing into cruise and follow conditions based on the effect of the vehicle in front of a driver.13,14 The follow condition is subdivided into three conditions, namely, uniform, acceleration, and deceleration. 15 The collection and analysis of the driving behavior of numerous drivers are used as basis to divide the follow condition into three, namely, comfortable, large deceleration, and emergency braking. 16 To improve the control quality, the follow condition is further subdivided into four, namely, steady following condition, approaching the front car, front car emergency acceleration, and front car emergency deceleration. 17 Front vehicle cut in and left departed are added in Yan. 18 Collision warning (CW)/collision avoidance (CA) is added to ACC in Moon et al. 19 and Cao et al., 20 thereby compensating for the lack of braking force of ACC under dangerous conditions and improving the safety of drivers and passengers.
However, the sensor measurement data tend to have considerable volatility because the real traffic environment is often substantially complex, thereby causing immense difficulties to vehicle control, such as ground movement and large body vibration. In addition, when traffic jam tracked, the spacing between an ACC vehicle and front vehicle is often substantially large, thereby easily causing traffic jam. This is because the safety distance of ACC vehicles generally includes a fixed distance, usually 3–4 m, for safety reasons. The idea itself is very sensible and can effectively improve the safety of ACC vehicles under normal driving conditions. However, this fixed distance is a bit large at low speed. We compared car spacing between drivers and the traditional ACC vehicle at low speed. The fixed safe distance of traditional ACC vehicles is 3 meters, and the headway is 1.2 seconds and 1.8 seconds as shown in Figure 1. The results show that the traditional ACC vehicle keeps a larger distance than the driver when driving at low speed.

Comparison of car spacing between drivers and the traditional ACC vehicles at low speed.
To make the ACC system adapt to the complicated traffic environment, the safety and comfort of a vehicle and the application scope of ACC should improve. Accordingly, this study presents a design of an ACC system with traffic jam and active collision avoidance function that can adapt to a large slope.
In addition, the current research considers the millimeter wave sensor for low-speed objects (i.e. below 5 km/h) or the poor recognition rate of static objects in combining the millimeter wave and laser sensors. The measured data likewise properly processed to approximate the actual driving state data.
Method
Overall structure and control logic of the ACC system
The ACC system mainly comprises sensors, control units, actuators, and user interfaces. Figure 2 shows the overall structure of this system. The inputs of the ACC system are real-time spacing, relative speed, ACC vehicle speed, ACC vehicle acceleration, ACC steering wheel angle, cruise speed, and cruise mode set by the user. The outputs are the engine throttle opening and duty cycle of the brake motor. In addition, the vehicle status information outputted to the monitor. As the experimental vehicle used in this study has an automatic transmission, the gear changing work done by the vehicle control system itself.

Overall structure diagram of ACC.
For low-speed or stationary objects, the error rate of the millimeter wave sensor is relatively high. Thus, a laser sensor is added to measure the spacing between the ACC vehicle and front obstacle. The ultrasonic sensor begins to function when the ACC vehicle and obstruction are below 2.5 m apart. There are three reasons why ultrasonic sensor is used. First, millimeter wave sensor’s error rate will be relatively high when the current target speed is less than 5 km/h or at rest. Second, the minimum effective measurement distance of laser ranging sensor is 1 m. The measurement accuracy cannot be guaranteed when the distance is less than 1 m. Third, when the target distance is within 2.5 m, the ultrasonic sensor’s measurement accuracy is higher than that of the laser and millimeter wave sensors. Therefore, when the current target speed is less than 5 km/h and the distance from the ACC vehicle is less than 1 m, the ultrasound is more secure.
The ACC system comprises three layers, namely, pattern selection, decision, and execution layers. The main function of the mode selection layer is to enable the driver to switch to the favorite control mode based on his preferences. The decision layer provides a real-time calculation of the expected acceleration in the corresponding control mode. The execution layer achieves the desired acceleration by adjusting the throttle opening or braking force. Figure 3 shows the ACC logic control chart.

ACC logic control chart.
Location and parameters of the sensor
This study uses three types of spacing measurement sensors, namely, laser ranging, millimeter wave radar, and ultrasonic spacing measurement sensors. Figure 4(a) shows that the laser ranging sensors are installed on both sides of the car. The millimeter wave radar is installed behind the vehicle logo. Meanwhile, four ultrasonic sensors are installed in front of the car. Figure 4(b) shows that the accelerometer is installed at the center of the car, the corner sensor is installed under the steering wheel, the monitor is installed in front of the driver, and the data collector and motor are installed on the floor in front of the co-pilot.

Installation location of the sensors: (a) vehicle internal, and (b) vehicle external.
Tables 1–4 show the parameters of the millimeter wave, laser, ultrasonic, and acceleration, respectively.
Parameters of the millimeter wave sensor.

Parameters of the laser sensor.

Parameters of the ultrasonic sensor.

Parameters of the acceleration sensor.

Interactive interface
Figure 5 shows that a human–computer interface is designed to enable drivers to easily use the ACC system. The driver can view vehicle informations in real time, such as control mode, cruise speed set, real speed and throttle opening. Moreover, a driver can switch the control mode or adjust the cruising speed at any time. To ensure safety, a driver cannot accelerate without stopping the ACC system when the vehicle is in a dangerous state and performs a brake.

Interactive interface of the ACC system.
Previous ACC systems can only fixed gradually to adjust the cruising speed, thereby enabling a driver to adjust the cruising speed to the ideal speed immediately. This study sets two adjustment steps based on the current speed. When the vehicle speed locate in 0–20 km/h, the step of adjustment is 2km/h (suitable in traffic jam tracking); when the vehicle speed between 20–40 km/h, the step of adjustment is 5 km/h; when the vehicle speed above 40 km/h, the step of adjustment is 10 km/h.
Division of working conditions
To control the longitudinal movement of the vehicle smoothly, researchers often divide the following behavior into several conditions. The simplest division is divided into the cruise and follows conditions. 13 However, this division is considerably simple for dynamic tracking. A few researchers subdivided the follow condition into three conditions, namely, uniform, acceleration, and deceleration 15 or comfortable, large deceleration, and emergency braking. 16 The tracking performance is good when the acceleration of the front vehicle slightly changes. However, the performance of dynamic tracking is poor when the acceleration of the front car changes substantially or when a few cars merge. Some researchers subdivided the follow condition into steady following, approaching the front car, front car quick acceleration, and front car emergency deceleration. 17
The current study presents 10 types of conditions: emergency collision, free cruise, smooth follow, comfortable follow, safe follow, radical follow, traffic jam follow, front vehicle quick acceleration, front vehicle emergency deceleration, front vehicle merging, and front vehicle leaving. The first condition is mainly based on the definition of the residual collision time. The second condition is mainly based on the definition of the time headway. The third to the sixth conditions is based on the expected acceleration definition. The seventh to the tenth conditions are temporary conditions. Four control modes, namely, smooth, comfortable, safe, and radical control modes, formed based on the 10 operating conditions. When a vehicle is in a dangerous state, it automatically switches to emergency collision conditions and the free cruise automatically switches to a smooth control model. The definition of the four control modes is the size of the acceleration. The range of the acceleration adjustment of the smooth control mode is mainly [−0.45, 0.45] m/s2 and generally not over [−0.6, 0.55] m/s2. The acceleration adjustment range of the comfort control mode is mainly [−0.6, 0.6] m/s2 and generally does not exceed [−0.91, 0.86] m/s2. The acceleration adjustment range of the safe control mode is mainly [−0.91, 0.86] m/s2 and generally does not exceed [−1.38, 1.1] m/s2. The acceleration adjustment range of the radical mode is mainly [−1.38, 1.1] m/s2 and generally does not exceed [−1.78, 1.56] m/s2.
The residual collision time is as follows

The time headway is as follows
where d is the real-time spacing,
When the remaining collision time is below 0.5 s, ACC automatically starts the collision avoidance mode. When the time headway is above 6 s, ACC will automatically switch to the free cruise mode.
Free acceleration acquisition
In general, road vehicle driving has a certain slope. The technical regulations of national highways stipulate that the maximum longitudinal slope of an expressway is 5% and the corresponding acceleration direction of the forward direction is 0.49 m/s2. This acceleration is slightly smaller than the steady follow maximum acceleraiton 21 value (0.6 m/s2) The maximum longitudinal slope of a four-stage highway is 9%, generating a 0.88 m/s2 acceleration in the forward direction, which is bigger than the steady follow maximum acceleration. Therefore, when the acceleration of a vehicle is measured using an accelerometer, the component of the gravitational acceleration should be disregarded.
The coordinate system used for the attitude angle settlement is the geographic coordinate system (G system), which is also known as the northeast up coordinate system. The G system’s origin is the surface of the Earth where the carrier is located, in which the xg- and yg-axes are located along the local latitude line and the local meridian point east and north, respectively. The zg-axis is located along the geographical vertical point to the sky. The body coordinate system (B system) is the origin of the carrier in the center of the mass, in which the yb-axis points to the forward direction of the carrier, xb-axis points to the right side of the carrier, and zb-axis points upward.
When the Euler angle represents the posture, the rotation order from the geographic coordinate system to the carrier coordinate system is z–y–x. That is, the system first rotated around the z-axis and rotated around the y-axis thereafter.
The transformation matrix around the z-axis rotation is as follows

The transformation matrix around the y-axis rotation is as follows

The transformation matrix around the x-axis rotation is as follows

The transition between the G and B systems is the product of three independent rotation transform matrices as follows

From the preceding four formulas
The gravitational acceleration has no projection component in the horizontal direction of the G system

In the body coordinate system of a vehicle, the accelerometer contains the gravitational component as follows

Thus

that is

thereby

The free acceleration of the three axes in the vehicle body coordinate system is as follows

That is

where
Signal processing
The data measured by the millimeter wave and laser sensors have immense fluctuation because of the unevenness of the road and inherent vibration of a vehicle, thereby providing immense trouble to the smooth control of such vehicle. The original measurement data of the distance of vehicles fluctuate substantially (see Figure 6). In order to control vehicle smoothly, signals need to be properly processed. Signal processing mainly includes the following steps:
Step 1: If a target at the previous time is detected and no target is detected for the next 2 s (laser, 200 times; millimeter wave, 40 times), then the front target has left the driveway and has no valid target. Proceed to Step 6. Otherwise, use the value of the previous time and continue to the next step.
Step 2: If the target distance
Step 3: If the car interval at this time is less than that of the previous time, for safety reasons, we assume that the car on the side lane enters our lane. This moment value adopted. Proceed to Step 6. Otherwise, continue to the next step.
Step 4: If the aforementioned three cases did not appear, then the distance of the measurement data is proven to be correct. If a car is accelerating and
Step 5: If a car is decelerating,
Step 6: Execute

Original vehicle spacing map.
Figure 7(a) and (b) shows the comparison of distance and relative velocity before and after processing, respectively. The blue line represents the original data and the red represents the processed data. Compared with the original data, the processed data are smoother and closer to real data.

The comparison of signals before and after processing: (a) distance and (b) relative velocity.
Statistical analysis of the driving behavior and vehicle spacing control
The strategy of vehicle spacing control divided into two types, namely, constant and variable spacing control strategies. The constant vehicle spacing strategy maintains constant spacing from the front vehicle during the following. This strategy has fixed parameters and easy to design, although the optimal parameters are difficult to determine and may only be adapted to a single condition. Variable vehicle spacing strategy is divided into the constant time headway (CTH) and variable time headway (VTH) strategies. Between the aforementioned strategies proposed in 1993, the CTH strategy has a good performance of reliability and stability and adopted by many car manufacturers. However, this strategy has relatively large range of speed changes and may only be adapted to a certain number of speed segments. Thus, the VTH strategy is proposed, such as nonlinear spacing policies 22 and the spacing control algorithm designed by linear quadratic optimal control theory. 23 These spacing control strategies can achieve an effective follow to the front vehicle. However, the acceptance rate of the ACC system is low because the follow behavior of drivers is not considered. The vehicle spacing control strategy based on driver following behavior is favored by researchers because of its proximity to the real following characteristics of drivers. 24
The driving behaviors of 10 mature drivers, age from 25 to 37 years old with driving experiences of 6–20 years, were determined. The results of the statistical analysis are as follows:
1. Acceleration analysis Cruise. The acceleration distribution distributed within [−0.34, 0.29] m/s2, of which over 95% are distributed in [−0.21, 0.19] m/s2. Low speed. The acceleration distributed within [−1.36, 1.63] m/s2, of which over 95% are distributed in [−0.78, 0.66] m/s2. Traffic jam tracking. The acceleration distributed within [−2.37, 1.97] m/s2, of which over 95% are distributed in [−1.38, 1.1] m/s2.
2. Time headway analysis
The time headway obtained by the front and ACC cars that drive at the same speed. The deceleration and braking time headways obtained at 5, 10, 15, 20, 40, and 50 km/h. Subsequently, the velocity is divided into [5, 10), [10, 15), [15, 20), [20, 40), and [40, 50) km/h. Figure 8(a) shows the velocity–time headway graph is obtained using the quadratic term fitting method. When the speed is below 5 km/h, the deceleration and break time headways are 2.5 and 2 s, respectively.
3. Residual collision time
The residual collision time is 1–2.4 s. This time increases with the decrease of vehicle speed and vehicle spacing and decreases with relative velocity. When the relative velocity is near 0, the residual collision time is 1 s (except when the velocity of the two cars is below 5 km/h). The relationship between the deceleration distance and velocity and the braking distance and vehicle is shown in Figure 8(b).

(a) Velocity–time headway and (b) velocity–deceleration distance and velocity–brake distance.
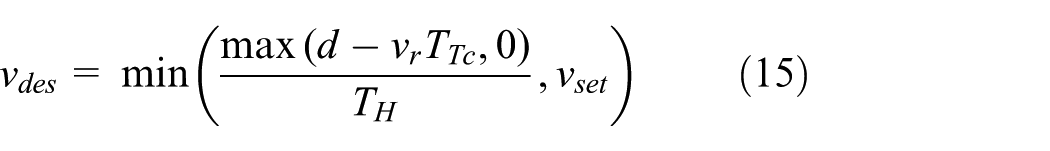
4. Desired speed
The current study is different from the previous control strategy, which only uses time headway, because the former uses time headway to control whether the ACC vehicle decelerates or brakes. The expected speed is used to control whether the ACC vehicle accelerates or decelerates to achieve a smooth control effect.
The expected velocity is calculated as follows
where
Control method of the implementing agency
Throttle control
Throttle adjustment uses the fuzzy logic control method. The input has three: desired speed

For the classical fuzzy control method, the error variation is defined as follows

In the actual driving process, the expected speed in most cases and short period is often a constant value. Thus

Thereafter

where
In the case of the smooth control model, e is divided into (−∞, −5.0), [−5.0, −3.5), [−3.5, −2.5), [−2.5, −1.5), [−1.5, −0.5), [−0.5 0.5), [0.5, 1.5), [1.5, 2.5), [2.5, 3.5), [3.5, 5.0), and [5.0, ∞) km/h. Meanwhile, a is divided into (−∞, −1.38), [−1.38, −0.91), [−0.91, −0.6), [−0.6, −0.45), [−0.45, −0.34), [−0.34, 0.3), [0.3, 0.45), [0.45, 0.55), [0.55, 0.76), [0.76, 1.1), and [1.1, ∞) m/s2. Consequently, an 11 × 11 matrix is constructed based on a vehicle’s real-time
Brake control
Although the decrease in the throttle opening can relatively decelerate the ACC vehicle, this vehicle needs substantial deceleration and must stopped using the brake mechanism. Drivers step on the brake pedal to brake. The brake actuator in this study is a cable motor. The velocity of the cable motor adjusted by adjusting the duty cycle in real time, which is equivalent to the speed when the driver stepped on the brake pedal. When the cable motor is working, the throttle opening is set to zero.
Real vehicle experiments
Real vehicle tests conducted to test whether the designed ACC system can achieve imitation driving. The test site is located in the Shandong University Xinglongshan campus in Jinan, China. Accordingly, cruise test, low-speed follow experiment, and traffic jam tracking experiment conducted.
Cruise test
The cruising speed of the test car is set to 20 km/h and the balance mode selected. The real-time velocity is shown in Figure 9(a). The velocity is mainly concentrated in the 18.5–20.5 km/h range and achieved an improved velocity cruise function. The real-time acceleration is shown in Figure 9(b). The acceleration of a car is mainly concentrated in [−0.3, 0.3] m/s2, maximum acceleration value is 0.49 m/s2, and minimum value is −0.68 m/s2. Thus, the cruise comfort requirements met. The throttle opening (see Figure 9(c)) generally maintained at approximately 9% without the frequent control of the throttle.
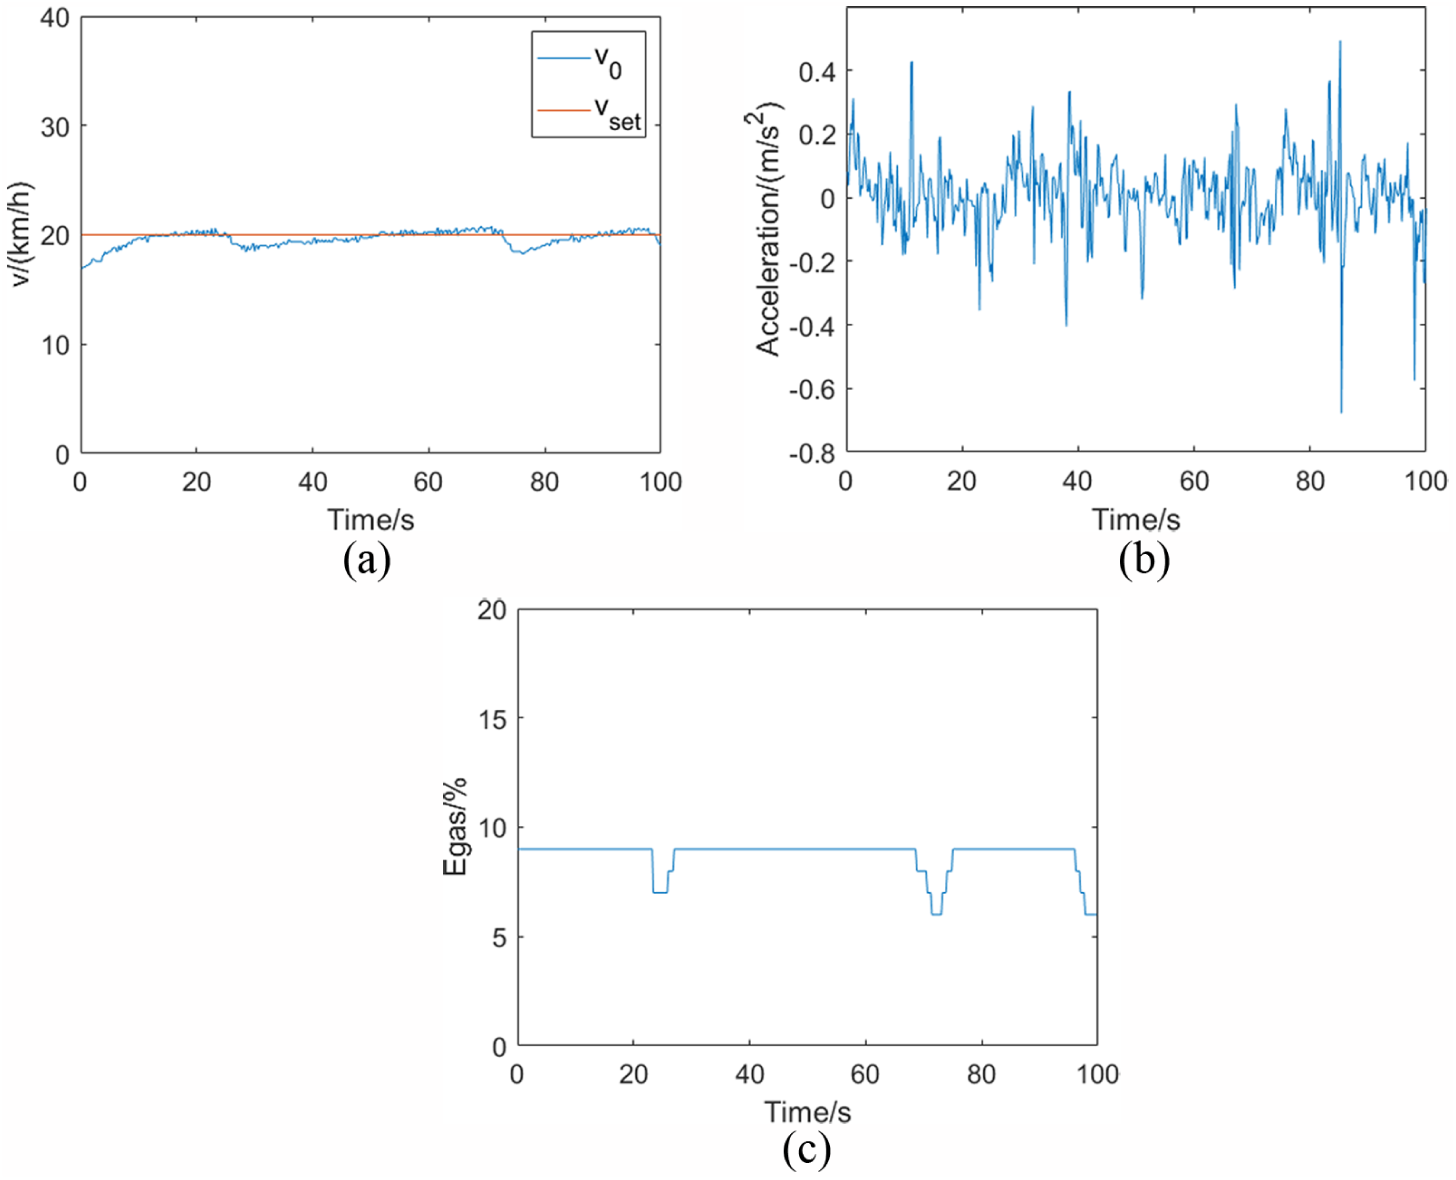
Real-time results of cruise test: (a) velocity, (b) acceleration, and (c) throttle opening.
Low-speed follow experiment
In this experiment, the cruising speed of the ACC vehicle is set to 30 km/h, and the control mode select the safety mode. First, the front car starts quickly (i.e. first 10 s); then decelerates rapidly (10th to 11th seconds); after that, fast acceleration (11th to 17th seconds); then rapid deceleration again (17th to 19th seconds); finally, gradually drive at a steady speed.
The real-time velocity of vehicles is shown in Figure 10(a). The velocity difference is relatively large during the first 15 s of the initial stage. Thereafter, the speed difference is maintained at 2 km/h, thereby indicating that the car can considerably follow the front car. The spacing map of a car (see Figure 10(b)) shows that the spacing between the ACC and front cars relatively varies. Moreover, the ACC car follows the front car well.

Real-time results of low-speed follow experiment: (a) velocity, (b) vehicle spacing, (c) acceleration, and (d) throttle opening.
The real-time acceleration is shown in Figure 10(c). During the first 10 s of the front vehicle start and the 10th to 20th second of the front vehicle’s large deceleration, the acceleration of the ACC vehicle is slightly higher to follow the vehicle better. After 20 s, when the velocity of the front car is stable, the acceleration of the ACC vehicle is stable within [−0.48, 0.19] m/s2, thereby indicating that ACC vehicle can considerably meet the comfort requirements. The throttle opening is shown in Figure 10(d). No frequent control of the throttle is observed.
Traffic jam tracking experiment
In this experiment, the cruise speed of the ACC vehicle is set to 30 km/h and the control mode selected is the radical mode. First, the front car slowly decelerates from low speed to stop; after 5 seconds, it starts to accelerate quickly (8th to 18th second); then decelerates rapidly (18.6 to 24 seconds); after 1.5 seconds, it enters the next acceleration deceleration cycle.
The real-time velocity is shown in Figure 11(a). When the front vehicle accelerates, the ACC vehicle can accelerate in time. When the front vehicle decelerates, the ACC vehicle can rapidly decelerate, thereby meeting the requirements of the following front vehicle. The spacing map (see Figure 11(b)) shows that the spacing between the ACC car and front car relatively varies. Moreover, the ACC car considerably follows the front car.
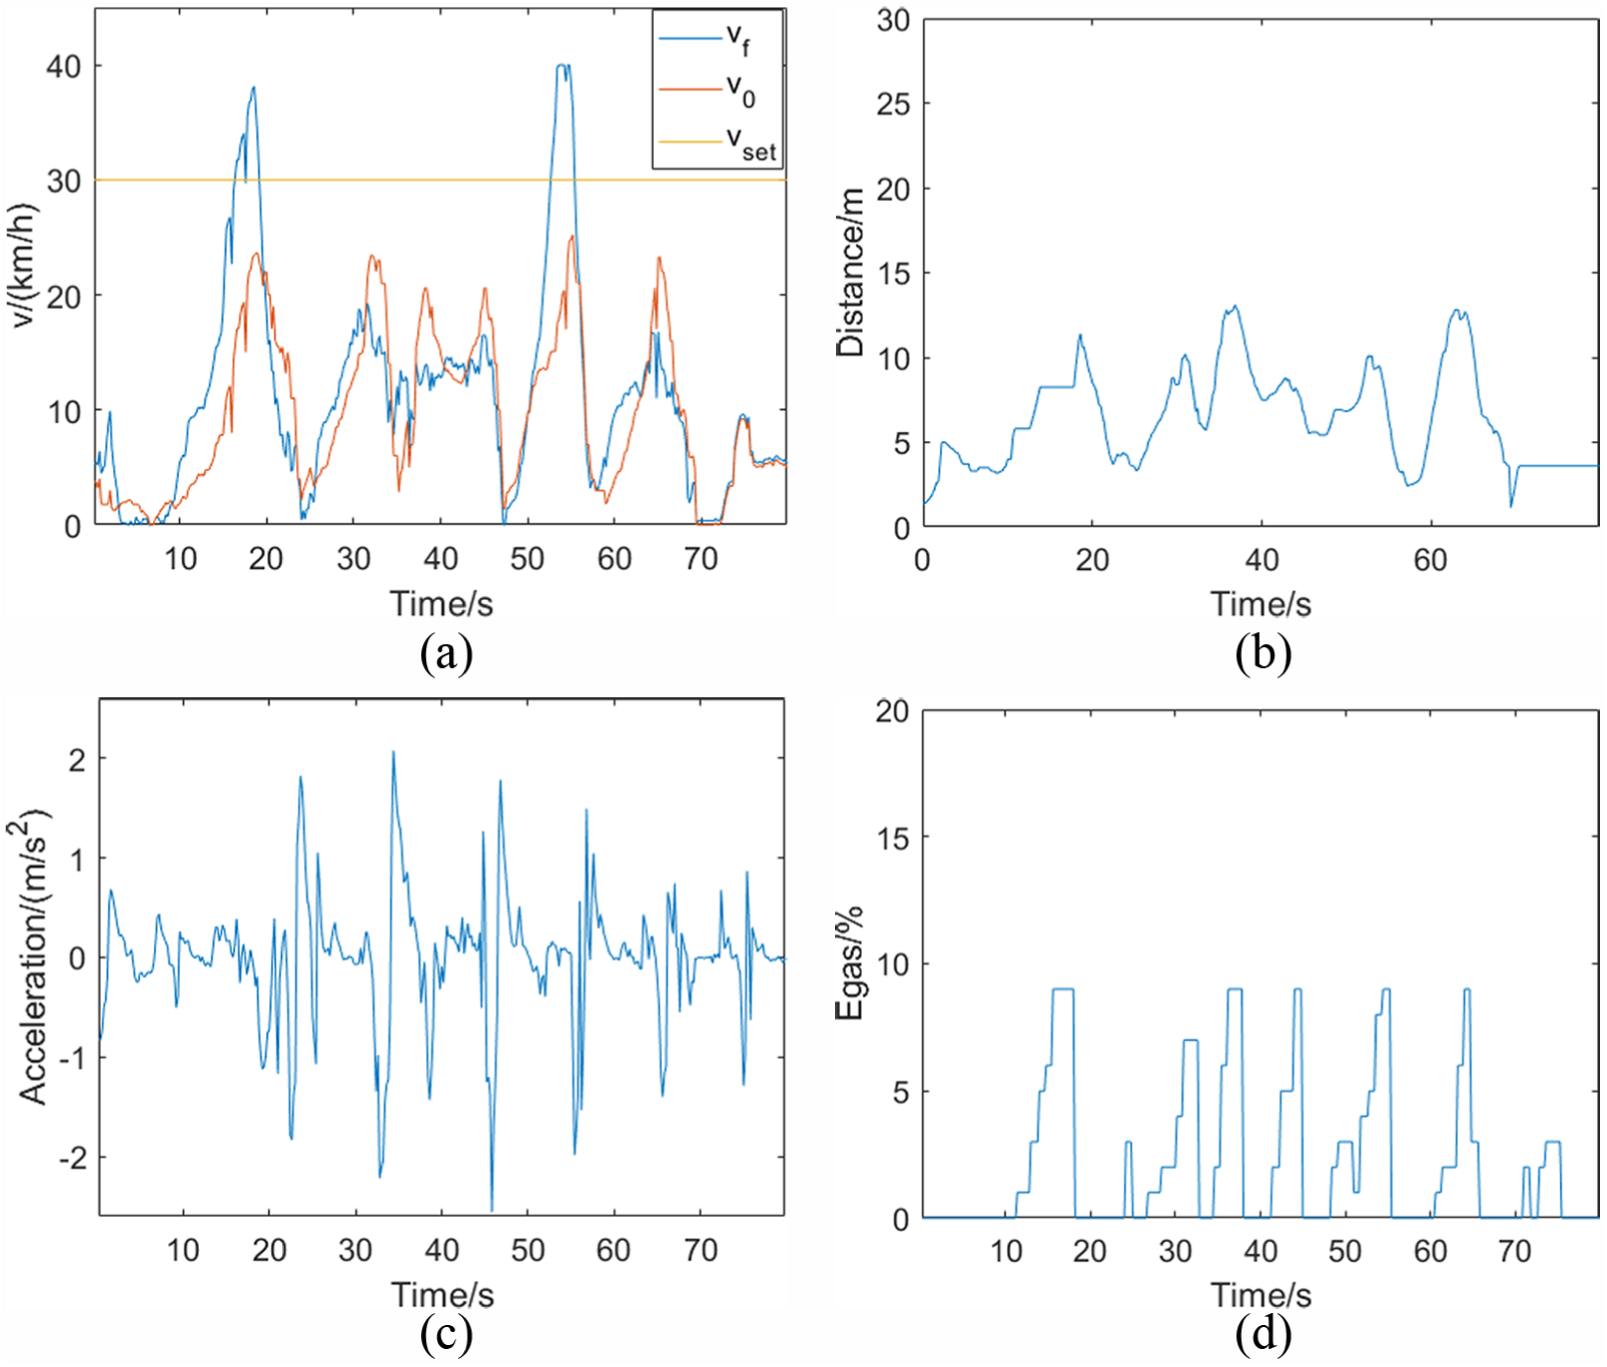
Real-time results of traffic jam tracking experiment: (a) velocity, (b) vehicle spacing, (c) acceleration, and (d) throttle opening.
When the front vehicle stopped, the ACC vehicle will approach the vehicle gradually (1st to 6.5th second), thereby reducing the spacing from the front car (see When the current vehicle is stopped, the ACC vehicle gradually approaches the front vehicle (1st to 6.5th second), thereby reducing the vehicle spacing (see Figure 11(a) and (b)). When the front car is driving at a low speed and the velocity changes not big (after 70 seconds), the distance between the ACC vehicle and the front vehicle is substantially stable (about 3.5 meters). This shows that the ACC system proposed in this paper can reduce traffic congestion to a certain extent.
Figure 11(c) shows that although the front car has a rapid start and rapid deceleration, the speed changes substantially. However, the acceleration of the ACC vehicle is mainly distributed in the [−1.5, 1.5] m/s2. Compared with skilled drivers [−1.38, 1.1] m/s2, this gap is not considerably large. The throttle opening is shown in Figure 11(d). In the radical mode, the throttle changes rapidly to follow the front car better.
Comparison experiments between the classic method and the proposed method
In order to verify the superiority of the proposed method compared with the classic method, we carried out a follow-up contrast experiment under the state of traffic jamming and calculated the acceleration and throttle opening data of these two methods. The results are shown in Tables 5 and 6. From Tables 5 and 6, it can be seen that compared with the classic method, the proposed method is more stable in terms of acceleration control and accelerator opening control, that is, it has better performance in terms of comfort and fuel economy.
The comparison of acceleration.
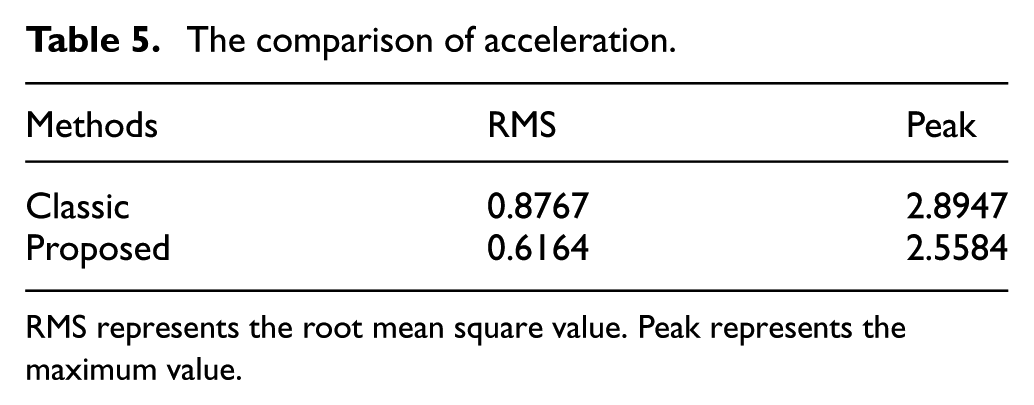
RMS represents the root mean square value. Peak represents the maximum value.
The comparison of throttle opening.
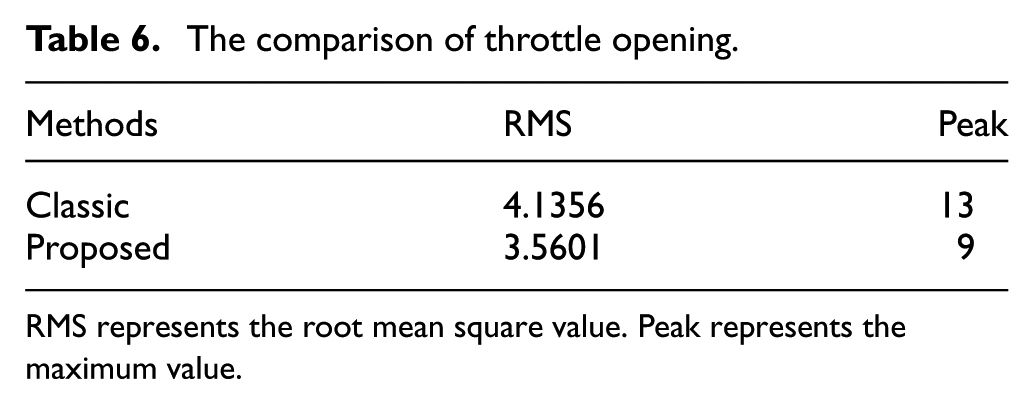
RMS represents the root mean square value. Peak represents the maximum value.
Conclusion
The traditional ACC system generally requires 25–40 km/h velocity to function. This study increases the traffic jam tracking function of a vehicle based on the traditional ACC function. Deceleration achieved in stop states. Stationary objects can also be adjusted. The scope of the application of the ACC system expanded. This study also provides the smooth, comfortable, safe, and radical control modes for driver selection. The simultaneous use of the millimeter wave sensors and laser sensors and smooth processing of the measured data relatively reduce the impact of road surface and body vibration, thereby making the measured vehicle distance and relative speed approximate the real value. Given that the road surface may have a large slope, this study excludes the gravitational acceleration in the body coordinate system and uses free acceleration to control the vehicle. For safety reasons, collision avoidance function added. Complete braking is performed when the remaining collision time is below 0.5 s. Finally, the vehicle spacing control and acceleration control are optimized under the premise of ensuring the safety and comfort of the vehicle, and the application range of ACC and the probability of being adopted by drivers is improved. Real vehicle experiments show that the distance and acceleration errors are within the driver’s expected range of error, particularly during traffic jam tracking. The ACC vehicle controlled at approximately 3.5 m to ensure the safety of the jam behavior. Future research will attempt to use an improved algorithm to achieve considerable anthropomorphic driving of vehicles. Thus, the ACC system will be able to approximate the driving behavior of skilled drivers, improve the application rate of ACC systems, and continue to extend the functions of ACC systems.
Footnotes
Handling Editor: Fakher Chaari
Declaration of conflicting interests
The author(s) declared no potential conflicts of interest with respect to the research, authorship, and/or publication of this article.
Funding
The author(s) disclosed receipt of the following financial support for the research, authorship, and/or publication of this article: This work supported by Shandong Province Key Research and Development Program, China (grant no. 2015GGX105005).