
Abstract
The concept of multi-attribute topological graph is proposed in this article to represent the characteristics of both structure and state for typical one-degree-of-freedom planar spur closed planetary gear trains. This method is well applied in power flow analysis and provides a graphical view for the types, values, directions, and transmission relationship of power flow, especially for the recirculation power representation. Furthermore, a template model of multi-attribute topological graph for closed planetary gear trains is also presented, which would be helpful to the multi-attribute topological graph generation for some certain types of closed planetary gear trains just by changing symbols in the template model. A corresponding software is also developed to make the analysis process more convenient. By inputting different parameters, the different visual results can be obtained automatically, thus benefiting engineers in conceptual design.
Keywords
Introduction
Closed planetary gear trains (CPGTs) have the advantages of high transmission ratio, large loading capacity, compact volume, and so on, which has a variety of applications, such as vehicles, airplanes, and automation industry. 1 However, the power flow analysis,2–4 as a significant part of CPGT research, has become a complex and difficult issue. The main reasons are the uncertain determination of power flow directions and the possible generation of power recirculation. For one structure of CPGTs, various power flow types can be generated by the different choice of transmission ratio on each branch. When dealing with the design of one specific type of power flow, engineers usually do not only rely on the experience, but need multiple calculations, which can turn into an extremely complex and time-consuming task.
Many researchers have been concerned with making the power flow analysis more simple and visualized. 5 In 1970, Buchsbaum and Freudenstein 6 introduced the idea of graph theory and proposed a graph representation to provide an intuitive view in solving mechanical issues. F Freudenstein and AT Yang 7 illustrated a graph representation of kinematic structure aiming at the power flow determination. A virtual power graph was employed by C Chen 8 to analyze the power flow of power-split planetary gear trains. Pennestrì and colleagues9–11 studied the power flow of spur gear planetary gear transmission using graphical methods. Based on hypergraph and matrix operation, FC Yang et al. 12 proposed a method for power flow analysis. New approaches have been put forward and improvements have been highly achieved with the works mentioned above, but there are still some limitations in the application of visualization. First, these methods are too professional with abstract graphs to popularize. Second, the general power flow view provided is not sufficient in the representation of power distribution on each branch, transmission relations between components, and internal power circulation, since the physical structure is less contained.
Meanwhile, continuous efforts have been made by researchers to express the structural characteristics of gear trains. For instance, coincident joint graph was presented by Olson et al., 13 canonical graph was provided by Chatterjee and Tsai, 14 and kinematic fractionated graph was introduced by DZ Chen and KL Yao. 15 Through these graphs, the mapping relationship between graph and structure was provided, and basic motion units were divided according to planets and so on. Sohn and Freudenstein, 16 Vucinan and Freudenstein, 17 and Zou et al. 18 all made great progresses according to the theory. However, they still lack the complete expression of structure and properties of components. In addition, the description of state characteristics was not taken into account. Therefore, a new graphical representation method including the characteristics of integral structure and state is needed. In line with this idea, Xue et al. 19 summarized the merits and drawbacks, and then he 20 developed a systematic topological graph (TG) model based on functional fractionation, thus making the information contained more complete and expressive. Nevertheless, the main application of this method is the structural synthesis of mechanisms.
Based on the published works about the TGs, the concept of a multi-attribute topological graph (MATG) is proposed to integrate CPGT modeling and power flow analysis closely. Multi-attributes refer to the shapes and colors of the images enriching the content, which are the very characteristics to the visualized MATG. Through this method, the description of structural and state characteristics of CPGTs is more complete and understandable; also, the analysis of power flow is more straightforward and clear. Moreover, the processes of MATG generation and result analysis become more efficient with the assistance of powerful computers, 21 which greatly benefit engineers in conceptual design of CPGTs.22,23 The rest of this work is organized as follows. In section “Some concepts,” the different symbols for characteristics of MATG are defined and the template model of MATG for a certain type of CPGTs is presented. Section “Power flow analysis without considering losses” illustrates the power flow equations corresponding to MATG and explains in detail about the power flow types. Two examples of CPGTs are considered to be analyzed in MATG by applying the software framework presented in section “Software implementation and application examples,” and the conclusions are drawn in section “Conclusion.” It needs to be noted that this study is focused on the examples of one-degree-of-freedom (DOF) planetary gears closed with fixed-axis gears (single-loop system), but this method can also be extended to two or more DOFs.
Some concepts
Concept of the TG model
To describe the planetary gear trains, the TG model was proposed by Xue et al. 20 In this model, there are five types of machine elements: suns, planets, fixed-axis gears, carriers, and shafts. According to the structural properties, these components can be classified into three levels (see Figure 1), which are planetary level for planets and carriers, solar level for coaxial suns, and fixed-axis gear level for fixed-axis gears.

Topological unit graph.
An example of the TG model transformed from structure diagram is shown in Figure 2. The solid vertices represent the planets, while the hollow vertices represent the other gears. Carriers are denoted by small squares, and the spindles of gears are default for representation. In the TG model, gear pairs are denoted by thick edges, turning pairs by thin edges, and dashed edges represent the carriers and gears fixed together.

A TG model transformed from structure diagram.
It is indicated that the physical characteristics and special states are represented clearly, and this method can also reflect the topological properties systematically. However, the various types of gears only denoted by the solid and hollow vertices are not sufficient in the analysis of power flow transmission. More concretely, the uncertain properties of components will lead to the unclear connection relationships between them, which could bring difficulties in power flow analysis.
Concept of MATG
In order to overcome the shortcomings of the TG model, an improved representation method named MATG is proposed based on the TG model and utilized for structure and state characteristic analysis of CPGTs. Here, the structural characteristics refer to gear types and connection types between components, whereas the state characteristics refer to speed, torque, and power flow (value and direction) on each branch. For the sake of clear description of these characteristics, some symbols and colors are utilized in MATG. The definitions of the symbols are as follows.
Definition of gear types
By establishing the mapping relations between the mechanical domain and the graph domain, the types of gears could become clear and each of the gears will contain unique property. Figure 3 depicts the mapping relations. The planets and carriers are still represented by the former graphic symbols (solid vertices and squares). The representations of other gears are subdivided into three types, which are circles for suns, toroid for rings, and circles with a central dot for fixed-axis gears. In addition, carriers are classified into solar level since they are in the same axis of rotation.

Mapping relations of gear types.
Definition of connection types between components
There are three types of connections, which are gear fixed connection, gear pair, and turning pair. The first connection and the others equivalent to it are denoted by concentric symbols. The latter two are indicated by the solid edges as the TG model. The fixed connections between gears in each level are displayed in Figure 4(a)–(c).
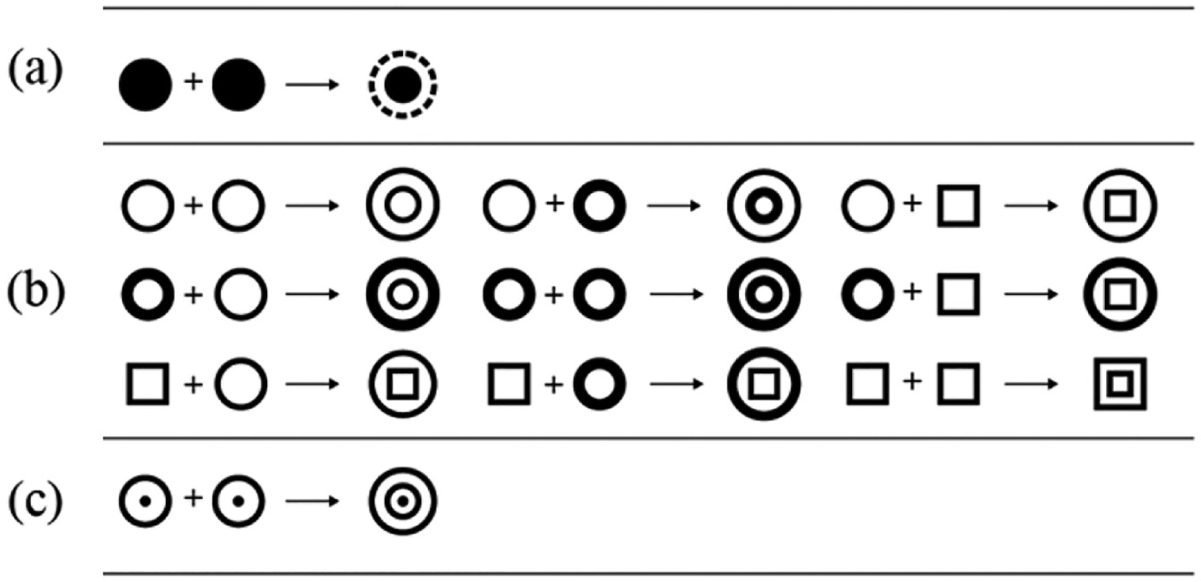
The representations of fixed connection in (a) planetary level, (b) solar level, and (c) fixed-axis gear level.
Definition of power flow characteristic representations
In MATG, the values of characteristics are considered by the widths of arrow shafts/edges, and the colors are also applied to represent the certain values. In this case, the ratio of widths from each other is equal to the ratio of values from each other. Figure 5 shows a yellow arrow directing from gear 1 to gear 2, which denotes the power flowing from sun 1 to sun 2. The width of the arrow shaft indicates the power value and the color represents the value in a certain range.

The power flow expression.
The template model
There are two transmission types of CPGTs. One is XP and the other is PX (see Figure 6). X represents the differential gear train unit and P represents the unit for closing (such as ordinary fixed-axis gear trains, various planetary gear trains, continuously variable transmission (CVT), etc.); c, b, a, α, and β represent each branch, respectively, and J0 represents the convergence point of power flow. This study is focused on XP (a differential and a fixed gear train are closed together) with a single loop called Type A system.

The single-loop system of one-degree freedom of (a) XP system and (b) PX system.
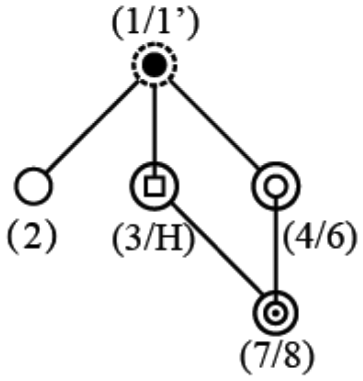
The template model of Type A system can be concluded due to the structural properties of the XP transmission system and the strong regularities of the MATG form, and it is displayed in Figure 7. It should be noted that the gears in solar level are all drawn by circles to represent any types; all possible fixed connections are reserved and described by concentric circles. In this template, the differential gear train consists of the gears 1, 1′, 2, 3, and 4, while the fixed-axis gear train consists of the gears 5, 6, 7, and 8.

The template model of the Type A system.
By changing the symbols of this template model, different MATGs of the Type A system can be generated according to the corresponding specific mechanisms. Here, the transformation processes of three MATG examples are listed in Table 1. The advantages of MATG also can be seen through these examples. MATG is another representation form of structure diagram, which means that the gear types and connections between components are directly reflected by MATG. Compared to the structure diagram, MATG can clearly express the numbers of each gear type as well as the loops in the system.
Three corresponding MATG examples transformed from the template model according to structure diagrams.


MATG: multi-attribute topological graph.
Power flow analysis without considering losses
Power flow equations
Although the TG model is an effective tool for the type synthesis of mechanisms, it has not been extended to the power analysis. The MATG method does not only improve the representation from the TG model, but it can also be validly used to analyze the power characteristics combined with formulas. The main process of formula derivation is illustrated as follows:
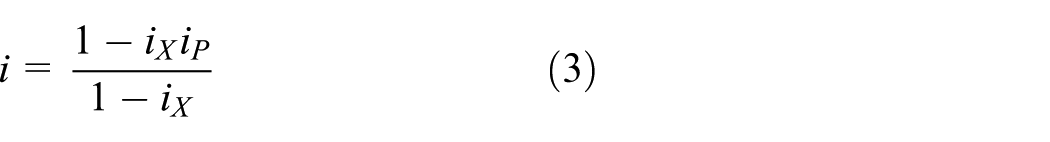
Based on the theoretical mechanics and the principle of relative motion, in the template model, the transmission ratio of the X unit is

Similarly, the transmission ratio of the P unit is

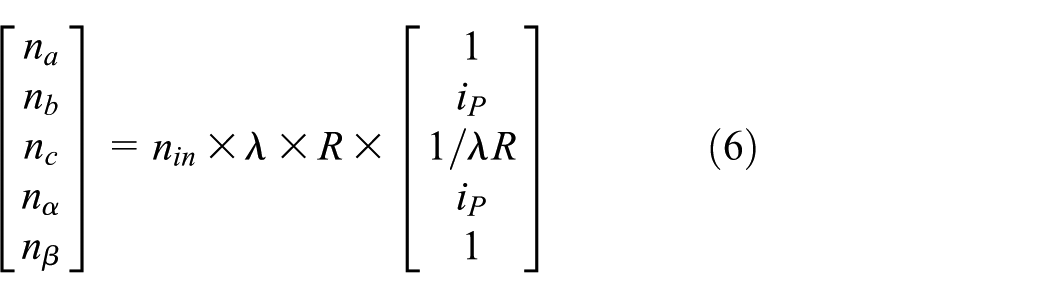
where na, nb, nc, nα, and nβ are the speeds of the gears 4, 3, 2, 5, and 6, respectively.
The speed of gear 3 is equal to that of gear 5 as well as to those of the gears 4–6 due to the fixed relation between those components, and then the total transmission ratio is
Here, the mathematical models should serve the visual expression of data and each component should have unified parameter expression. The relative equations24,25 for MATG are listed to meet the requirements. Let


The speed of each component
The torque of each component
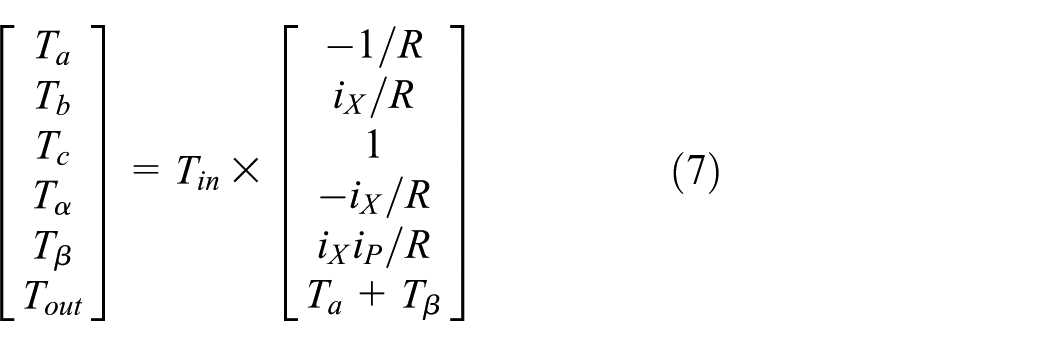
The power of each component

Power flow types in MATG
There are three types of power flow due to the recirculation power. 24 The expressions of these types in MATG are presented in Figure 8. The widths of the arrow shafts are determined by the ratio from the power equations. If the widths in the loop are all narrower than the input width, then the type of power flow is power split; otherwise, it is power reflux which can be divided into two recirculation power types: anticlockwise loop and clockwise loop.

The expressions of three types of power flow in MATG: (a) power split, (b) power anticlockwise reflux, and (c) power clockwise reflux.
The three properties of MATG of the Type A system are as follows:
Property 1. The distributions of power flow characteristics on branches can be seen directly in MATG. The directions of arrows represent the directions of power flow; the ratio of widths of arrow shafts from each other is equal to the ratio of power values.
Property 2. If the widths of arrow shafts in the loop are wider than the input, then it is indicated that there is recirculation power in this system.
Property 3. Under the situation of power recirculation, the narrowest arrow shafts in the loop represent the recirculation power.
Software implementation and application examples
Software framework
There is increasing manual work replaced by the powerful computer, which benefits designers a lot. Under this trend, the graphic constructions and the corresponding equations of this method are compiled in programming using Visual Basic 6.0, thus improving the working efficiency greatly.
In this software, the template model of the Type A system can be directly applied, and the equations in section “Power flow analysis without considering losses” can also be compiled for computation. Besides the modifiable template, a database organizing the MAGTs of common mechanisms is provided and ready for calling. Figure 9 indicates the whole process of software application.
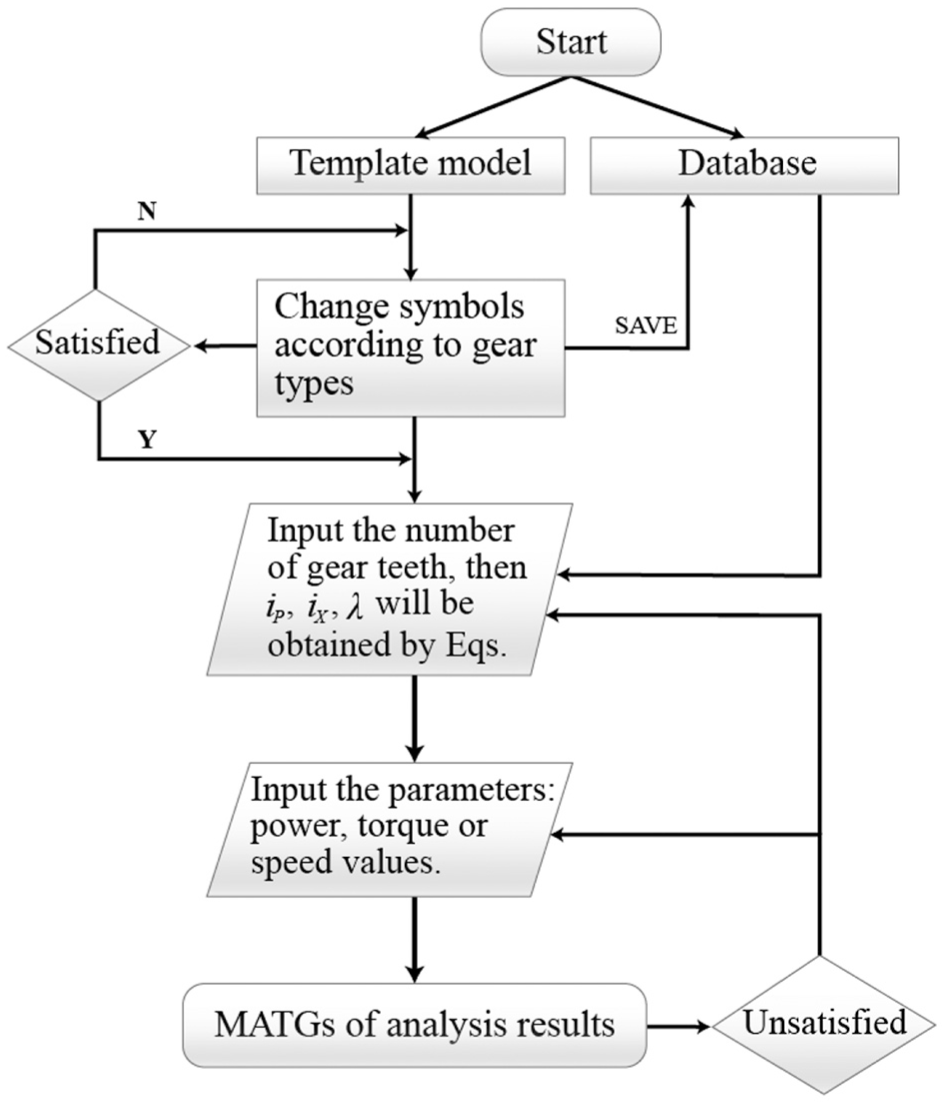
The flowchart of framework of the whole process of application.
The steps of generating MATG representations are as follows:
Step 1. Select the template model or the database according to the requirements. If the template is chosen, go to step 2; if the database is chosen, go to step 4.
Step 2. Make sure the correct symbol representation of each gear type according to the structure diagram.
Step 3. Confirm the specific MATG. It can be saved into the database directly, or repeat step 2 if it does not meet the requirements.
Step 4. Input the number of teeth for gears; then the values of iX, iP, and
Step 5. Input the relative parameters, such as the values of power, torque, and speed.
Step 6. The MATGs of power flow analysis are displayed. The results can be updated easily just by changing the relative parameters in step 4 or 5.
Applications for analysis
Assuming that two MATGs from the database are selected, respectively, the processes of generating the analysis graphs are explained in detail below.
Example 1
This mechanism (the second example in Table 1) was conducted for transmission analysis in a testbed to drive a load of 10 N m. 26
According to the steps mentioned above, the input characteristics (the original experimental parameters) are as follows:

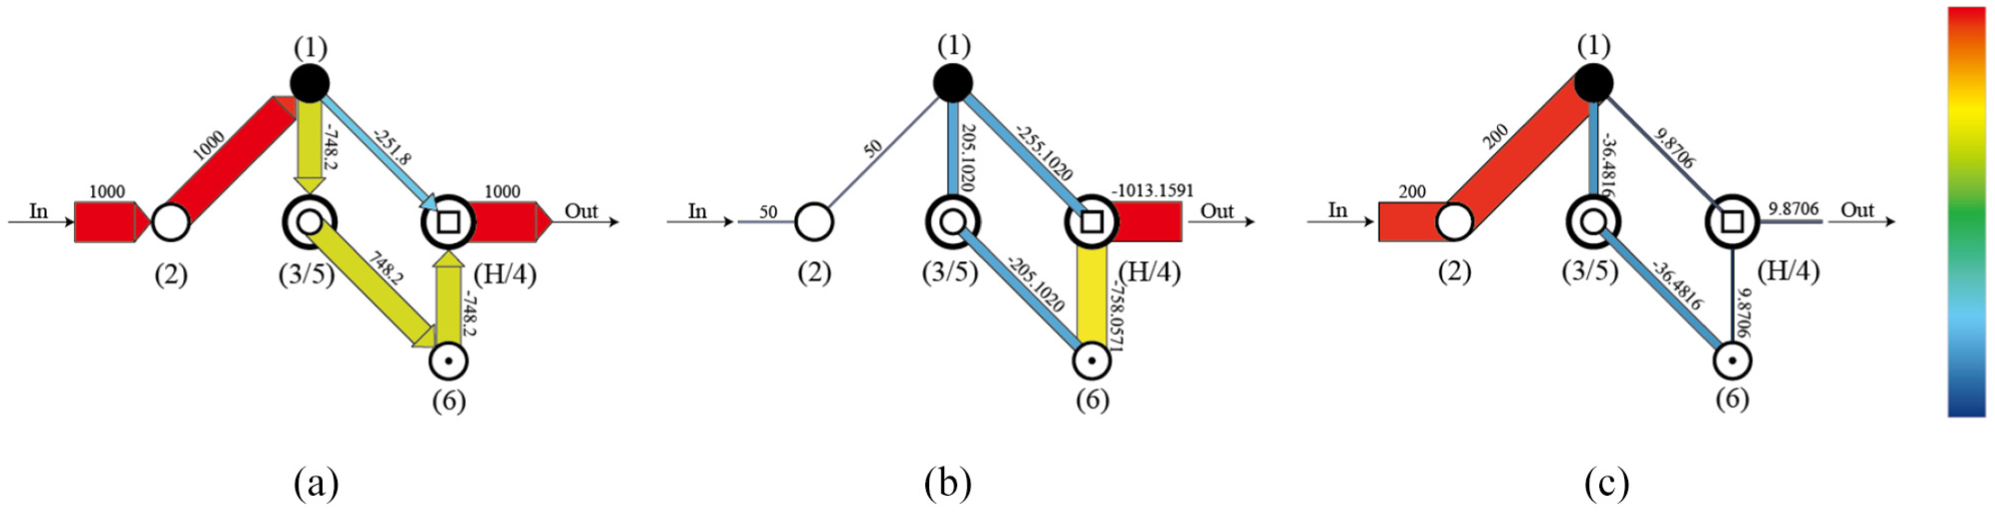
Power flow analysis of Example 1 in MATG: (a) power flow analysis, (b) torque analysis, and (c) speed analysis.
Clearly, there is recirculation power (431.732 kW) flowing clockwise in the loop, which is represented separately to provide a clear view of the power distribution. It also suggests that the branch (the planet/planet 1/1′ to sun/sun 4/6) has a large load and needs to be noticed in designing. In addition, this system has the properties of reducing torque and increasing speed.
Example 2
Another mechanism (the third example in Table 1) is applied for the analysis. Suppose the input characteristics to be as follows:
Power flow analysis of Example 2 in MATG: (a) power flow analysis, (b) torque analysis, and (c) speed analysis.
It can be seen intuitively that there is no recirculation power in this system since the widths of arrow shafts in the loop are all narrower than the input. Comparing with the structure diagram, the relationship between each component is much easier to understand. The input power first flows from sun 2 to planet 1 and then splits into two paths. One straightly flows to the carrier H fixed with ring 4; the other is a long path, which flows from ring/sun 3/5 to the fixed 6 and eventually to ring 4 fixing with carrier H where the powers confluence and output. In addition, this system has the properties of high output torque and reducing speed, so the transmission scheme is reasonable.
Conclusion
This article proposes a method called MATG for the visualized power flow analysis of CPGTs. The main conclusions can be summarized as follows:
The MATG improves the structural characteristic description of CPGTs.
The MATG is capable of analyzing the power flow. It can not only reflect the power flow types, but also describe the values, directions, and the transmission relationship of power flow, especially the recirculation power.
A template model is proposed to correspond to different structures of the Type A system. By changing some symbols, the different MATGs can be generated and used for the power flow analysis.
The corresponding software is developed through compiling MATG and equations. Different analysis results in MATG can be obtained automatically by changing the parameters, which could help designers make assessments.
It is more convenient for engineers to have an overview of the mechanical properties, and it can provide some reference and guidance at the early stage for conceptual design of CPGTs. As a result, the transmission scheme designs become more reasonable, and the blindness of design relying on the uneven experiences will be avoided.
Footnotes
Acknowledgements
The authors are grateful to the referees for their helpful suggestions and comments which have improved the manuscript.
Handling Editor: Francesco Massi
Declaration of conflicting interests
The author(s) declared no potential conflicts of interest with respect to the research, authorship, and/or publication of this article.
Funding
The author(s) disclosed receipt of the following financial support for the research, authorship, and/or publication of this article: This work was supported by the National Natural Science Foundation of China (Grant No. 51175419) and the Postgraduate Training Project of Xi’an University of Technology (Grant No. 252051626).