
Abstract
Laser scribing can be used to enhance the flexibility of polymer films for flexible device applications. To optimize the bending curvature by controlling the scribing parameters—the depth, number, and interval of the scribed grooves, finite element analysis was conducted on the bending tests of scribed polyethylene terephthalate films. Moreover, the influences of the parameters on the stress/strain near the grooves were investigated. The maximum stress/strain and curvature generally increased with an increase in depth, whereas these values decreased with an increase in number and intervals. However, to maintain the mechanical stability of the films, the parameters were limited. The optimization results revealed that the maximum value of the curvature was 2.6 mm−1 at depth = 40 and intervals = 25 μm, for number = 7. An empirical equation relating the curvature to depth and intervals was also provided. The results of the analysis are useful for the design of laser-scribed grooves on various polymer films, for the enhancement of their bending curvature, while minimizing the mechanical instability.
Introduction
In the semiconductor industry, laser scribing is a potentially vital tool for mechanical processes such as cutting or dividing wafers and substrates, for the fabrication of touch-sensitive and light-emitting diode (LED) displays. This technique is applied in the fabrication of various devices, including photovoltaics, 1 electrochemical storage devices,2,3 actuators, 4 and microfluidic devices;5–7 as it can be used to process rigid substrates such as silicon wafers and soft polymers such as polydimethylsiloxane (PDMS), 7 nylon, 8 and polyethylene terephthalate (PET).9,10
Laser scribing typically produces V-shaped grooves with sharp tips. Grooves with high aspect ratios and sub-micron ablation precision can be achieved without heat damage near the scribed area, using a short-pulsed laser.9,11,12 Due to these geometric features, the grooves are regions of high mechanical stress/strain. They are therefore typically used to facilitate the cutting of various semiconductors13,14 or the detachment of films from the substrates. 15 In these cases, laser-scribed grooves serve only as processing elements, as they are only present during the fabrication process. Recently, laser-scribed grooves have been confirmed to serve as functional elements. For example, laser-scribed grooves on a PDMS microfluidic device were used as micro-channels to sample the size distributions of DNA samples. 7 Also, it was experimentally demonstrated that the multiple grooves on a PET film can enhance its local bending curvature without the significant loss of the mechanical resilience of the film. 16 The aim of this study was to develop a PET film with enhanced local flexibility, for a flexible device application. For certain scribing conditions, the PET film failed to return to its original shape after the bending test, mainly due to breakage or large plastic deformation at the tip of the scribed grooves, which can be attributed to the stress concentration.
The stress/strain analysis of the regions near the grooves is essential to ensure the mechanical stability of devices with functional grooves.17–19 However, the stress/strain near the groove tip was not analyzed; thus, the damage (e.g. plastic strain and fracture) at the tip was not quantified. Although there are many studies on notches (or grooves) that demonstrate their effect on the stress concentration factors (Kt: maximum stress of a sample with notches/nominal stress of the sample without the notches), the values cannot be directly applied to the sample for the prediction of the maximum stress. This is because Kt and the stress/strain around the notches are highly dependent on the geometries of the samples (e.g. plate and bar), type of loading (e.g. bending and tensile loading), and groove geometries (e.g. groove depth and tip radius).20–24 Given that the geometries of the laser-scribed grooves and samples were found to be different than those previously analyzed, a finite element analysis (FEA) on previous experiments was required to quantify Kt and the damage around the grooves. Moreover, the previous experiments examined only a limited number of scribing conditions, and the effect of the interval was not investigated; given that groove depths of 15, 25, and 40 μm were tested at fixed intervals of 100 μm. Thus, the local bending curvature obtained from the previous study was not optimized. 16
Therefore, to estimate the influence of the laser-scribed grooves on the stress/strain and to optimize the curvature of the scribed PET film, an FEA was conducted on the bending tests of PET films with multiple grooves. It was confirmed that the curvature obtained from the analysis was in good agreement with the results of the previous experiments. The maximum stress (Kt) on the films increased as the depth (d) and interval (Ls) increased and the number (N) decreased. The depth of the groove had the most significant influence on the curvature and the maximum stress. The optimization of the curvature was also performed by expanding the values of d and Ls. The optimized curvature of the film was found to be 2.6 mm−1 at d = 40 μm, Ls = 25 μm, and N = 7. Moreover, an empirical equation relating the bending curvature and the laser-scribing parameters was provided.
Materials and methods
Material properties of PET film
A tensile tester (Instron 3344) was used to obtain the mechanical properties of bare PET films (12 mm × 60 mm × 0.08 mm). Three samples were tested, according to the American Society for Testing and Materials (ASTM) D822 standard. 25 Figure 1 presents a representative stress–strain curve of a PET film from the test. The PET films had an elastic modulus of 2.62 GPa (±0.029 GPa) and an initial yield stress (σYS0) of 56 MPa, which were determined using a 0.2% offset line. The values were within the range of the values reported in the literature (yield strength: 40–85 MPa, elastic modulus: 1.1–3.9 GPa).26–28

Stress–strain curve of a PET film.
The nonlinear plastic stress after the initial yield stress can be expressed as

where εpe represents the plastic strain, and σharden(εpe) is a hardening function obtained by fitting the experimental results presented in Figure 1. Poisson ratio adopted from the literature was 0.37. 29 These basic mechanical properties and the plastic stress–strain relationship were used in the FEA of the PET films with grooves.
Laser-scribing and bending experiment conditions
Detailed conditions for the laser scribing and bending tests of the PET films were described in the previous article. 16 An ultraviolet (UV) picosecond laser (355 nm, 12 ps, Time-Bandwidth Inc) was used to scribe the PET films. Single or multiple lines (3, 7, and 13 lines) were scribed at the center of the top surface of each film by scanning the laser 10 times per each line at a scanning speed of 2 mm/s. The laser power was increased from 3–17 mW, to control the scribing depth. The depths used in the study were 15, 25, and 40 μm. As shown in Figure 2(a), the laser-scribed grooves were V-shaped with sharp tips.
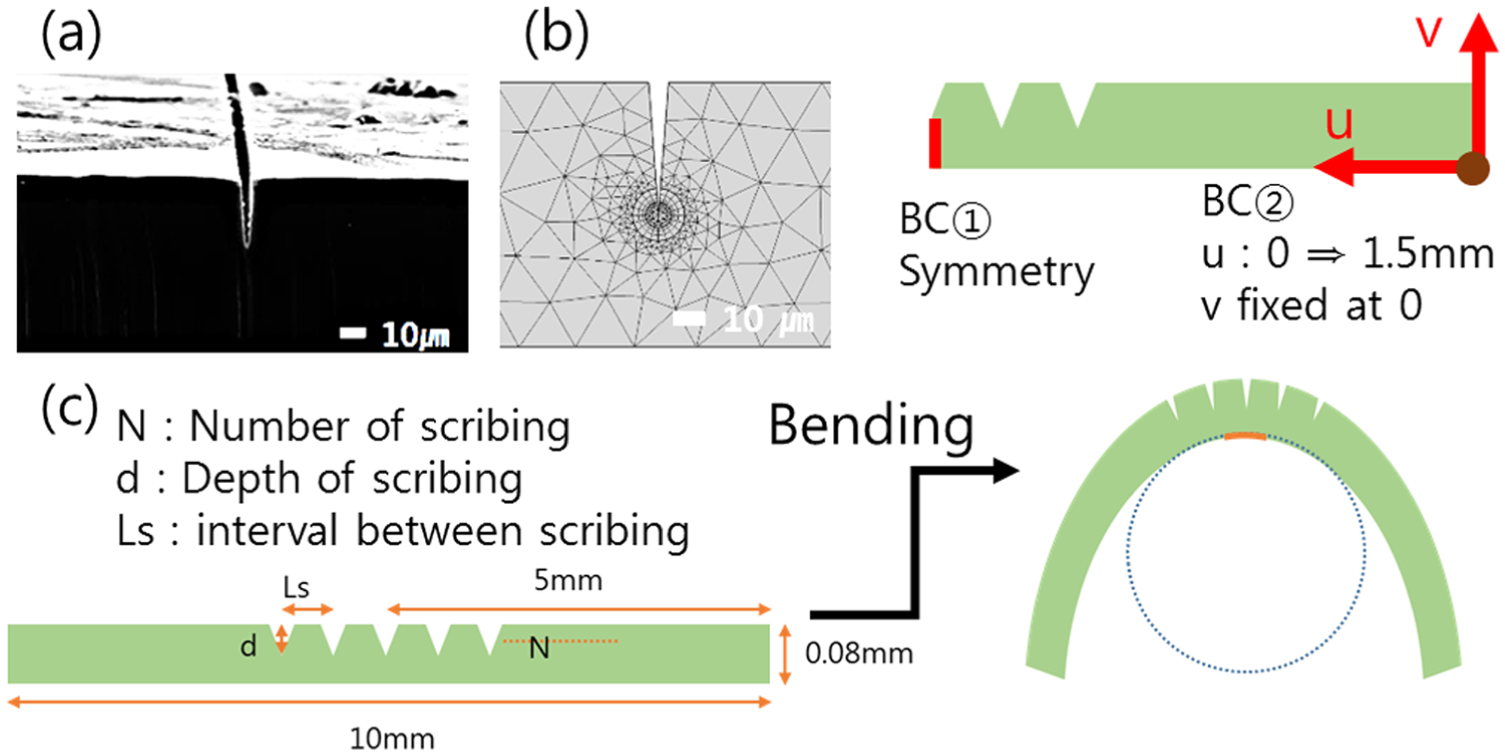
(a) SEM images of the laser-scribed PET films, displaying the V-shaped groove; 16 (b) mesh corresponding to the geometry and boundary conditions of the films used in this study; and (c) schematic diagram of the laser-scribed PET film, displaying three geometrical parameters (right) and its shape after bending (left).
After the scribing process, PET samples with dimensions of 10 mm × 2.5 mm × 0.08 mm were prepared for bending tests. For the tests, the PET samples were placed on L-shaped holders. One holder was displaced 3 mm horizontally to bend the PET sample, maintained for 0.3 s, and then returned to its original position. An optical microscope (Edmond Inc) was used to capture the images of the deformed PET films. The local curvature was then determined using ImageJ (National Institutes of Health). 30
FEA model and conditions
The finite element model was constructed and analyzed using COMSOL Multiphysics (version 5.2a). 31 To simulate the bending experiment, the scribed PET films were modeled under a two-dimensional (2D) plane strain condition, given that the sample width (2.5 mm) was larger than the thickness (≤0.08 mm). Most of the regions of the films were modeled using a six-node triangular element, as shown in Figure 2(b). The tips were modeled using a six-node triangular element and an eight-node 2D quadrilateral element. The mesh density at the tip of the groove was higher than those at the other regions, given that the refinement of the mesh at the highly stressed tip contributed to the accuracy of the analysis. The number of solid elements and nodes changed, depending on the scribing parameter, which ranged from 4400 to 22,800 and from 2200 to 11,400, respectively. Given that the PET films undergo plastic deformation, an isotropic linear-elastic material with isotropic hardening was used.32,33 A Monte Carlo solver in COMSOL was used to optimize the bending curvature. This solver uses a stochastic method to predict the probability of locating a global minimum within a defined region. 34 It does not require the topology of the objective function or its derivatives and can be applied to multidimensional functions. 35 In this study, the solver was set to randomly select the control variables d and Ls, within specified ranges and to calculate the corresponding curvature that satisfied the constraint variables of the maximum stress, plastic strain, and plastically deformed area divided by N. The range of d was 10–70 μm and that of Ls was 6–150 μm, for N = 7. At Ls = 6 μm, the adjacent grooves were connected, whereas at Ls > 150 μm, the corresponding curvature was very low. The significant dimensional parameters of the PET films used in the experiments and modeling are presented in Figure 2(c); namely, the number (N), depth (d), and intervals of the grooves (Ls). The parameters were varied to evaluate their effects on the changes in curvature and mechanical stability. The local curvature (orange line in Figure 2(c) at the lower center of the specimen) was obtained where the grooves were scribed, using ImageJ.
Results and discussion
Bending curvature as a function of the scribingdepth (d) and the number (N)
To verify the FEA model, the bending curvature of a scribed PET film obtained from the modeling was compared with those from the bending experiments with different values of N and d at Ls = 100 μm. Figure 3(a) presents the relationship between N and the curvature, at various d values. Accordingly, the experimental and FEA results confirmed that the local bending curvature near the grooves decreased with an increase in N, under all the conditions tested. This is due to the mitigation of the deformation at the center by the adjacent grooves, resulting in a decrease in the curvature. 16 For smaller d values (e.g. d = 15 μm), no significant change in the bending curvature was observed by an increase or decrease in N. For d = 25 or 40 μm, the curvature decreased with an increase in N. At d = 40 μm, the curvature obtained was the largest for all the numbers (N) tested. Also, the curvature decreased rapidly with an increase in N (Figure 3: the pink solid line and dotted line). It was difficult to find literature relating the groove (or notch) parameters to the curvature of the samples because the majority of studies were focused on obtaining or predicting Kt or the stress field near the grooves. Few studies revealed that nanotexturing could be used to control the bending curvature of silicon for flexible device applications.21,23 Although the curvature of the nanotextured silicon was higher than that of bare silicon, it was significantly lower (<0.1 mm−1) than that of the scribed samples used in this study (>1 mm−1), thus confirming the advantages of using the scribed polymer for flexible device applications.
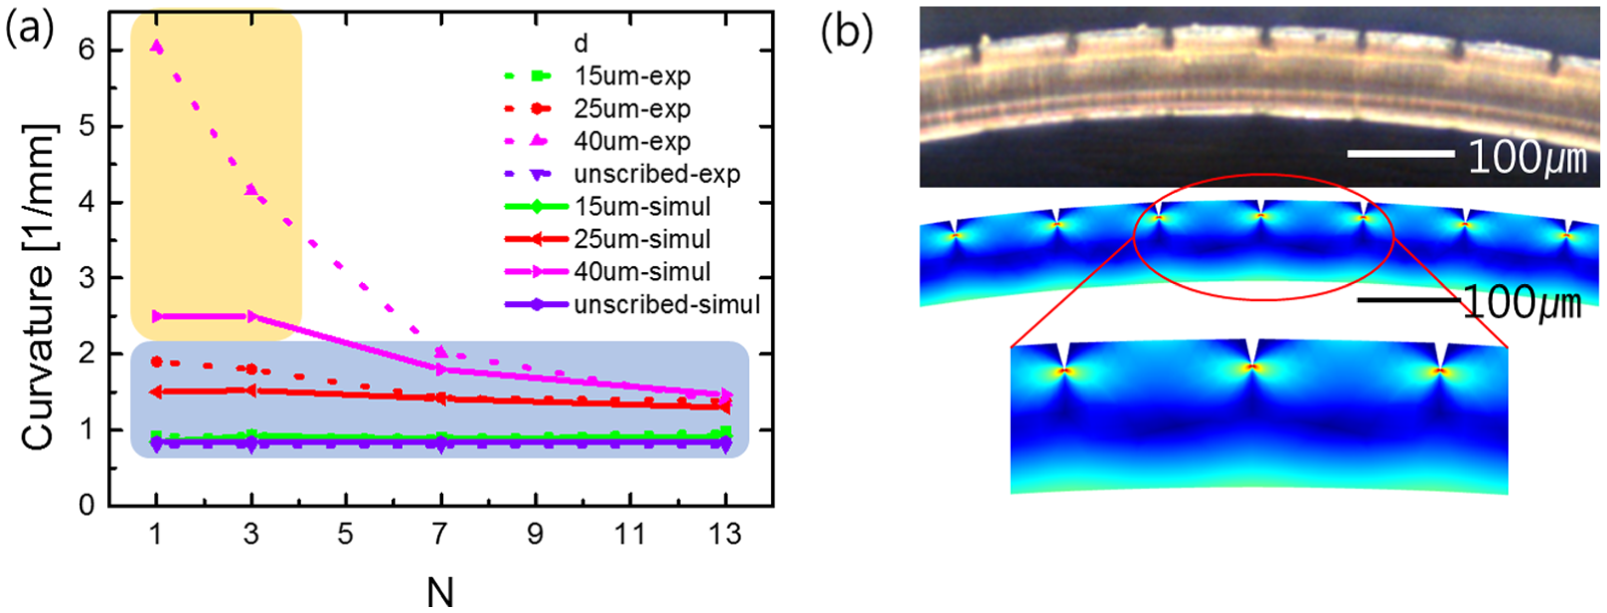
(a) Curvature of the PET films as a function of the scribing number (N) obtained from the experiment (exp) and simulation (simul) and (b) digital images of the films obtained from the bending experiment (top) and from the simulation (bottom).
In Figure 3(a), two colored regions can be seen. The blue region corresponds to the conditions (N, d) under which the films were mechanically stable (e.g. returned to their original flat shape after the test), whereas the orange region corresponds to the conditions under which the films underwent local failure (e.g. local fracture). The stress/strain analysis of the films in the blue region, which is discussed further on in the article, revealed that the maximum values of the stress, strain, and plastically strained area divided by N were 114 MPa, 0.373, and 0.474 mm2, respectively. In the blue region, the bending experiment and FEA modeling results were in good agreement, with the exception of N = 1 and 3. It is probable that the differences for N = 1 and 3 occurred because the simulation did not consider all the experimental conditions, such as the effects of the bending speed and creep on the deformation of the PET films. Therefore, local damages at the tips may have also occurred for the samples, resulting in higher curvatures in the experiments. Moreover, the differences were relatively small in the blue region (<15% at N = 3).
Significant differences were observed in the orange region. At N = 1 and 3, local fractures at the tips of the samples were present in the experiment; however, the FEA model did not consider this damage. The curvature results from the experiment and simulation were therefore different for these conditions (∼40% difference at N = 3). The fractures generally resulted in a sharp increase in the local bending curvature; thus, the curvature from the experimental results was higher than that predicted by the FEA model, for N = 1 and 3.
Film stress and deformation as a function of the number of scribing (N) and depth (d)
The stress and deformation due to the bending of the film were analyzed using FEA. It was confirmed that the stress was concentrated at the tip of the grooves upon which the maximum stress acted (Figure 4(a): the von Mises stress distribution). Also, a relatively high compressive stress was applied at the lower region of the grooves. The intensity of the concentration at the tip can be represented by the stress concentration factor Kt, which is expressed as 20

where (σS)max represents the maximum stress applied to the scribed PET film; and (σS)max represents the maximum stress (e.g. 38.86 MPa) applied to the pristine PET film, due to the bending.
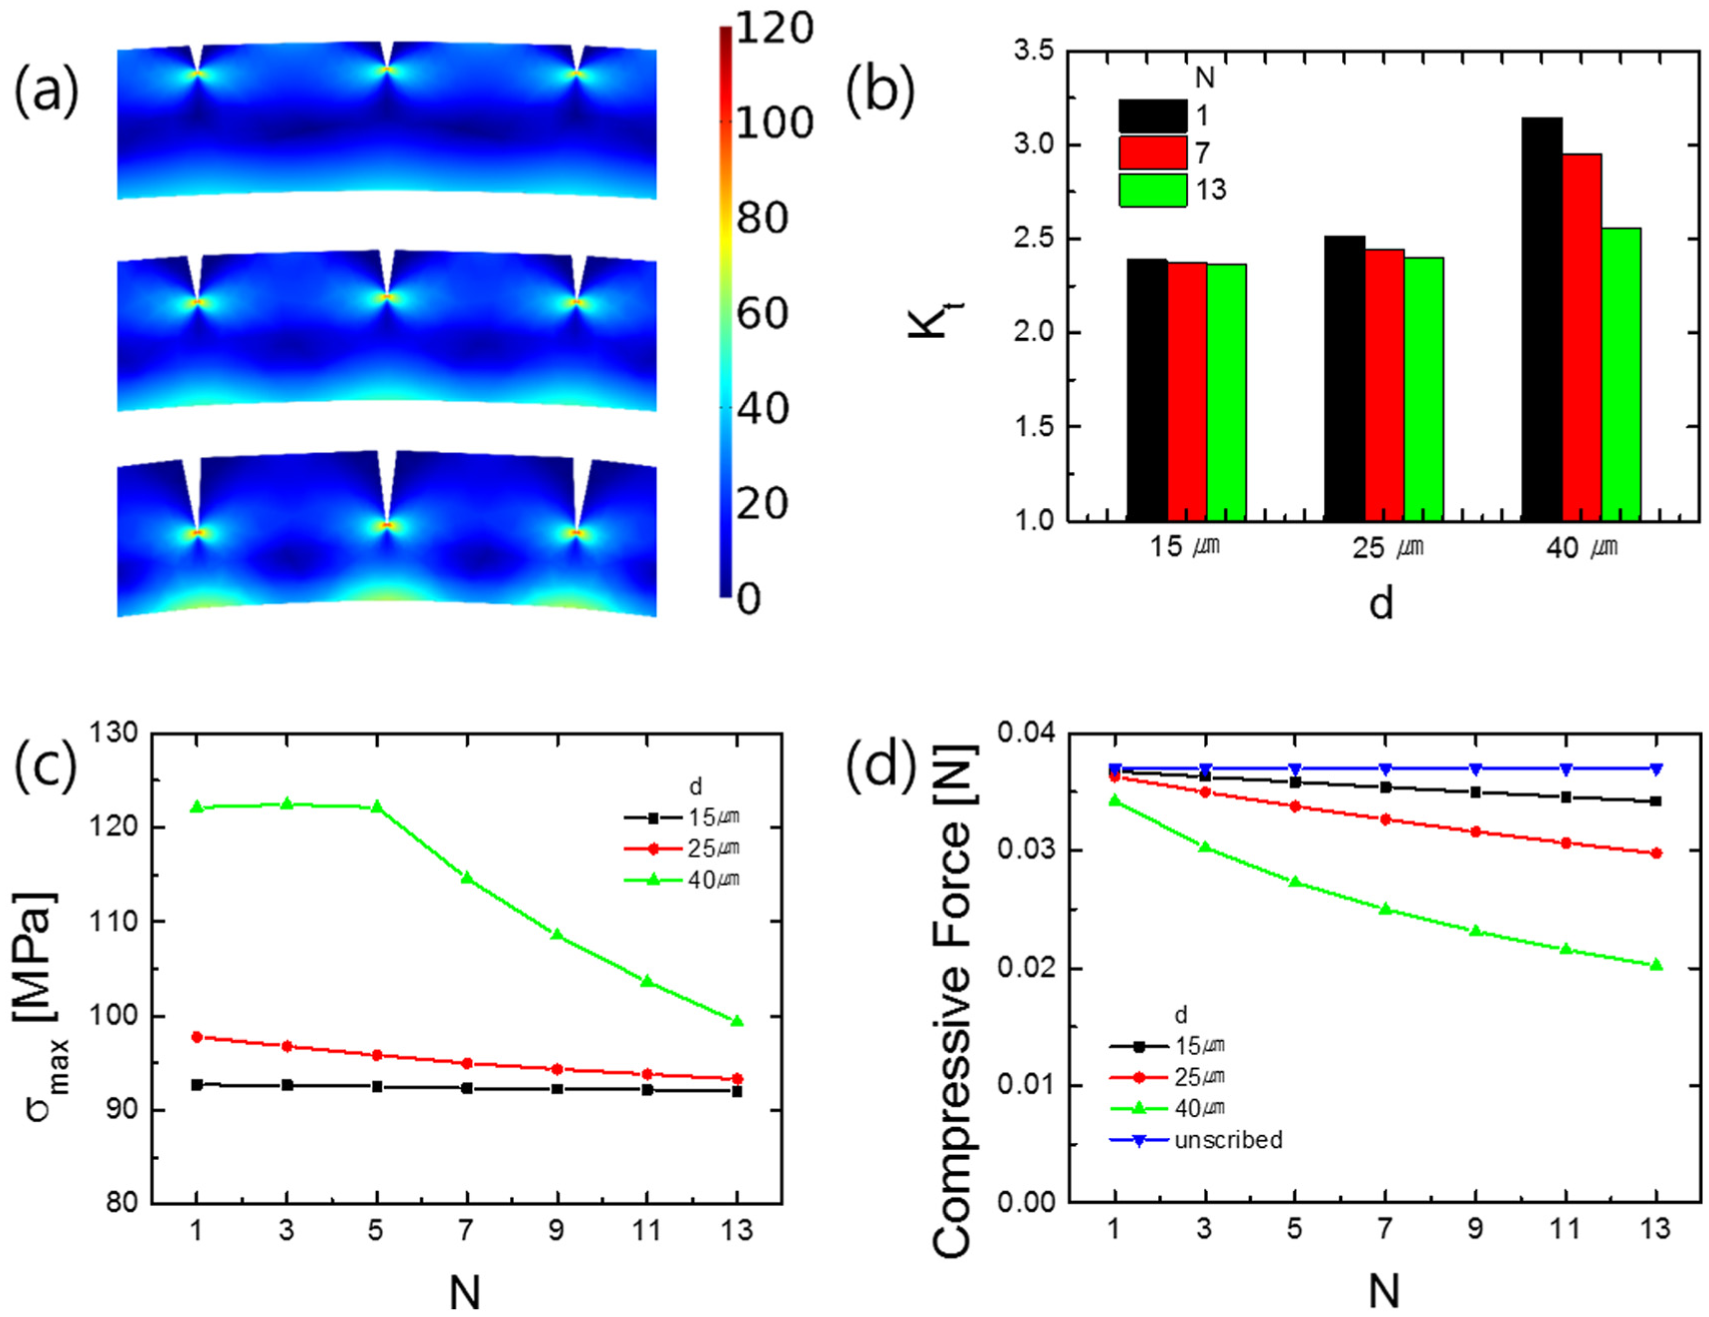
(a) Von Mises stress distribution; (b) stress concentration factor; (c) maximum stress; and (d) compressive force with respect to d and N.
Under all the conditions, the values of Kt were higher than unity, with a range of 2.37–3.14. This indicates that stress was concentrated at the groove tips for the PET films, under the given bending conditions. Figure 4(b) presents the relationship between Kt and the geometrical factors d and N. As d increased, Kt increased proportionally, thus indicating that deeper grooves are subjected to greater stress concentrations. However, for a fixed value of d, Kt decreased with an increase in N. This was mainly due to the distribution of the concentrated stress over an increased number of grooves. These trends are typical of a sample with grooves (or notches), regardless of the groove geometry and loading type.20,24 The degree of Kt reduction was found to be dependent on the depth of the grooves (d). For the films with shallow grooves (e.g. d = 15 and 25 μm), Kt decreased moderately; whereas, for films with deeper grooves (i.e. d = 40 μm), Kt decreased rapidly as N increased from 1–13. The results demonstrate that scribing deep grooves on a PET film can result in high stress concentrations and simultaneously enhance the effective distribution of the stress when the scribing number is increased.
Figure 4(c) presents the influence of d and N on the maximum stress. In the case of films with d = 40 μm, the maximum stress was relatively constant at ∼122 MPa, for N = 1–5. Moreover, the stress was close to the fracture strength of the PET film (122.8 MPa) obtained from the tensile test. It was found that the films corresponding to these conditions (N, d) had local fractures (or large plastic deformations) at the tips during the bending experiment (orange region in Figure 3(a)). Thus, the maximum stress from the FEA can be used as a measure of the mechanical failure of the films, which defines the mechanically unstable region.
Figure 4(d) presents the compressive force required to bend the PET films as a function of N and d. Generally, the force decreased with an increase in N and d, indicating that the PET films undergo deformation under less force, as the groove depth and number are increased. In comparison with the force required to bend a pristine PET film, the compressive force decreased by up to 7%, 18%, and 41% for films of N = 13, with d = 15, 25, and 40 μm, respectively. As expected, the samples with grooves required less force to bend, due to the stress concentration, as mentioned previously.
For the scribing conditions examined, the maximum film stress in the scribed PET films was higher than the yield strength of the pristine PET films (56 MPa). This illustrates that the bending test of the scribed films always resulted in plastic deformation in the films. However, the plastically deformed area was very small (less than 0.436% of the total area) and localized near the tips of the grooves. The plastic deformation regions near the scribed grooves are presented as brown regions in Figure 5. It is evident that the tensile plastic deformation occurred at the tips of the grooves for all the samples; whereas the compressive plastic deformation only occurred at the bottom region of the films, with d = 25 μm (for N = 3) and 40 μm (for all Ns). The results confirm the existence of the local plastically deformed area in the scribed films. In the previous experiments, when the scribing parameters N and d were within the blue region shown in Figure 3(a), the scribed PET films nearly returned to their original shape after the bending experiment. This can be attributed to the fact that the plastic zone was very small and the maximum strain at the tip was smaller than the strain at the fracture.

Plastically deformed area of the center groove with respect to d and N.
Influence of scribing interval (Ls) on the curvature, stress, and strain
Depending on the value of Ls, the stress/strain profiles near the grooves were expected to vary, given that a decrease in Ls increased the number of the grooves near the center of the specimen. The higher groove density increased the degree of local deformation at the center, thus increasing the local bending curvature.
To investigate the influence of Ls on the curvature and stress/strain, these profiles were measured with Ls ranging from 25–100 μm. As shown in Figure 6(a) and (b), the curvature of the films with d = 15 or 25 μm was not affected by changing Ls; whereas a significant increase was observed for those with d = 40 μm, with a decrease in Ls. For example, as Ls decreased from 100 to 25 μm, the curvature was relatively constant at ∼0.92 for films with d = 15 μm. However, it increased by 67% (from 1.47 to 2.46) for films with d = 40 μm (yellow arrow in Figure 6(b)).

Curvature variation as a function of N and Ls for (a) d = 15 and (b) d = 40 μm; (c) stress concentration factor with respect to d and Ls for N = 13; and (d) plastically deformed area with the stress intensity as a function of Ls, for d = 15 and 40 μm.
Similarly, the maximum film stress was also found to be less dependent on the variation in the scribing interval (Ls) when d was small. Thus, the stress concentration factor (Kt) increased slightly (∼4.1%) with an increase in Ls, for small d values (see Figure 6(c)). Although the geometry of the sample/groove was different, the same trend was observed for U-shaped notches on a thin plate. 20 In contrast, in the case of large d values (e.g. d = 40 μm), it was found that Kt decreased with an increase in Ls. To investigate this discrepancy, the stress distribution neighboring the grooves was investigated as a function of d and Ls. The colored area in Figure 6(d), excluding the blue area, represents the plastically deformed area near the grooves, and the magnitude of the corresponding stress is presented by different colors. All the samples with d = 15 μm had a disconnected plastic region for each groove, and the maximum stress increased from 88.4 to 92.0 MPa with an increase in Ls from 25 to 100 μm. However, the films with d = 40 μm had a continuous plastic region at Ls = 25 μm, given that the individual plastic region of each groove overlapped. As Ls increased to 50 or 100 μm, this region became disconnected, and the maximum stress was found to decrease from 104.1 to 101.6 MPa, along with Kt. The results confirm that the presence of the overlapping high-stress region has an influence on the interval dependency of Kt (Table 1).
Maximum stress and Kt as a function of Ls and d for N = 13.

Optimization of curvature
Various d and Ls values were evaluated to further optimize the bending curvature using the Monte Carlo method. For this optimization process, N = 7 was used, as it was found to be an optimal number. At N < 7, the maximum stress increased rapidly; whereas at N > 7, the bending curvature was not as high. The constraints for the optimization were based on the maximum values of the stress, plastic strain, and plastically deformed area divided by N, corresponding to the films with good mechanical resilience (blue region in Figure 3); with the stress <114 MPa, plastic strain <0.373, and plastic strain area divided by N < 0.474 mm2, respectively.
Figure 7 presents a three-dimensional (3D) plot of the curvature as a function of Ls and d. As expected, it can be seen that the curvature decreased with a decrease in Ls and d. The optimization results revealed that the following conditions are required to satisfy the stress/strain constraints: maximum d ≤ 40 μm and maximum Ls ≤ 25 μm. The optimal curvature value obtained was 2.6 mm−1 at d = 40 and Ls = 25 μm. The curvature is related to the scribing parameters by the empirical equation based on fitting the data shown in Figure 7
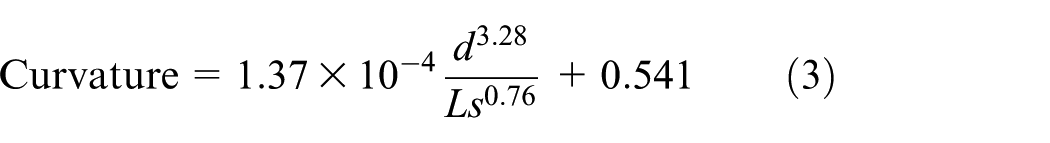
where the unit of curvature is mm−1. The difference between the curvature value obtained using this equation and that obtained by the simulation was 3% at average and less than 11% at maximum, for curvature values higher than 1.1 mm−1.

Curvature variation as a function of d and LS, for N = 7.
Conclusion
The FEA of a scribed PET film was conducted to optimize its bending curvature while minimizing the mechanical instability. The scribing parameters—the depth (d), number (N), and interval (Ls) of the scribed grooves were controlled to evaluate their influence on the curvature and stability. The bending curvature was found to increase with an increase in the depth (d) and decrease with an increase in the number (N) and interval (Ls) of the grooves. The depth (d) was found to be the most significant factor with respect to the curvature and the maximum stress. The optimized curvature was found to be 2.6 mm−1 at d = 40 and Ls = 25 μm. In general, the analysis results were in good agreement with the previous experimental results for the scribed films. Importantly, an empirical equation relating the bending curvature to the laser-scribing parameters was suggested. The analysis results may be useful in the design of laser-scribed grooves, especially for flexible device applications, wherein the grooves are intended for the enhancement of the bending curvature.
Footnotes
Acknowledgements
D.W.H. conducted the simulations and analyses, M.G.K. provided the experimental results, H.L. supervised the experiments, and S.Y.K. developed the idea and was the general supervisor.
Handling Editor: Shun-Peng Zhu
Declaration of conflicting interests
The author(s) declared no potential conflicts of interest with respect to the research, authorship, and/or publication of this article.
Funding
The author(s) disclosed receipt of the following financial support for the research, authorship, and/or publication of this article: This work was supported by the Basic Science Research Program of the National Research Foundation of Korea (NRF), funded by the Ministry of Education (grant no.: 2017R1D1A1B03034716) and Ministry of Science and ICT (grant no.: 2016H1D5A1910726).