
Abstract
For four-wheel independently driven in-wheel motor electric vehicles, the four-wheel drive/braking torque can be controlled independently. Therefore, it has an advantage that energy saving control can be applied effectively. This article studies several energy saving control methods from two levels of driving and braking for four-wheel independently driven in-wheel motor electric vehicles under urban conditions based on the motor efficiency map. First, the energy saving control logic and the evaluation index were proposed in the article. The four-wheel drive torque was online optimized in real time through drive energy saving control, in order to improve the driving efficiency in the driving process of electric vehicles. According to the theory of ideal braking force distribution and Economic Commission of Europe braking regulations, the parallel regenerative braking control method based on the motor efficiency map was then studied. The parallel regenerative braking control method was applied to four-wheel independently driven in-wheel motor electric vehicles. The simulation analysis under typical urban driving cycle conditions was carried out to determine the braking intensity of the parallel brake front axle separate regenerative braking, and finally the braking energy recovery rate of electric vehicle can be improved in the low speed and low braking torque. Finally, simulation experiments have been carried out to verify the researched method under the NEDC, UDDS, and J1015 urban driving cycles. The simulation results show that the energy saving control methods have an obvious effect on energy saving under the urban driving cycle conditions.
Introduction
In urban driving, drivers tend to accelerate and brake vehicles frequently. He et al. 1 developed an analytical model to investigate the dynamic characteristics of powertrain systems in the process of variable-speed vehicles; it has some guidance for using transmission and differential vehicle drive system development. However, the electric vehicles with four-wheel independently driven in-wheel motors cancel the mechanical parts such as the transmission and the differential gears, and the four-wheel driving torque and braking torque can be controlled independently. For a four-wheel independently driven in-wheel motor electric vehicle, its stability and energy saving performance can be controlled through adjusting drive and braking torque at each wheel. He et al. 2 proposed a robot control design method, which sheds some light on the four-wheel independently driven in-wheel motor electric vehicle controller design and vehicle motion tracking control. Under the premise of ensuring the target vehicle speed, energy saving control during driving and braking can be achieved through the reasonable distribution of drive torque and braking torque. Energy saving control for electric vehicle is of great significance for increasing drive mileage.
At present, the regenerative braking technology of electric vehicle is fairly mature, and it has been used in the mass production vehicles such as the Toyota Prius HEV (Hybrid Electric Vehicle), Nissan leaf BEV (Blade Electric Vehicle), and so on. In the theory study of regenerative braking, three kinds of classic regenerative braking force distribution strategy were put forward by Y Gao et al., 3 Texas A&M University (USA), in the late 1990s. Then, Y Gao et al. 4 put forward regenerative braking control method in electric vehicles with considering Anti-locked Braking System (ABS) and proposed the control strategy to maximize the efficiency of regenerative braking. J Lee, in the University of Virginia (USA), has studied the effect of the rotational inertia on regenerative braking through the simulation analysis of the simulation model in two-wheel drive and four-wheel drive electric vehicles, concluding that reducing inertia loss of rotating components can be used to improve the recovery rate in regenerative braking energy from 8% to 13%. 5 Sun et al. 6 propose an adaptive cruise control algorithm for braking energy recovery. A genetic algorithm was used to optimize the recovery of braking energy. The simulation results show that the braking energy recovery rate can reach above 43.65%.
A lot of colleges and universities in China such as Jilin University, 7 Tsinghua University, 8 Wuhan University of Science and Technology, 9 Jiangsu University, 10 Beijing Institute of Technology (Public University), 11 and Harbin Industrial University 12 have studied the control method of regenerative braking under the premise that vehicle stability is ensured.
Although regenerative braking control for energy saving is mainly used on HEV and pure electric vehicles with a single motor centralized, energy saving control on several wheels of independently driven in-wheel motor electric vehicles can be implemented through optimizing the distribution of drive/brake torque of different wheels. For the influence of front and rear wheel drive/braking torque distribution on steering performance of multi-wheel independently driven electric vehicles, the professor Y Hori of the University of Tokyo has conducted a deep study.13,14 This article mainly studies the energy saving control of four-wheel independently driven electric vehicles under straight-line driving conditions, and the influence of front-rear braking force distribution on steering performance is not taken into account.
For several wheels independently driven electric vehicle, the Ohio State University in America proposed a global optimization for energy saving control allocation algorithm of over perform Systems based on a carol to Kuhn–Tucker (KT) conditions, and took two-wheel in-wheel motor electric vehicle model as an example, to verify this energy saving control distribution algorithm under two kinds of modes—one with only drive and the other with both drive and regenerative braking, compared with traditional control allocation algorithm, it has superiority in the aspect of energy saving. 15 The Ohio State University also proposed that the nonlinear model predictive control method can be used for regenerative braking torque control allocation on the in-wheel motor electric vehicle. The simulation results show that this control algorithm can better increase the energy recovery compared with traditional Proportion-Integration (PI) control under the condition that it does not affect the vehicle speed. 16 For four-wheel drive electric vehicle, Tongji University has identified the objective function and constraint conditions for the drive energy using efficiency and the braking energy recovery rate, respectively, in the driving process of the electric vehicles. And the torque distribution coefficient was optimized by using numerical method. Simulation studies verified that the use of optimal control in torque distribution can improve system economic efficiency under various driving cycles. 17 Tsinghua University put forward economy driving force distribution pattern under the security constraints of four-wheel drive electric vehicle, established the mathematical model based on nonlinear control allocation, and determined the objective function and constraint conditions in order to realize the highest efficiency for the drive motor. The sequential quadratic programming method was adopted to solve the objective function so as to ensure that the vehicle has the best economic performance under safe driving state. 18 The Chinese University of Hong Kong developed a four-wheel drive electric vehicle, and put forward an energy management strategy for optimizing the allocation of driving moment, which is based on the motor efficiency map. 19 The policy established the objective function, constraint conditions, and numerical solution, and the method was verified through simulation experiment under the working condition of driving cycle. The simulation results show that, on the basis of keeping drive performance, the total input power of the four motors reduced, and the motor utilization efficiency was improved. Zheng et al. 20 studied regenerative braking force distribution of both two-wheel drive and four-wheel drive electric vehicles based on Economic Commission of Europe (ECE) regulation, to realize maximum energy recovery, but the recovery efficiency of motor was average. Fujimoto and Harada 21 propose a model-based range extension control system for electric vehicles, which optimizes the front and rear driving-braking force distributions by considering the slip ratio of the wheels and the motor loss. The effectiveness of the proposed system was verified through field and bench tests.
The optimal control of torque was used to equate the driving torque and braking torque, while, for the braking torque control, it is mainly from the perspective of maximum energy recovery to realize the optimal allocation of braking torque, without considering the ideal braking force distribution theory and the ECE regulations. In fact, in the process of torque optimization, the braking force distribution value would exceed the ideal on quite frequently, and sometimes even exceed the limit value according to ECE regulation, which will cause the vehicle to lose stability during braking. In addition, according to some existing literature, the majority of regenerative braking methods only take into consideration the average efficiency of a motor; however, in fact, the motor could have different efficiency for regenerative braking and the efficiency may vary largely indifferent rotation speeds and torques.
Since the drive/braking torque can be controlled independently in the four-wheel independently driven in-wheel motor electric vehicles, four-wheel independently driven in-wheel motor electric vehicles have advantages that energy saving control can be applied effectively. In this article, an energy saving control method is proposed based on motor efficiency maps. The efficiency functions and constraint conditions were established, and sequential quadratic programming method was used to distribute four-wheel drive torques. The drive force distribution coefficient table was obtained through offline calculation and is then stored in the controller to facilitate the real-time adjustment for a vehicle. A parallel regenerative braking control method was designed, and the working strength of the front axle alone was determined through a typical working condition simulation test. The parallel regenerative braking control method is capable of improving the electric vehicle braking energy recovery rate at low speed and under small braking torque demand. In general, the proposed energy saving control method was simple and easy, and the energy saving effect was obvious.
Four in-wheel motors electric vehicle dynamics modeling
The overall structure of the four in-wheel motors vehicle dynamics model is shown in Figure 1. The model can be divided into different subsystem models according to their individual functionalities. The overall model consists of the driver model, the steering system model, the motor drive system model, the brake system model, the wheel dynamics module, and the vehicle body dynamics module. The overall model represents 15 degrees of freedom. These include 6 degrees of freedom of the vehicle body movement, that is, longitudinal, lateral, vertical, pitch, yaw, and roll; 4 degrees of freedom of wheel rotation; 4 degrees of freedom of wheel vertical movement; and finally 1 degrees of freedom of front wheel.

Vehicle dynamics model: overall structure diagram.
The dynamics equations of the 6 degrees of freedom of vehicle body movement are listed as below

The equation of single-wheel independent suspension unsprung mass vertical beating is listed as below

The equation of wheel motion balance is listed as below

The equation of force of suspension on sprung mass is listed as below

The equations of suspension and body connection point absolute position are listed as below

where m is the total mass of the vehicle, ms is the mass of the sprung mass, mui is the mass of the wheel unsprung mass, a is the distance from the center of mass to the front axle, b is the distance from the centroid to the rear axle, w is the track pitch, r is the wheel rolling radius, hr is the distance from the center of mass to the roll axis, hp is the distance from the center of mass to the pitch axis, Jθ is the pitch moment of inertia, Jφ is the moment of inertia of roll, Jγ is the moment of inertia of the yaw, z is the centroid height of the sprung mass of the car, zi is the height of the body and suspension connection point, θ is the pitch angle, φ is the roll angle, γ is the yaw rate, Vx is the vehicle longitudinal speed, Vy is the vehicle lateral speed, Vz is the sprung mass centroid vertical velocity, ksi is the suspension stiffness, bsi is the suspension damping, kui is the tire vertical stiffness, Fyi is a lateral tire force, Fxi is the vertical tire force, FSi is the suspension force, Txi is the wheel drive torque, Tbi is the wheel brake torque, Mf is the tire rolling resistance, g is the acceleration of gravity, and ωwi is the wheel speed.
The driver model’s input signal is the centroid longitudinal vehicle speed, and its output signals are accelerator pedal opening, brake pedal opening, and steering wheel angle.
The steering system model is based on the steering system’s basic steering ratio, with the effect of the tires aligning torque being taken into account. The relationship between the front wheel angle δ and the steering wheel angle input

Here,
The efficiency model is used in the motor model, and the efficiency diagram is stored in the controller in the form of a table. The efficiency of the motor is used to calculate the energy change during the simulation.
The lithium battery model in MATLAB/Simulink software was used as battery model.
Discharge formula (

Charging formula (
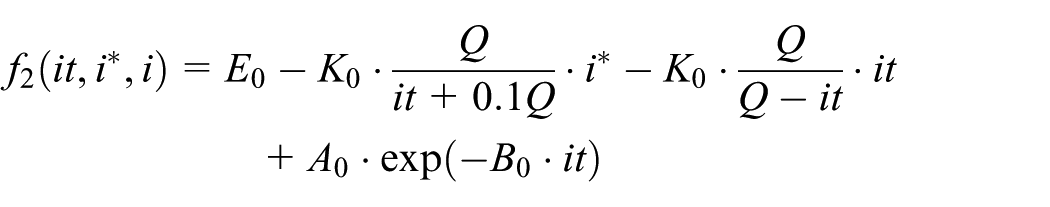
where
State of Charge (SOC) is the battery charge state, which is used to indicate the remaining capacity of the battery, and it is the ratio of the remaining capacity of the battery and the total capacity. The formula is as follows

where
In this article, “magic formula” tire model, Pacejka 2002, is used for dynamic simulation analysis. Key parameters of the model are shown in Table 1.
The main parameters.

Method of energy saving control
The motor efficiency map is shown in Figure 2; when the motor operates in low speed and small torque, the motor efficiency is lower. When the motor operates in the range of middle or low speed, the motor efficiency first increases and then decreases with the increase of motor torque under the same speed. Therefore, to make the motor working in high efficiency area as much as possible is necessary.

The motor efficiency map.
Figure 3 describes the logic of energy saving control. In driving conditions, each of the four wheels’ drive torque can be calculated in real time by the drive energy saving controller on the basis of driver’s requirements for drive torque and current motor speed, which can be set to meet the highest drive efficiency. And the calculated drive torque is applied to vehicle. In braking conditions, regenerative braking torque and friction braking torque of four wheels can be distributed reasonably by the regenerative braking controller, and the calculated braking torque is applied to vehicle to realize energy recovery as much as possible.
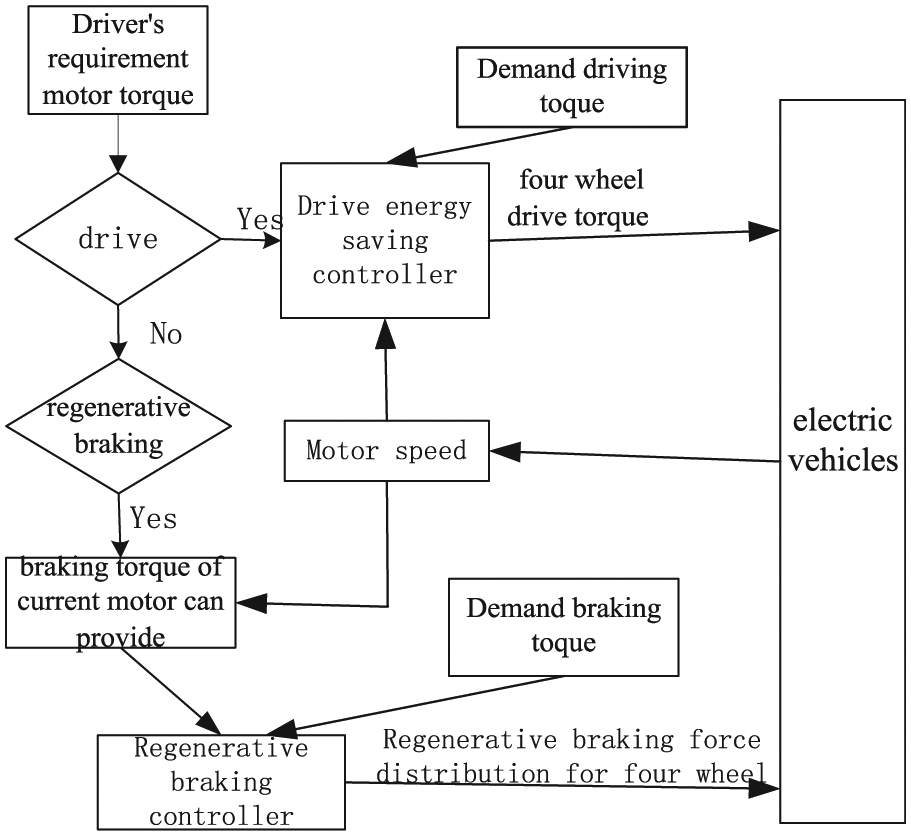
Logic of energy saving control.
Energy saving evaluation index
In order to evaluate the effectiveness of the energy saving control method, the energy conservation evaluation indexes have been determined by drive efficiency, braking energy recovery efficiency, and energy saving efficiency .
Drive efficiency
Drive efficiency is the ratio of the energy
Braking energy recovery efficiency
Braking energy recovery efficiency
Energy saving efficiency
Energy saving efficiency
Drive energy saving control method
From the motor efficiency map, it can be concluded that the motor efficiency is low at low rotation speed and small torque. The motor efficiency is high under the middle or high speed and large torque. The efficiency will be higher when the torque is larger under the same speed. For the four-wheel independently driven in-wheel motor electric vehicles, the drive torque of the front and rear axles can be arbitrarily distributed. Under the premise of its drive demand, the drive torques of front and rear shafts were reasonably distributed to make the motors work in the high efficiency areas to increase travel distance and to decrease electrical energy loss. In addition, the effect of tire slip power losses is negligible with respect to the electric drivetrain power losses. Since electric vehicles are mainly working in city conditions, in order to reduce the amount of calculation and achieve a good real-time performance for online optimization calculation, it is assumed in this article that the drive torque of coaxial side wheels is equal.
In this article, the objective function for drive energy saving control method is as follows

The objective function is the ratio of the sum of power actually consumed by the front and rear axle motors to the power required for the electric vehicle to travel. The objective function is minimized subject to the constraints so as to achieve the drive-saving control. The constraints condition is as follows

where
Figure 4 illustrates the logic flow of drive energy saving control.
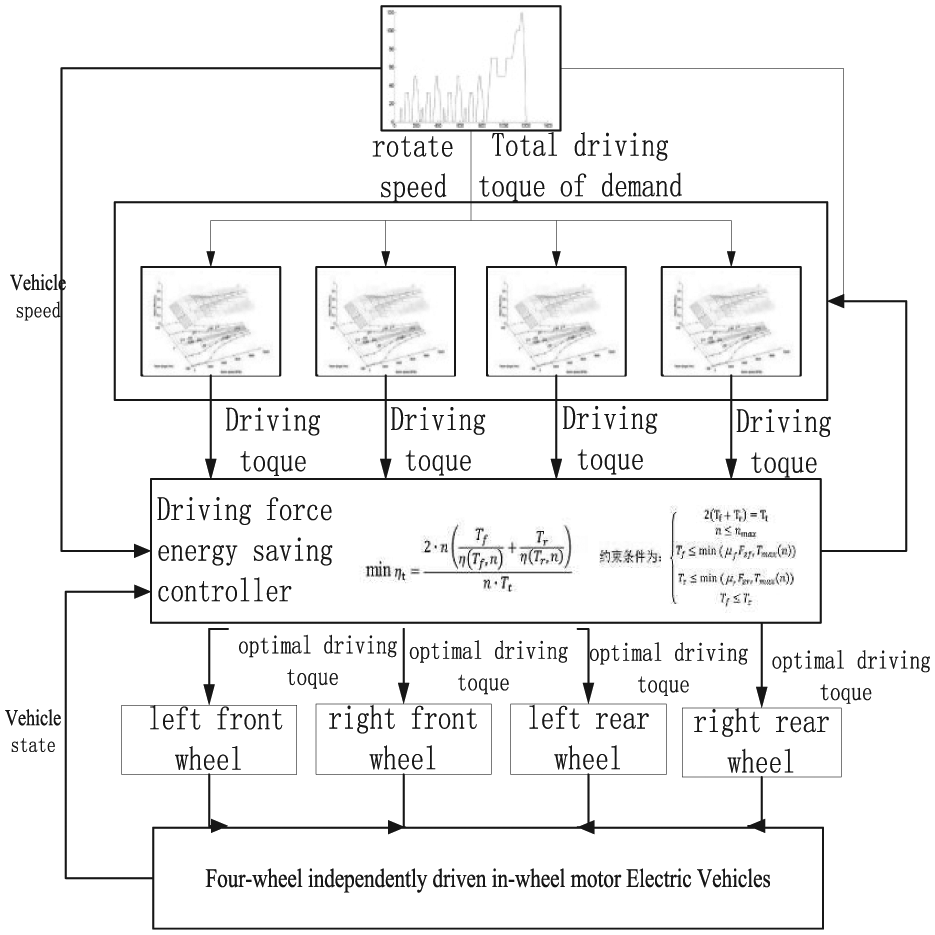
Drive energy saving control logic flow.
It can be seen from Figure 4 that the efficiency table of the drive motor is stored in the controller. The controller in real time optimizes four-wheel drive torque to make the total drive efficiency of the four motors highest according to the objective function. The sequence quadratic programming method was adopted to solve the objective function. Considering the driving safety, hence, the driving force distribution coefficient of front and rear axles under different speed and total demand driving torque can be offline calculated. And the coefficient table was formed to store in the controller, which can greatly reduce online optimization burden workload and thus could lead to better real-time performance.
The regenerative braking control method
In most of existing literature, electric vehicle’s regenerative braking control is applied to front axle drive electric vehicle. When the front and rear braking force distribution strategy was proposed, the braking force should be distributed to the front axle as much as possible, in order to improve braking energy recovery effect. The most classic distribution methods include the ideal braking force distribution, the best energy recovery braking force distribution, which is based on ECE regulation and parallel brake force distribution.22–25
The ideal braking force distribution theory of front and rear axles and ECE regulations are taken in consideration, and the characteristics that four-wheel in-wheel motors could proceed two-wheel or four-wheel multi-modal regenerative braking is used fully, finally the regenerative braking force distribution method was developed which is suitable for four-wheel in-wheel motor electric vehicle based on the motor efficiency map. Under the premise that braking stability is ensured and control method is feasible, the braking energy can be recovered as much as possible.
Fixed-ratio regenerative braking control method
Because the braking energy recovery can be carried out by both front and rear axles for four-wheel in-wheel motors electric vehicles, the fixed-ratio braking force allocation method can be used. Under the premise that the braking stability is ensured, both front and rear axle motor can have energy recovery. When the braking force distribution was determined, the distribution curve should be close to the ideal braking force distribution curve as much as possible, and the braking stability should be ensured. The road adhesion coefficient of Chinese urban is generally between 0.7 and 0.9. Regenerative braking of electric vehicle is mainly used in city driving cycles, brake intensity of city driving cycles is generally not more than 0.35, and a handful of braking intensity can reach 0.6. In fact, if the braking intensity is more than 0.5, the passengers prone to feel uncomfortable and be injured. Therefore, braking energy recovery of the electric vehicle is concentrated within the braking intensity range between 0 and 0.6. In order to ensure braking safety, the friction brake was fully adopted without energy recovery when the intensity of the fixed-ratio regeneration brake is more than 0.6. Regenerative braking force distribution curve is shown in Figure 5. When z ≤ 0.6, braking forces of front and rear axles are distributed in accordance with the BC segment. When z > 0.6, braking forces of front and rear axles are distributed in accordance with the CD segment, and the friction brake was completely used at this moment. The numerical value of point H on the horizontal axis stands for the maximum braking torque produced by the motor of front axle.

Fixed ratio of regenerative braking force distribution curve.
Figure 6 shows the control logic of fixed ratio of regenerative braking.

Fixed-ratio regenerative braking control logic.
As shown in Figure 6, the control mode is judged by the driver’s demanded braking force, the braking intensity, the current vehicle speed, and the condition of battery SOC. If the vehicle speed is lower than the control threshold value or the battery SOC is greater than 0.8, then friction brake is executed. If the vehicle speed is higher than the control threshold value or the battery SOC is less than 0.8, the braking intensity is used to judge the vehicle is emergency braking or mild braking. If the braking intensity is more than 0.6, it is emergency braking mode, without energy recovery, and use the friction braking and ABS control. Otherwise, use the regenerative braking control. From the view of control implementation, this method is easy to implement comparing to the ideal braking force distribution, and it can ensure good braking stability.
Parallel braking regenerative braking control method
From the motor efficiency map, it can be seen that the motor working efficiency is low under low speed and small torque. The fixed-ratio regenerative braking method does not take this feature into consideration. To this end, the parallel braking regenerative braking method is proposed in order to improve recovery rate of regenerative braking. When the braking intensity is small, regenerative braking is only applied to the front axle According to the ECE regulation, when the front axle brakes individually, the front axle brake force should not exceed the regulated limit. As shown in Figure 7, when the braking intensity is less than ZE, safe driving of the vehicle can be ensured. But the braking intensity ZE is not necessarily the braking intensity at which most regenerative braking energy of front axle can be recycled. So we need to find the braking intensity at which most braking energy can be recycled; such a braking intensity is denoted as ZA. When z ≤ ZA (ZA ≤ ZE), use the front axle regenerative braking method. When z > ZA and z ≤ 0.6, braking forces of front and rear axles are allocated in accordance with the FC segment, and the front and rear axles both proceed regenerative braking. When z > 0.6, braking forces of front and rear axles are allocated in accordance with the CD segment, and the friction brake is completely applied in this case. The numerical value of point H on the horizontal axis stands for the maximum braking torque produced by the motor of front axle.

Parallel braking regenerative braking force distribution curve.
Figure 8 illustrates the control logic of parallel braking regenerative braking. It can be seen that the control mode is judged by the driver’s demanded braking force, the braking intensity, the current vehicle speed, and the condition of battery SOC. If the vehicle speed is lower than the control threshold value or the battery SOC is greater than 0.8, then friction brake is executed. If the vehicle speed is higher than the control threshold value or the battery SOC is less than 0.8, the braking intensity is used to judge that the vehicle is emergency braking or mild braking. If the brake intensity is more than 0.6, it is emergency braking mode, and the friction braking and ABS control are used without energy recovery. Otherwise, the regenerative braking control will be used. When the brake intensity is less than or equal to ZA, regenerative braking is applied only to the front axle; otherwise, the regenerative braking is applied to both front and rear axles. Compared to a fixed-ratio regenerative braking method, the parallel regenerative braking method takes the problem of the motor efficiency in low speed and small torque into account, and improves braking energy recovery rate through the front axle for regenerative braking, but the size of ZA value should be determined reasonably.
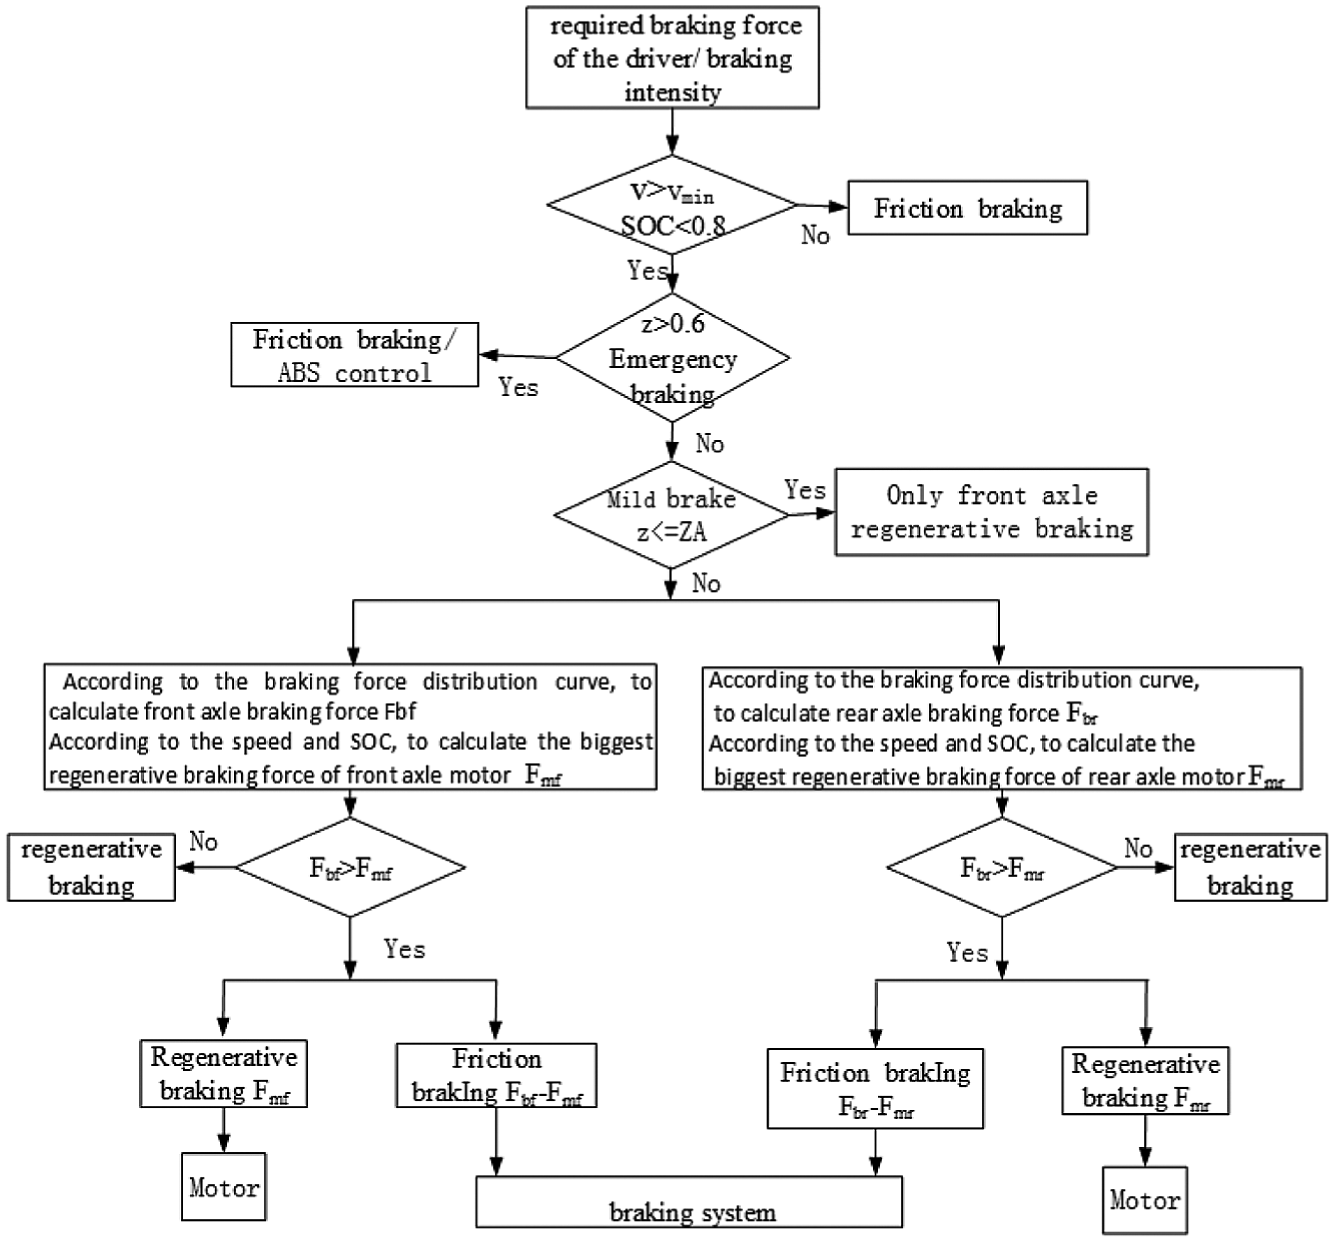
Parallel braking regenerative braking control logic.
The effectiveness of the parallel braking is largely influenced by the ZA value. In most existing literature, the ZA value for parallel braking method is set around 0.1. In this article, in order for maximum braking energy recycling under the premise of electric vehicle braking safety, and based on the motor efficiency map, a reasonable value of ZA for the goal of motor regenerative braking energy recovery rate maximization is determined. Because the regenerative braking is mainly used in city driving cycles, typical urban driving cycles are selected for simulation to determine reasonable ZA values. Three typical urban driving cycles, that is, NEDC, UDDS, and J1015, are selected for simulation analysis.
Results of different driving cycles
The NEDC urban driving cycle
The European NEDC is a new European driving cycle. It consists of four ECE working conditions and one Extra Urban Driving Cycle (EUDC) working condition. It is used as city cyclic test conditions of the vehicle in China, and it is one of the typical working conditions for the current electric vehicle test (Table 2).
Data of NEDC driving cycle.

The UDDS urban driving cycle
The American UDDS city driving cycles is a circulation condition, in which the average speed is higher. It is the typical transient operating condition (Table 3).
Data of UDDS driving cycle.

The J1015 urban driving cycle
The J1015 driving cycle is a low speed city cycle. It is suitable for testing pure electric vehicle under city driving, and it is also widely used for testing regenerative braking performance under low speed driving conditions (Table 4) .
Data of J1015 city driving cycle.

Simulation results over these three driving cycles are summarized and presented in Table 5 and Figure 9. The NEDC and J1015 driving cycles are found to give the highest brake recycling rate when ZA = 0.08. Under UDDS city driving cycle, it is found that the braking recovery rate under ZA = 0.07 is only 0.01% higher than that under ZA = 0.08. Considering simulation outcomes under all these three driving cycles, we selected ZA = 0.08, which in general leads to the largest braking energy recovery rate.
Braking recovery rate under different ZA.

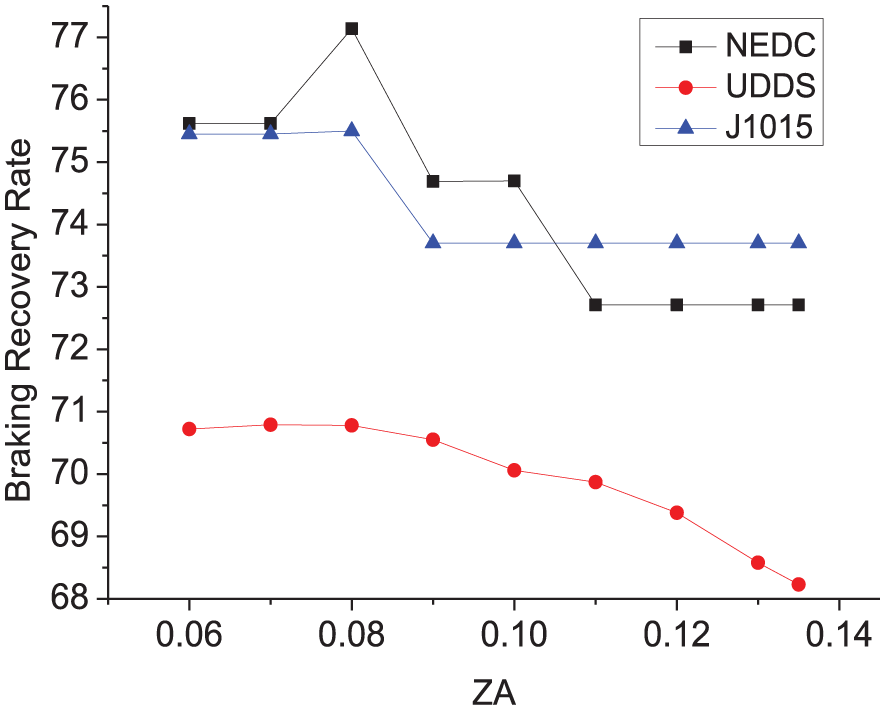
Diagram of the braking recovery rate under different ZA.
Simulation analysis for energy saving control methods
Based on the formulation on vehicle drive braking control that was made in previous sections, we now can determine two energy saving schemes for four-wheel in-wheel motor drive electric vehicles. They are as follows:
Energy saving scheme 1: equal drive torque distribution for four wheels, fixed-ratio regenerative braking force distribution.
Energy saving scheme 2: driving force energy saving distribution, with parallel regenerative braking force distribution.
In the following part of this article, the two aforementioned energy saving schemes will be studied and compared over three urban driving cycles, that is, NEDC, UDDS, and J1015.
The NEDC urban driving cycle
The total simulation time is 1184 s, the simulation time interval is 0.01 s, and the initial SOC is set to be 0.5. Simulation results are presented in Figures 10–18. Figure 10 shows the simulated vehicle speed (red dashed line) and the NEDC driving cycle target speed (black solid line). It can be seen that the simulated vehicle speed could follow the target speed firmly. Figures 11 and 12 show motor torque curves of vehicle front and rear axles under scheme 1. Figures 13 and 14 show motor torque curves of vehicle front and rear axles under scheme 2. Figure 15 shows the comparison for those two schemes of driving energy consumption. It can be seen that the total energy consumption under scheme 1 is 4150 kJ, but under scheme 2, the total energy consumption is 3900 kJ. Comparing to scheme 1, the energy consumption under scheme 2 reduces by 6%. Figure 16 shows the comparison for a fixed ratio of regenerative braking and parallel braking regenerative braking energy. The recovered energy through using the fixed-ratio regenerative braking is 585.3 kJ, the recovered energy through using the parallel braking regenerative braking is 605.9 kJ. Comparing to the fixed-ratio regenerative braking, the energy recovered from parallel braking regeneration braking is increased by 3.5%. Figure 17 shows a comparison between the two schemes in terms of their total energy consumption. The total energy consumption under scheme 1 is 3564.7 kJ, while that under scheme 2 is 3294.1 kJ. Comparing to scheme 1, the total energy consumption under scheme 2 reduces by 6%. Figure 18 shows a comparison between the two schemes in terms of their vehicle battery SOC. The final value of SOC in scheme 1 is 36.52%, while that under scheme 2 is 37.55%. Table 6 summarizes the simulation results illustrated above. Comparing to scheme 1, the drive efficiency under scheme 2 is 4.57% higher, the braking energy recovery efficiency exceeds 2.57%, and the energy saving efficiency exceeds 1.97%.
Comparison of NEDC simulation results.

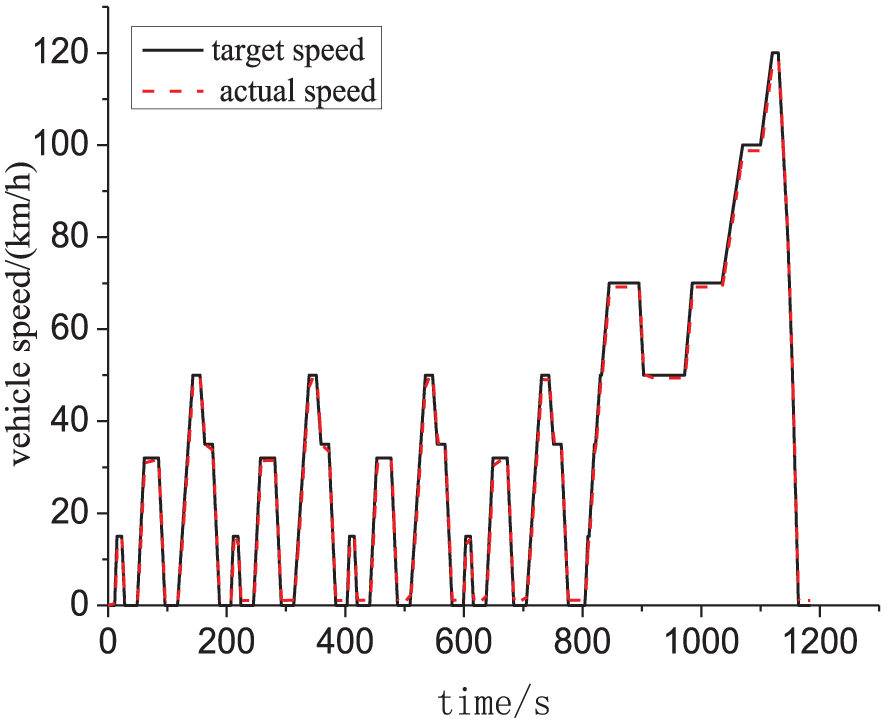
Simulation speed under NEDC city driving cycles.

Front axle motor torque under scheme 1.

Rear axle motor torque in scheme 1.

Front axle motor torque in scheme 2.

Rear axle motor torque in scheme 2.

Driving energy consumption.
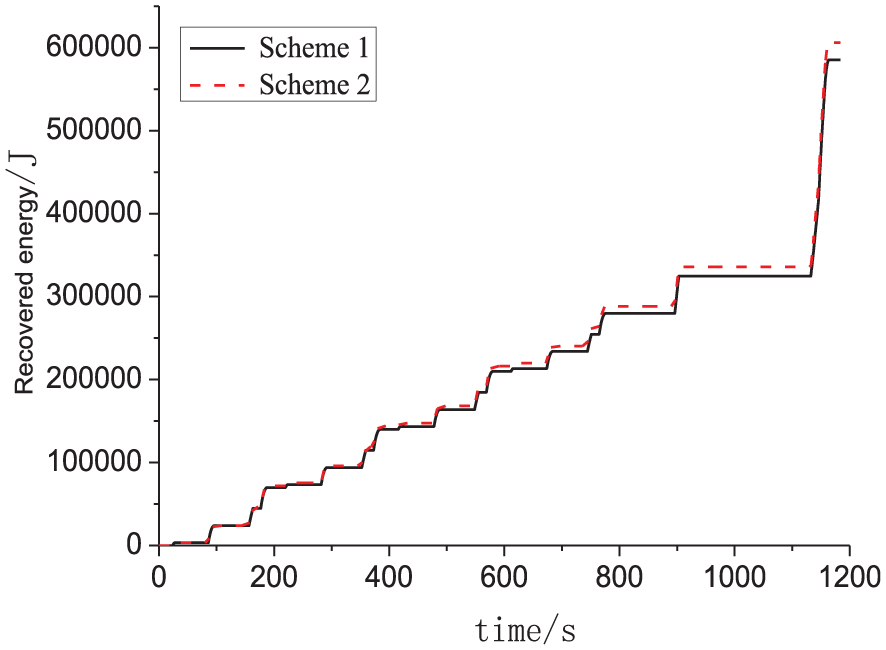
Recovered energy.

Final consumption energy.

SOC.
The UDDS urban driving cycle
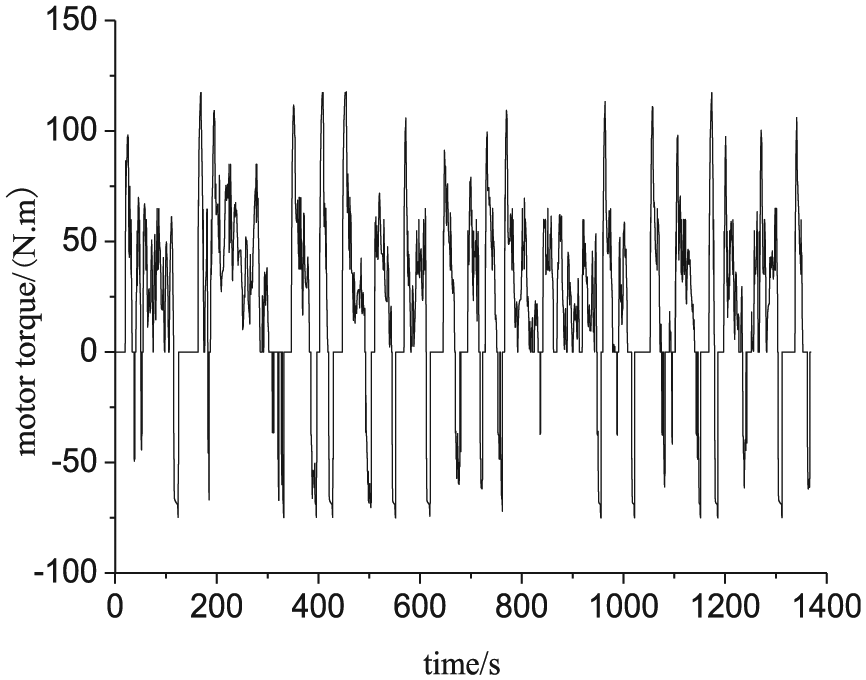
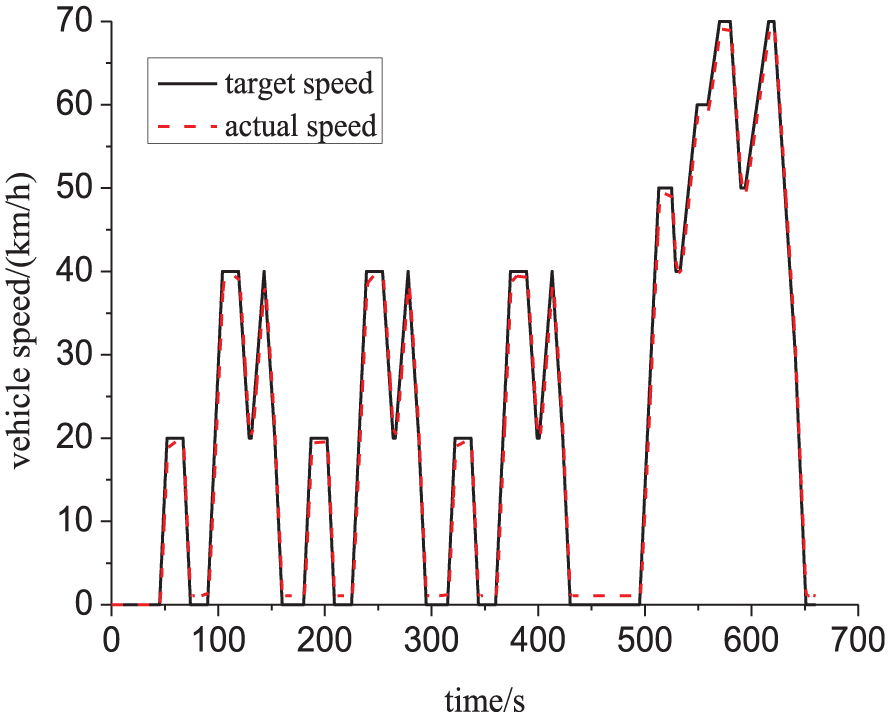
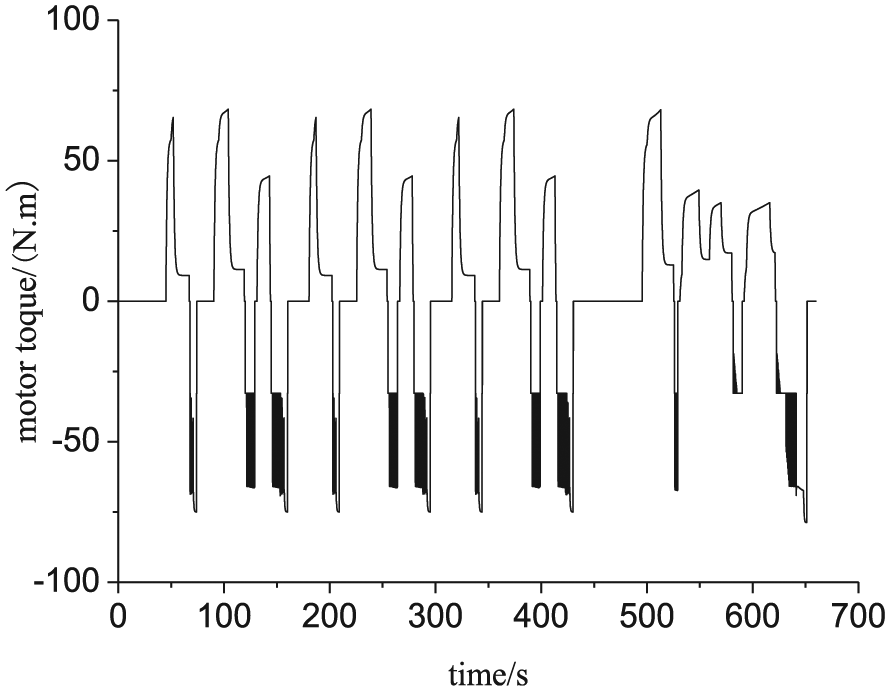
The simulation time is 1369 s, the fixed step size is 0.01 s, the ODE4 Runge–Kutta algorithm is used, and the initial SOC is 0.5. The simulation results show in Figures 19–27. Figure 19 shows the actual speed and the target speed under the UDDS urban driving cycles. It can be seen that the actual simulation speed could well follow the target speed. Figures 20 and 21 show motor torque curve of front axle and rear axle for scheme 1. Figures 22 and 23 show motor torque curve of front axle and rear axle for scheme 2. Figure 24 shows the comparison for those two schemes of driving energy consumption. Four-wheel drive energy consumption in scheme 1 is 4640 kJ, driving energy saving control energy consumption in scheme 2 is 4400 kJ. Compared to scheme 1, scheme 2 has reduced driving energy consumption by 5.17%. Figure 25 shows the comparison for a fixed-ratio regenerative braking and parallel braking regenerative braking energy; the recovered energy by the fixed-ratio regenerative braking is 886.9 kJ; the recovered energy of parallel braking regenerative braking is 894.6 kJ, compared to a fixed-ratio regenerative braking; and the recovered energy of parallel braking regeneration braking is increased by 0.87%. Figure 26 shows the comparison for those two schemes of final consumption energy. The final value of consumption energy in scheme 1 is 3753.1 kJ, and the final value of consumption energy in scheme 2 is 3505.4 kJ. Compared to scheme 1, scheme 2 has reduced final consumption energy by 6.67%. Figure 27 shows the comparison of two kinds of scheme SOC: the final value of SOC in scheme 1 is 35.82%, and the final value of SOC in scheme 2 is 36.74%. Table 7 has compared driving energy consumption, regenerative braking energy recycling, final energy consumption, battery SOC, drive efficiency, braking energy recovery efficiency, and energy saving efficiency of schemes 1 and 2. Compared to scheme 1, the drive efficiency of scheme 2 is higher (3.45%) than scheme 1, the braking energy recovery efficiency exceeds 0.4%, and the energy saving efficiency exceeds 1.89%.

Simulation speed under UDDS city driving cycles.

Front axle motor torque in scheme 1.

Rear axle motor torque in scheme 1.

Front axle motor torque in scheme 2.
Rear axle motor torque in scheme 2.
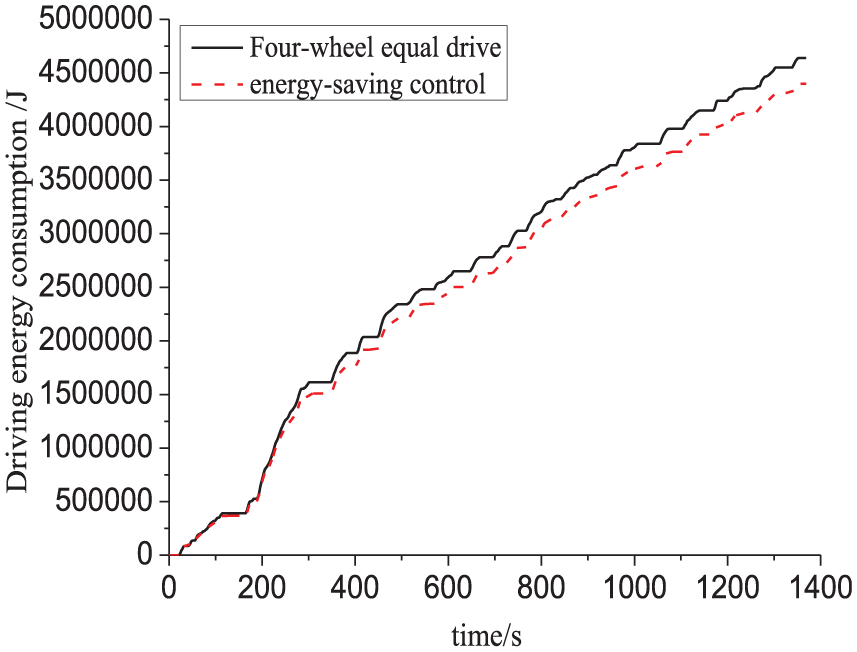
Driving energy consumption.

Final consumption energy.

Recovered energy.

SOC.
Comparison of UDDS simulation results.

The J1015 urban driving cycle
The simulation time is 660 s, the fixed step size is 0.01 s, ODE4 Runge–Kutta algorithm is used, and the initial SOC is 0.5. The simulation results show in Figures 28–36. Figure 28 shows the actual speed and the target speed under the NEDC urban driving cycles. It can be seen that the actual simulation speed could well follow the target speed. Figures 29 and 30 show motor torque curve of front axle and rear axle for scheme 1. Figures 31 and 32 show motor torque curve of front axle and rear axle for scheme 2. Figure 33 shows the comparison for those two schemes of driving energy consumption. Four-wheel drive energy consumption in scheme 1 is 1500 kJ, and driving energy saving control energy consumption in scheme 2 is 1430 kJ. Compared to scheme 1, scheme 2 has reduced driving energy consumption by 4.67%. Figure 34 shows the comparison for a fixed-ratio regenerative braking and parallel braking regenerative braking energy. The recovered energy by the fixed-ratio regenerative braking is 315.3 kJ, and the recovered energy of parallel braking regenerative braking is 332.7 kJ. Compared to a fixed-ratio regenerative braking, the recovered energy of parallel braking regeneration braking is increased by 5.52%. Figure 35 shows the comparison for those two schemes of final consumption energy. The final value of consumption energy in scheme 1 is 1184.7 kJ, and the final value of consumption energy in scheme 2 is 1097.3 kJ. Relative to scheme 1, scheme 2 has reduced final consumption energy by 7.4%. Figure 36 shows the comparison of two kinds of scheme SOC: the final value of SOC in scheme 1 is 45.61%, and the final value of SOC in scheme 2 is 0.32%. Table 8 has compared driving energy consumption, regenerative braking energy recycling, final energy consumption, battery SOC, drive efficiency, braking energy recovery efficiency, and energy saving efficiency of schemes 1 and 2. Compared to scheme 1, the drive efficiency of scheme 2 is higher (3.37%) than scheme 1, the braking energy recovery efficiency exceeds 4.01%, and the energy saving efficiency exceeds 3.71%.
Simulation speed under J1015 city driving cycles.
Front axle motor torque in scheme 1.

Rear axle motor torque in scheme 1.

Front axle motor torque in scheme 2.

Rear axle motor torque in scheme 2.
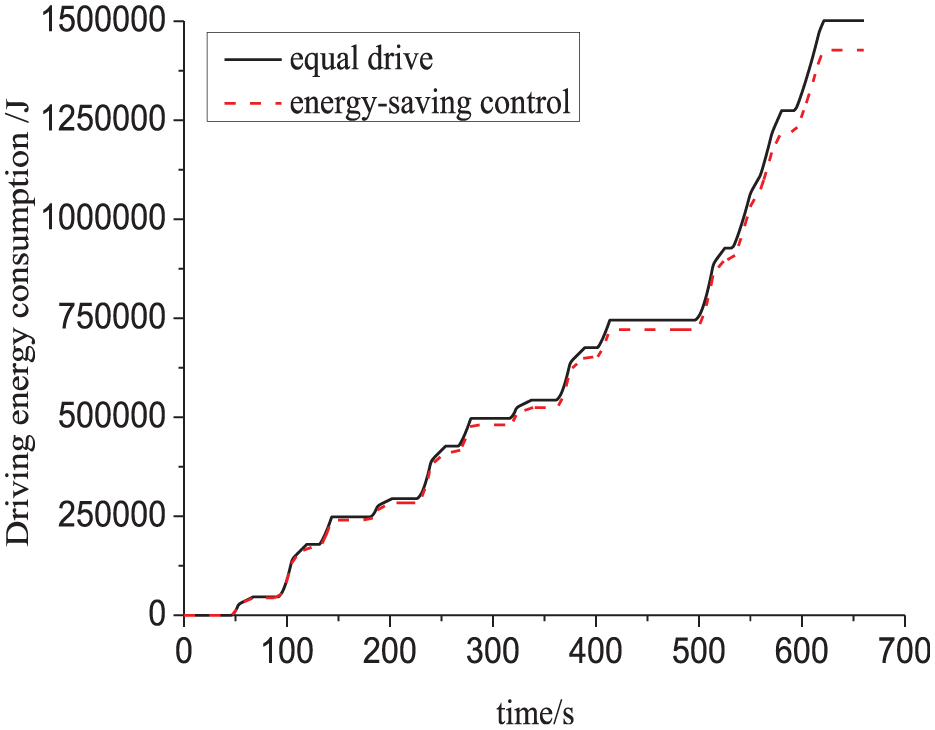
Driving energy consumption.

Recovered energy.

Final consumption energy.

SOC.
Comparison of J1015 simulation results.

All in all, it can be seen that scheme 2 is better than scheme 1 in every index based on the simulation results over all the three urban driving cycles. In addition, it can be found that under the J1015 urban driving cycle, energy saving effect is the most obvious. This is because the J1015 has lower speed and smaller braking intensity. It can be seen that the proposed drive energy saving control method has helped significantly reduced energy consumption, and the proposed parallel regenerative braking method has effectively improved the working efficiency of motor under low speed and small braking intensity. The energy saving effect of energy saving control method is noticeable.
Conclusion
Electric vehicles are mainly driven in city conditions. Due to frequent acceleration and braking, the efficiency of the electric motor would change significantly. In the article, energy saving control method for four-wheel in-wheel motor electric vehicle has been studied based on the motor efficiency map. The main work was summarized as below:
Determining control logics and the evaluating energy saving index: the energy saving control method was studied for vehicle driving and braking. First, the energy saving control logic was determined, that is, go ahead driving energy saving control when the driver steps on the accelerator pedal, and go ahead regenerative braking control when the driver steps on the brake pedal. The driving efficiency, braking energy recovery rate, and energy saving efficiency index were also proposed in order to evaluate the effectiveness of energy saving control.
Investigating braking energy saving control method for four-wheel in-wheel motor electric vehicle based on the motor efficiency map: energy saving objective function and constraint were established. The drive torque at four wheels was optimized in real time to improve the electric vehicles driving efficiency in the driving process.
Investigating regenerative braking for four-wheel in-wheel motor electric vehicle based on the motor efficiency map: according to the ideal braking force distribution and ECE braking regulations, the parallel regenerative braking control method for four-wheel in-wheel motor was proposed based on the motor efficiency map. Through simulation analysis under typical urban driving cycles, brake strength of parallel regenerative braking was determined to improve the braking energy recovery rate of the electric vehicle at low speed or small braking torque demand.
Verifying the energy saving control method through simulation study: simulations were carried out to verify the proposed methods under urban driving cycles, that is, NEDC, UDDS, and J1015. Simulation results show that the energy saving control method has an obvious energy saving effect under urban driving cycles.
Footnotes
Handling Editor: Salvatore Strano
Declaration of conflicting interests
The author(s) declared no potential conflicts of interest with respect to the research, authorship, and/or publication of this article.
Funding
The author(s) disclosed receipt of the following financial support for the research, authorship, and/or publication of this article: This work is supported by National Natural Science Foundation of China (nos 51675257, 51305190), Project of Liaoning Province Innovative Talents (LR2016054), and Project of Liaoning Province Major Science and Technology Platform (JP2016003, 2017001).