
Abstract
A data processing method for constitutive relation of large deformation rubber core in spherical blowout preventer is put forward in this article. Based on the Yeoh constitutive model and the large-deformation theory of rubber material, this article studied the constitutive relation of core material in blowout preventer. The constitutive relation experiments, the uniaxial tensile experiment, the uniaxial compression experiment, the plane tensile experiments, and the volume compression experiment were conducted and the corresponding experiment data were fitted, respectively, on basis of which the uniaxial compression data were selected for further study. For comparison, the data were, respectively, processed with a novel method and the method in GB/7757, and accordingly, two different constitutive relations were obtained and introduced into ABAQUS to simulate the experiment process. Research results show that the relative error of maximum axial deformation between the simulation using GB/7757 and the actual experiment is 34.7%, while that between the novel method and the actual experiment is 20.4%, having improved the accuracy by 14.3%, proving that the data processing method in this article can effectively improve the accuracy of finite element simulation for the core material and will contribute to the research on the performance of spherical blowout preventer.
Introduction
In the process of drilling, there are many uncertain factors in the well, and the potential blowout risk is more likely. Once an accident occurs, it will cause extremely serious consequences, so the well control equipment becomes an indispensable important equipment in the wellsite. The oil spill in the gulf of Mexico 1 is a serious blowout accident, causing heavy losses. Spherical blowout preventer (BOP) is an important part of well control equipment used to control the wellhead pressure to avoid blowout accident during drilling, well repairing, oil testing, and so on. As an indispensable device, spherical BOP is widely used in land drilling and deep-water drilling to ensure stable operation of drilling equipment and provide safety guarantee for the wellsite. 2
The rubber core is a key part of the spherical BOP and its performance is significantly affected by the core material. The rubber core is a vulnerable part affected by many factors, such as cracking (Figure 1), severe spalling on the inner surface (Figure 2), and other phenomena that often occur in the core. All these factors will degrade the sealing performance and shorten the service life of the rubber core. In order to improve the reliability of the core, finite element simulation is utilized to analyze its performance. Since accurate constitutive relation is required in the simulation of the core material, while simulations with existing constitutive relations contain unacceptable huge error, a better constitutive relation is an urgent issue that needs to be solved. Nevertheless, as a typical rubber product, the rubber core has the characteristics of large deformation, viscoelasticity, and will be easily affected by environmental factors, such as temperature, pressure, humidity, which make it quite difficult to achieve an accurate constitutive relation for researchers.

Cracks in the rubber core.

Severe spalling on inner surface of the rubber core.
Nevertheless, there are a variety of constitutive relation models describing the rubber material, among which the representatives are the models of Mooney and Rivlin,3–5Yeoh,6,7Gent, 8 which are relatively mature and reliable. Specifically, the Yeoh 9 model for large deformation contact/impact issues has been proposed in recent years, which has properly improved the simulation accuracy of hyperelastic materials. ZQ Yu et al. 10 proposed a large deformation constitutive model for thermoplastic olefin, describing the deformation of olefinic materials in a better way. I Caylak and R Mahnken 11 studied the stability of mixed tetrahedrons with large deformation and made some contributions to the simulation of superelastic materials. DC Moreira and LCS Nunes 12 reported that simple shear cannot be considered as pure shear combined with a rotation when large deformation is assumed. Y-D Kwon et al. 13 analyzed the effect of Poisson’s ratio on the simulation results of a hyperelastic material. D Forcellini and JM Kelly 14 studied the large deformation behavior of elastic bearings. A-S Lectez et al. 15 introduced a method for the constitutive relationship of superelastic materials with multi-axis pull-torsion tests. TG Ritto and LCS Nunes 16 studied the Bayesian model of superelastic materials. J Aboudi and KY Volokh 17 predicted the failure of the composite with large deformation. WK Shi et al. 18 discussed the effects of the bulk compressibility on rubber isolator’s compressive behaviors. B Crawford et al. 19 proposed a new constitutive relation for silicones, and the constitutive model could predict the first normal stress and extensional behavior at high to medium shear rates. JA Rodríguez-Martínez et al. 20 studied the mechanical response of hyperelastic spherical membranes subjected to dynamic inflation. C Gokulnath et al. 21 put forward a methodology for obtaining implicit constitutive representations involving the Cauchy stress and the Hencky strain. Many researchers have conducted extensive studies on the mechanical properties of hyperelastic materials. However, as a kind of high molecular material, hyperelastic materials often exhibit different mechanical properties if they have different molecular arrangements at the micro level. As a result, few reports about research progress on the constitutive relation of spherical rubber core material could be found.
Based on these research achievements of rubber materials, the author of this article established a novel constitutive model for the rubber core of spherical BOP. However, since each rubber material has its own constitutive relation, the existing constitutive models of rubber materials cannot meet the requirements of spherical BOP simulation. In this article, spherical core material is taken as the research object, and four constitutive relation experiments on the material were conducted. By fitting the experimental data, reasonable experimental data were found out, and then the selected data were both processed with conventional methods and the novel methods proposed by the author. By comparing the data processing results, the most suitable and reliable data processing method was found to describe the constitutive relation of the spherical core material.
Experimental study on constitutive relation of the rubber core in spherical BOP
Introduction to experiment apparatus
In the experiment, as shown in Figure 3, a 2-kN tensile tester is utilized, of which the main parameters are that the maximum experimental load is 2000 N, the maximum experimental speed is 500 mm/min, the experimental effective width is 150 mm, the effective stretching space distance is 700 mm, and the displacement resolution is 0.1 μm where the accuracy level is <0.5.
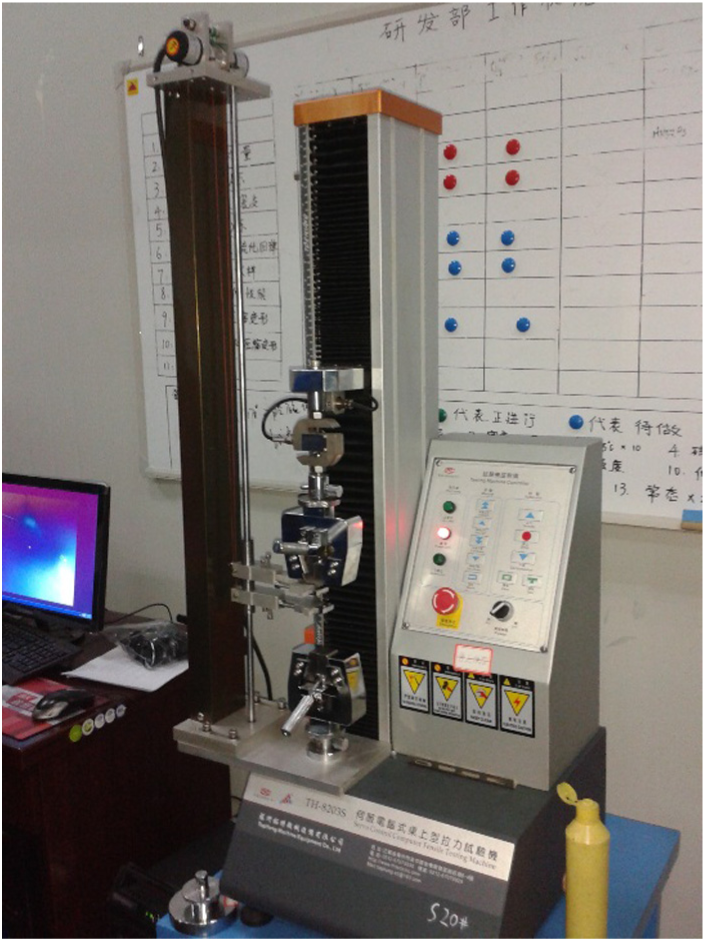
Tensile tester used in the experiment.
Uniaxial tensile experiment
The experiment is conducted according to related rules in GB/T 528-2009 Rubber, Vulcanized or Thermoplastic Determination of Tensile Stress–Strain Properties, and structural sizes 22 of the test sample are shown in Figure 4.

Structural sizes of the tensile test sample.
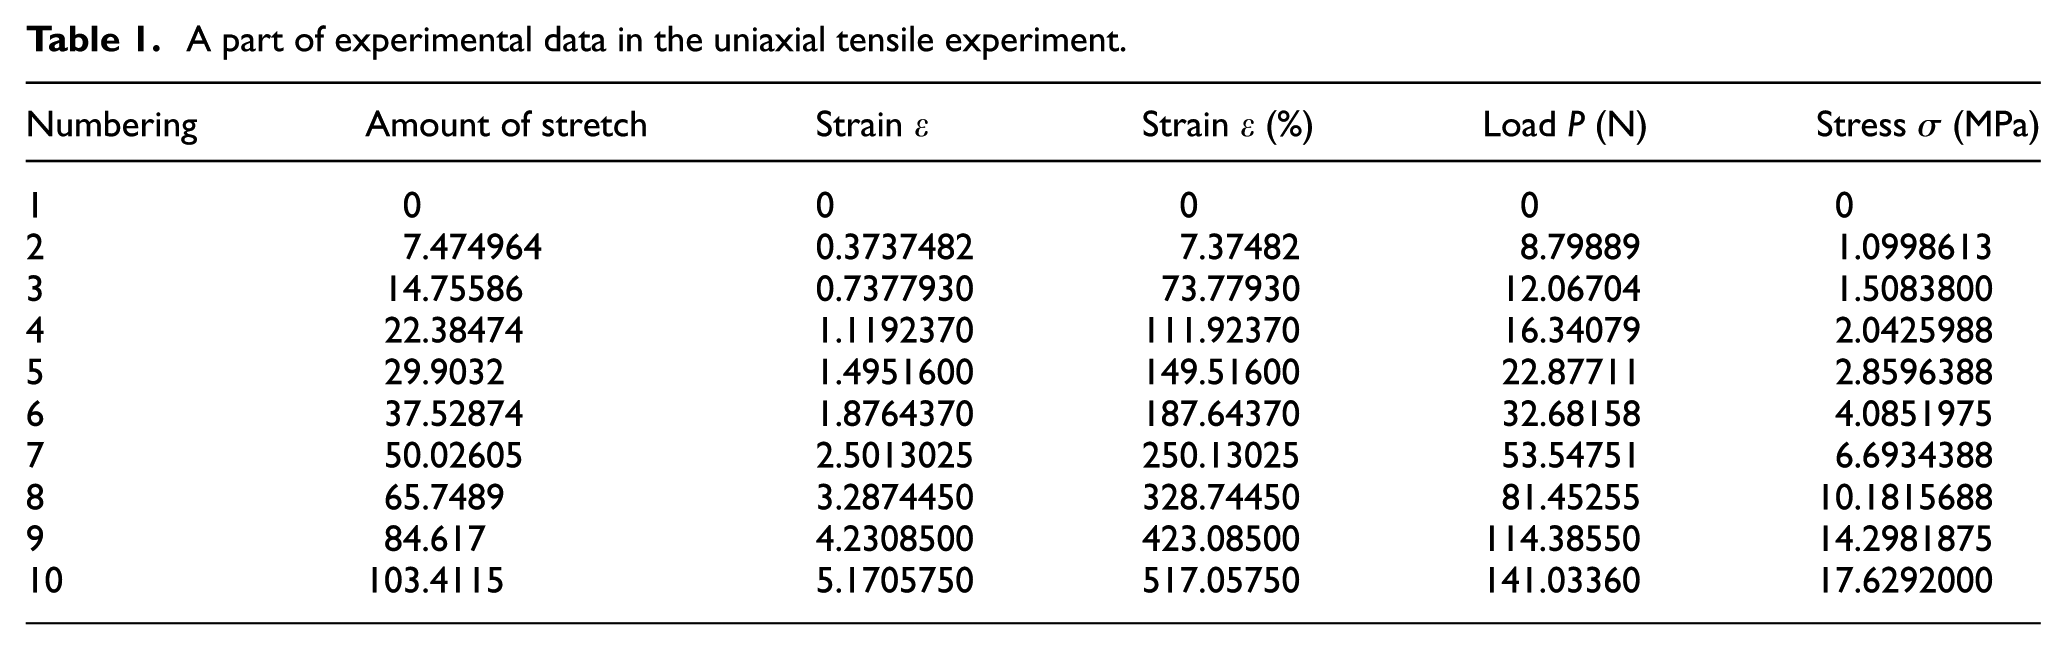
In the experiment, six standard dumbbell-like samples were tested at room temperature; specifically, the samples were stretched at a constant speed of 500 ± 50 mm/min on the tensile tester. During the experiment, the length and force of the samples were continuously monitored until the samples were torn apart. The tested samples are illustrated in Figure 5, and a set of typical experimental data are given in Table 1.
A part of experimental data in the uniaxial tensile experiment.

Tested rubber samples.
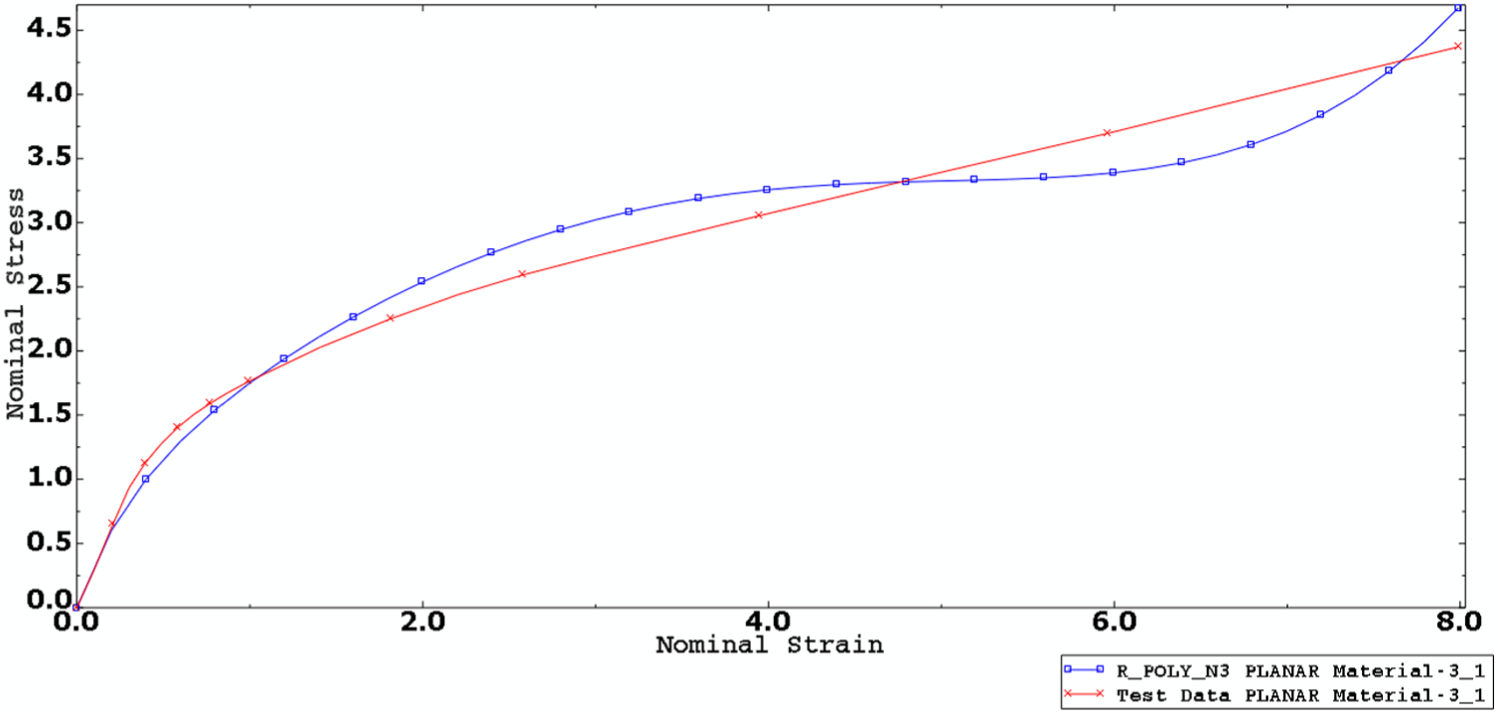
ABAQUS was used to analyze and evaluate the corresponding six sets of experimental data after the experiment. One of the ideal fitting curves is shown in Figure 6, wherein the obtained Yeoh model coefficients are that C10 = 0.506136047 MPa, C20 = 2.300575354 × 10−02 MPa, C30 = −1.769116947 × 10−04 MPa. In this figure, the blue curve is the fitting curve in Yeoh model, while the red one is the experimental data curve. It should be noted that the stress of the two curves changes alternately at different abscissas, and that when the rubber deformation rate exceeds 200%, the error of the Yeoh model increases gradually. The conclusion is that the measured stress value is obviously higher than the theoretical one with the same strain.

Fitting curve of tensile experimental data.
Uniaxial compression experiment
According to GB/T 7757-2009 Rubber, Vulcanized or Thermoplastic Determination of Compression Stress–Strain Properties, the sample is a cylindrical one with a diameter of φ = 29.0 ± 0.5 mm and a height of h = 12.5 ± 0.5 mm. Five samples were put in the test and were compressed at a rate of 10 mm/min at room temperature until the strain reached 44%, and then the samples were rebounded at the same speed and the same temperature, thus repeatedly and continuously compressing and loosening the sample for four cycles. 23 In the four cycles, the first three can be regarded as mechanical adjustment. Results of four cycles were recorded and result of the last cycle was processed, wherein one of the typical experimental data is shown in Table 2.
A part experimental data in the uniaxial compression experiment.

ABAQUS was used to analyze and evaluate the corresponding four sets of experimental data after the experiment. One of the ideal fitting curves is shown in Figure 7, wherein the obtained Yeoh model coefficients are that C10 = 1.15619829 MPa, C20 = 1.18908883MPa,C30 = 0.340784687 MPa. It could be observed in Figure 7 that when the rubber compression deformation rate exceeds 40%, the error of the Yeoh model will increase, but the difference is quite small, which indicates that the overall trend of the theoretical data is basically the same as the experimental data. Since the compression deformation is the main deformation mode of the rubber core in spherical BOP, the constituent coefficient of the core material can be obtained by uniaxial compression experimental data.

Fitting curve of uniaxial compression experiment data.
Plane tensile experiment
The plane tensile model is that the dimension in the width direction is much larger than that in the direction of the tensile force. Similarly, the plane compression model is that the dimension in the length/width direction is much larger than that in the direction of the tensile force (thickness direction), as shown in Figure 8.

Illustration of plane experiment.
In the experiment, each of the samples, of which the sizes are 85 mm × 0.85 mm × 44 mm, was fixed with a flat fixture and tested on the tensile tester at a constant speed of 40 mm/min. With the mentioned facilities and requirements, three sets of experiments are conducted, of which a set of typical data are listed in Table 3.
Partial experimental data in the plane tensile experiment.

ABAQUS was used to analyze and evaluate the corresponding three sets of experimental data after the experiment. One of the typical fitting curves is shown in Figure 9, wherein the obtained Yeoh model coefficients are that C10 = 0.485940296 MPa, C20 = −4.306033840 × 10−03 MPa, C30 = 2.429941023 × 10−05 MPa. Figure 9 shows a large deviation between the blue curve fitted with the Yeoh model and the red curve fitted with the experimental data; it can be noted that the fitting results are not so ideal but the general trend is the correct. When the rubber deformation rate exceeds 100%, the error is obviously increased, meaning that the constitutive relationship data of plane stretching model must be used carefully.
Fitting curve of plane tensile experimental data.
Volume compression experiment
The volume compression experiment is mainly used to determine Poisson’s ratio of the material, but the constitutive model of the material cannot be determined from the volume compression experiment. Nevertheless, more accurate constitutive model of the core material can be obtained by combining the volume compression experiment and one of the above three experiments.
In this experiment, cylinder samples, of which the diameter φ = 29.0 mm and the height h = 12.5 mm, were chosen to be compressed on the tester at 10 mm/min at room temperature. Related experimental data are shown in Table 4.
A part of experimental data in the volume compression experiment.

The experimental data were fitted by ABAQUS software, and the Yeoh model coefficients were derived by introducing the experimental data from the uniaxial compression, of which the fitting results are shown in Figure 10. The obtained Yeoh model coefficients are that C10 = 1.10942387 MPa, C20 = 0.109411896 MPa, C30 = 0.333224613 MPa, D1 =−5.100869789 × 10−02, D2 =−4.054079459 × 10−05, D3 = 2.245549623 × 10−07. The blue curve is fitted with the Yeoh model, and the red curve is fitted with the experimental data.

Fitting curve of the data combined uniaxial and volume compression experiment.
According to the fitting degree of the curves in Figure 10, the Yeoh model can basically reflect the volume compression constitutive relation of rubber when the volume compressive deformation rate is smaller than 5%, while the error will increase sharply above this value. Since Poisson’s ratio of rubber material is quite large, the volume of rubber tends to be very small, which can be concluded from the experiment. Given this, a simple method, assuming that the core rubber is incompressible material and ignoring the effect of volume deformation, the constitutive data obtained are also closer to the experimental results.
Experimental data processing
By analyzing the data of the above four sets of experiments, it can be found that the deviation between the curve fitted with Yeoh model (uniaxial and plane tensile model) and the one fitted with experimental data is relatively large. If the uniaxial or the plane tensile data are used as the constitutive data in the finite element analysis, the result will be very distorted. Besides, during the simulation, ABAQUS software indicated that the two sets of experimental data are unstable hyperelastic materials. Thus, it can be concluded that neither uniaxial tensile experimental data nor plane tensile experimental data could be used for further analysis.
On the other hand, the experimental data of uniaxial compression can be well-fitted with Yeoh model, which can objectively reflect the change of core material in spherical BOP, so the uniaxial compression experimental data were selected as the constitutive data for finite element analysis. Nevertheless, it is found that the error of the results from finite element analysis is still large compared with the experimental data, meaning that the data have to be processed more scientifically in order to improve the simulation accuracy. The original data for uniaxial compression are shown in Table 5.
A part of the original data in the uniaxial compression experiment.

Routine experimental data processing
According to related rules in GB/T 528-2009 Rubber, Vulcanized or Thermoplastic Determination of Tensile Stress–Strain Properties, the compressive stress σ is given as follows

And, the compressive strain ε is given as follows
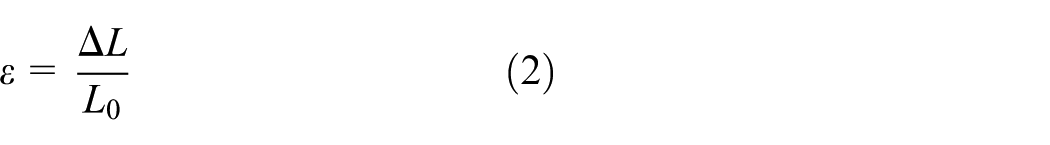
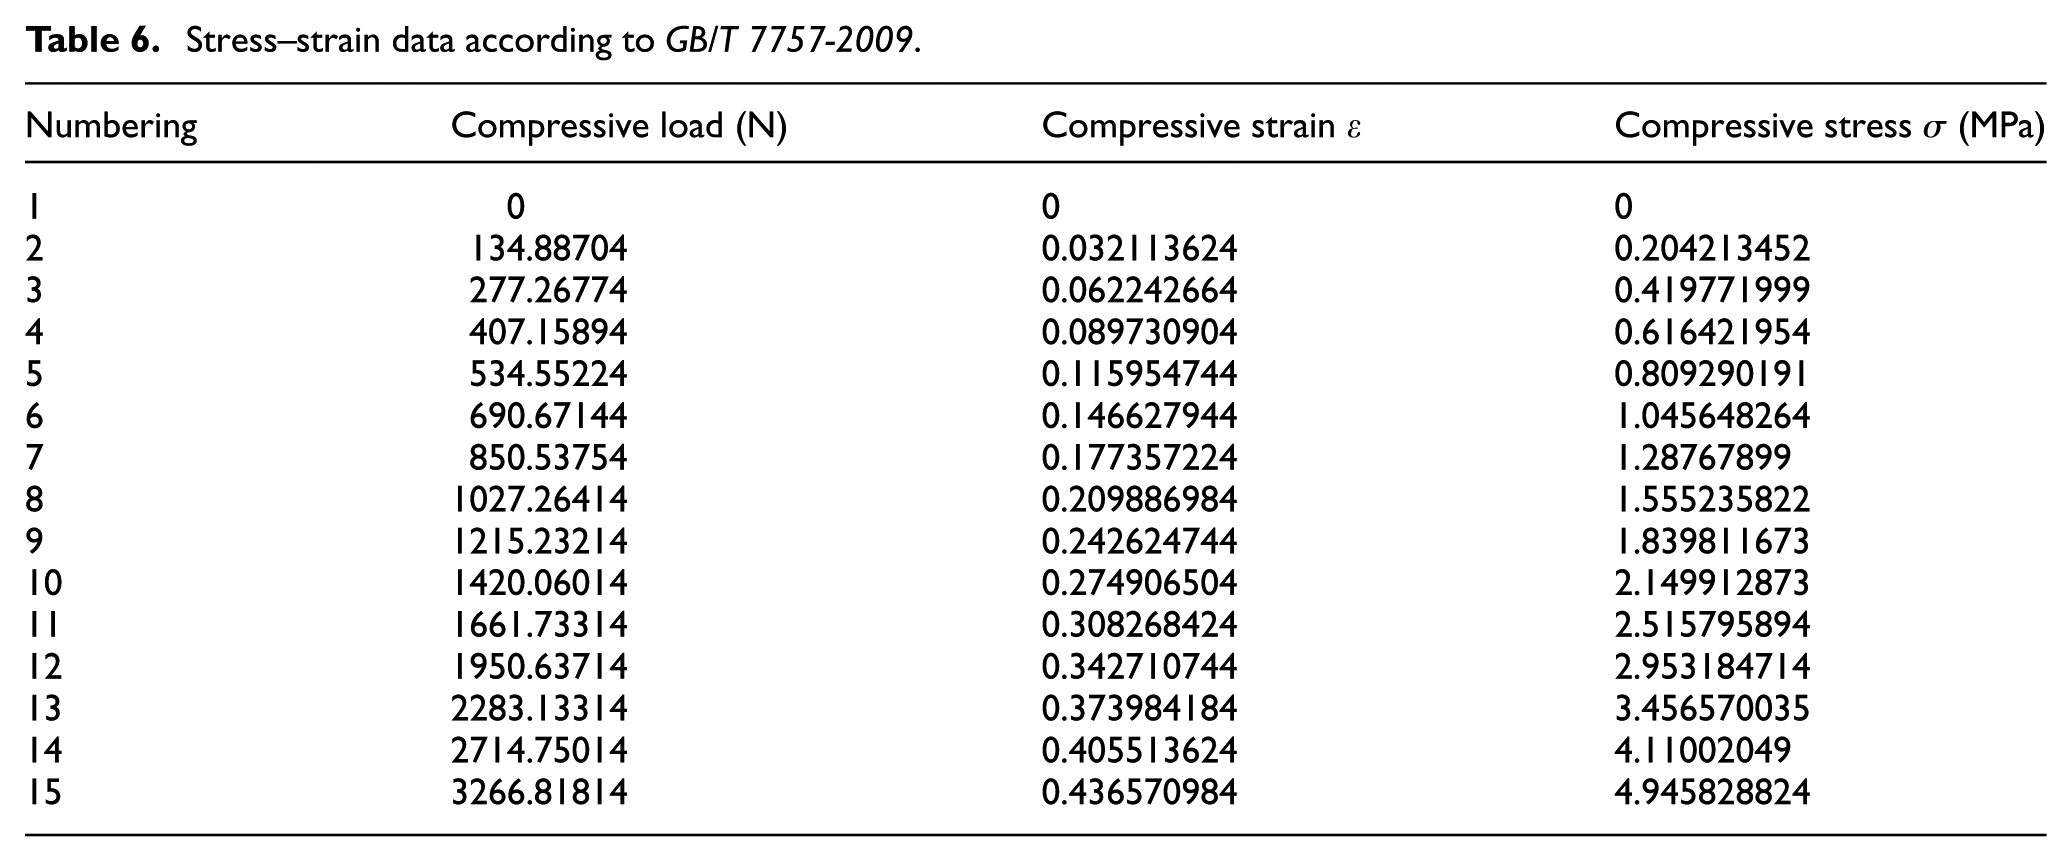
where P is the force applied in the stress direction, S0 is the original cross-sectional area perpendicular to the direction of the applied force in the sample, ΔL is the deformation of the sample along the stress direction, and L0 is the initial size of the sample in the stress direction. The data in Table 5 were processed according to GB/T 7757-2009, based on which the stress–strain data, as shown in Table 6, were obtained.
Stress–strain data according to GB/T 7757-2009.
The Yeoh model coefficients were obtained by fitting the data in Table 6 with ABAQUS software, wherein C10=1.15619829 MPa, C20=1.18908883 MPa, C30=0.340784687 MPa, Poisson’s ratio μ = 0.5. Accordingly, the finite element model for uniaxial compression was established in ABAQUS, as illustrated in Figure 11.

Finite element model for uniaxial compression.
According to the actual situation of the experiment, the load, which is 3268.82 N and evenly distributed, from the upper iron is applied vertically downward on the sample, while the lower iron is fixed. The rubber sample is disposed between the upper and lower iron without friction. Thus, the stress distribution of uniaxial compression is obtained, as shown in Figure 12. Accordingly, the axial compression displacement of the rubber sample is achieved and shown in Figure 13.

Simulation analysis results with the stress-strain data according to GB /T 7757-2009.

Displacement cloud in the rubber sample with the stress-strain data according to GB /T 7757-2009.
According to the simulation results, it can be seen that when σmax the rubber sample reaches 3.54 MPa, the simulated axial load is equivalent to the actual 3268.82 N. The axial compressed displacement obtained from the finite element software is 3.566 mm, while the measured axial displacement is 5.457 mm. The error between the simulated and the measured values reaches 34.7%, which is quite large and unacceptable. Further analysis revealed the cause of the error which is that the National Standard GB/T 7757-2009 data processing theories are based on the small deformation theory, while actually the rubber material is of large deformation category. In order to improve the accuracy of the simulation results, axial compression data are reasonably processed according to the large deformation theory.
Data processing method based on large deformation and rubber incompressibility
The experimental data of uniaxial compression were processed with the large deformation theory of incompressible rubber. Assuming that the volume of the sample remains constant before and after compression, the following equations can be obtained


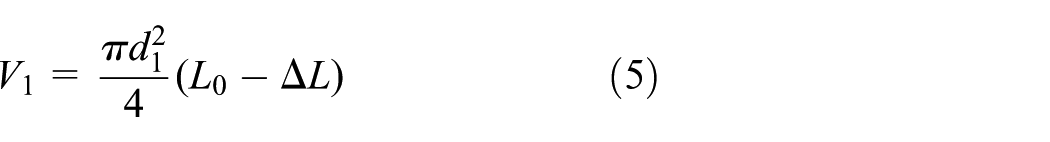
where V0 is the volume of the cylindrical sample before the compression load is applied, V1 is the volume after, d0 is the original cross-sectional diameter of the sample before, d1 is the cross-sectional diameter after, L0 is the height before, and ΔL is the height increment after the compression load applied.
According to the assumption of the volume being constant before and after compression, equation (6) can be derived from equations (4) and (5)

Therefore, the actual compressive stress σ of the sample is as follows

The actual compressive strain ε of the sample is as follows

Based on the above formula, the stress and strain data, as shown in Table 7, are obtained.
The stress–strain partial data based on the theory of volume incompressibility.
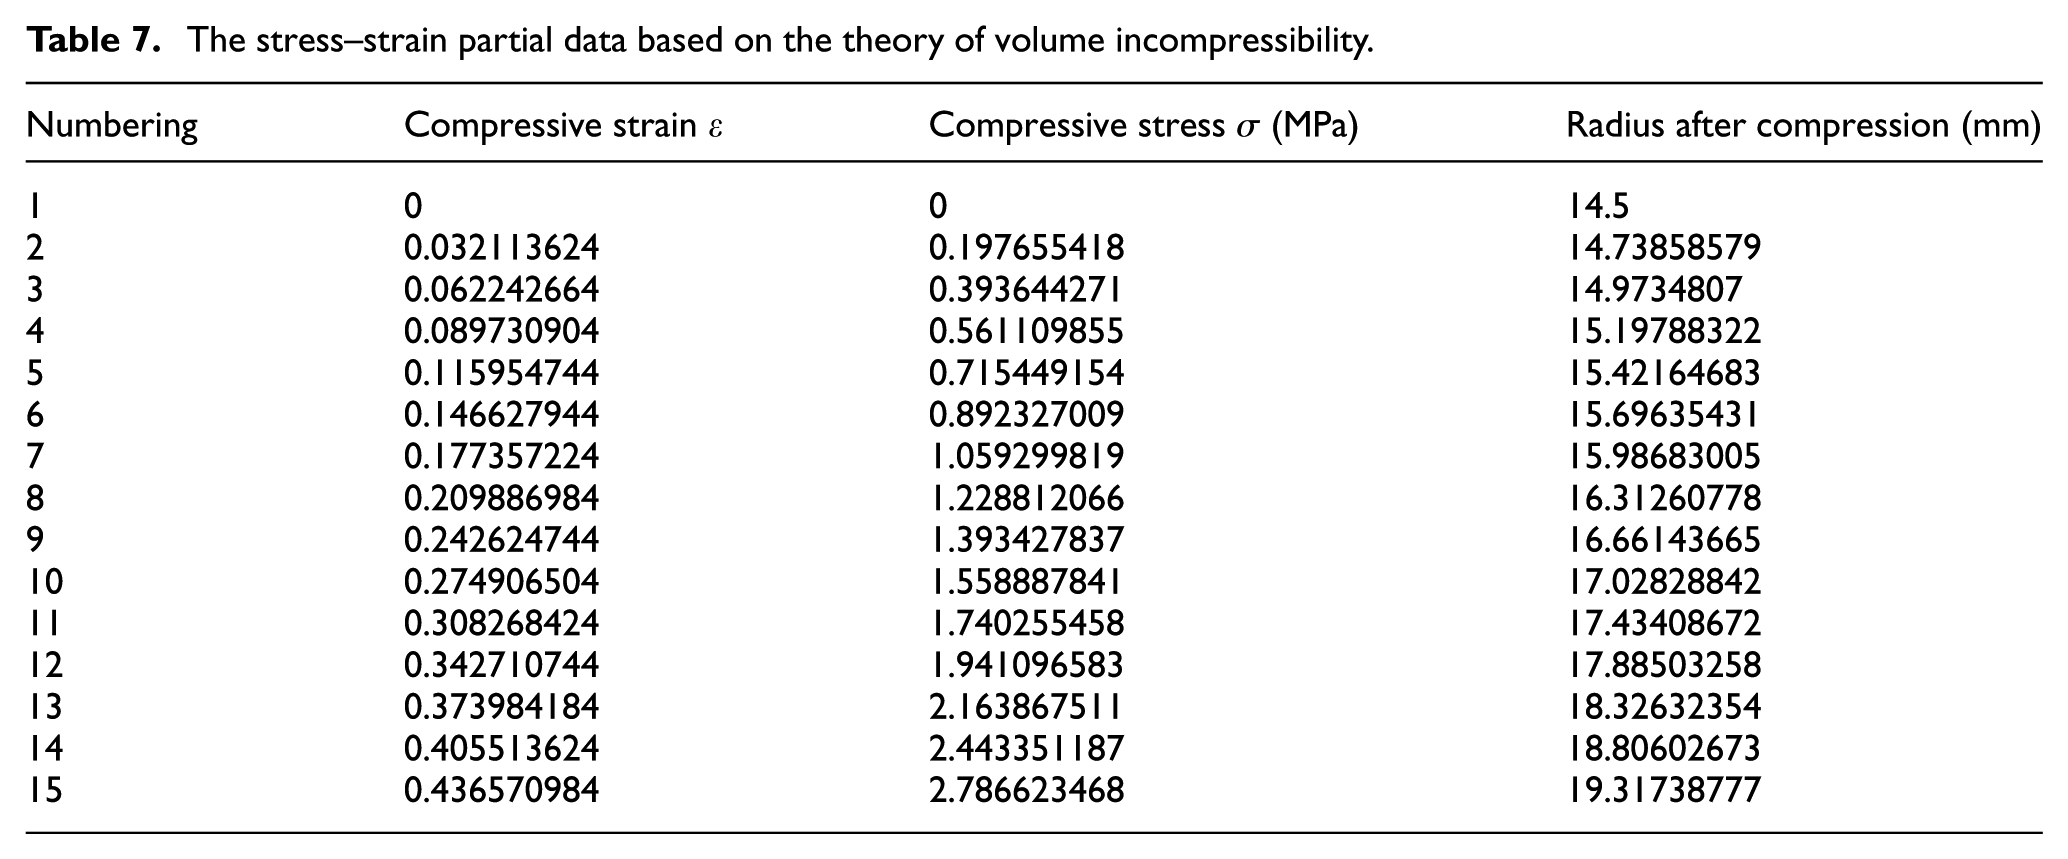
Through processing the data in Table 7 with ABAQUS software, the Yeoh model coefficients can be obtained, which are C10=1.10942387 MPa, C20=0.10 9411896 MPa, C30 = 0.333224613 MPa, and Poisson’s ratio μ = 0.5. According to the actual situation of the experiment, the load, which is 3268.82 N and evenly distributed, from the upper iron is applied vertically downward on the sample, while the lower iron is fixed. The rubber sample is disposed between the upper and lower iron without friction. Thus, obtaining the stress distribution of uniaxial compression in Figure 14, accordingly, the axial compression displacement of the rubber sample is achieved and shown in Figure 15.
Simulation analysis results with the stress-strain data based on the theory of volume incompressibility.

Displacement cloud in the rubber sample with the stress-strain data based on the theory of volume incompressibility.
According to the simulation results, it can be seen that when σmax the rubber sample reaches 3.54 MPa, the simulated axial load is equivalent to the actual 3268.82 N. The axial compressed displacement obtained from the finite element software is 4.343 mm, while the measured axial displacement is 5.457 mm. The error between the simulated and the measured values is 20.4%, which is decreased by14.3% compared with the result in “Routine experimental data processing”. In order to improve the accuracy of finite element analysis, the experimental data of axial compression are processed according to the large deformation theory of incompressible rubber, which is obviously better than the data processing method in the GB/T 7757-2009.
Conclusion
This article is intended to study the data processing method for constitutive relation of rubber material in spherical BOP. First, original constitutive relation data of the rubber material were obtained by uniaxial tensile experiment, uniaxial compression experiment, plane tensile experiment, and volume compression experiment. Furthermore, proper data, that is, the uniaxial compression experiment data, were screened out by utilizing ABAQUS. And then, these original data were processed with two different processing methods so that the optimal constitutive relation data are obtained.
When the data are processed with GB/T 7757 methods, the rubber constitutive relation is of low accuracy. In view of this problem, this article proposes a data processing method based on the large deformation theory of incompressible rubber. Through selection, the uniaxial compression experiment data are selected to be furtherly processed with two different processing methods, so that the optimal constitutive relation data are obtained and imported into ABAQUS software for simulation. Comparisons of the simulation results show that the calculation error using the non-compressible method is 20.4%, which is 14.3% lower than 34.7% obtained using the method of GB/T 7757. So it can be concluded that the non-compressible method significantly improves the data accuracy of the constitutive relation. This study has effectively improved the constitutive relationship accuracy of the rubber core material, laid the foundation for the simulation calculation of the spherical BOP, and will also effectively improve the performance and service life of the rubber core.
Footnotes
Handling Editor: Teen-Hang Meen
Declaration of conflicting interests
The author(s) declared no potential conflicts of interest with respect to the research, authorship, and/or publication of this article.
Funding
The author(s) received no financial support for the research, authorship, and/or publication of this article.