
Abstract
The objective of this article is to investigate the rollover threshold of a heavy-duty vehicle during cornering. Based on the multi-body dynamics theory, a high-fidelity model is established, which takes account of the chassis flexibility, the suspension nonlinear characteristics, the tire handling model, and Ackermann steering strategy. Furthermore, by the inverse fast Fourier transform method, a three-dimensional stochastic road in space domain is employed in the model to improve the accuracy. A full-size heavy-duty vehicle test was carried out to validate the model. Based on the validated model, the rollover stability and rollover threshold of the heavy-duty vehicle during cornering are investigated. Lateral acceleration, yaw rate, roll angle, and vehicle torsional deflection in different cornering conditions are analyzed. The rollover threshold is summarized by the response surface methodology for the safe cornering purpose. The result shows the practical meaning of improving transportation safety of heavy-duty vehicles and also provides useful insights for developing the rollover warning system.
Keywords
Introduction
Heavy-duty vehicle is a type of heavy equipment transporters designed to execute special projects. They are more prone to roll over than civilian vehicles during cornering. In recent years, rollover accidents of heavy-duty vehicles have comprised a disproportionately large number of highway fatalities.1–3 Studying the rollover stability and investigating the rollover threshold of the heavy-duty vehicles have a profound significance of reducing rollover accidents and improving the transportation safety.
Many researches have been dedicated to studying the vehicle rollover stability, aimed to reveal the mechanism of rollover. Shim and Ghike 4 built a 14-degree-of-freedom vehicle model that included the nonlinear effects due to vehicle geometry changes, and he concluded that a rollover model needs to well represent the substantial effects such as the suspension nonlinearity, the tire characteristics, and the roll center deviation. Hegazy et al. 5 developed a realistic multi-degree-of-freedom vehicle model by multi-body dynamics, particularly suitable for analysis of transient cornering conditions. Malviya and Mishra 6 studied how various conditions of maneuvering, crosswinds, and inclined ground planes affect the vehicle rollover stability for buses and trucks. Sellami et al. 7 developed an empirical model to substitute the vehicle dynamics and rollover models and improve the computation effectiveness. He et al. 8 studied the influence of the road friction coefficient on the rollover stability of a six-wheel truck. Ikhsan et al. 9 investigated the correlation and effect of the gross vehicle weight on heavy vehicle rollover stability during cornering event by the TruckMaker Software. Zhao et al. 10 proposed the predictive vertical tire force (PVTF) as the rollover index and established an anti-rollover control system based on active steering. Mashadi and Mostaghimi 11 studied the four-wheel vehicle dynamic response after the tires lift off, aiming at presenting a general criterion for the vehicle rollover threshold. Doecke et al. 12 investigated the relationship between speed limit and fatal crash rate and argued that the safe speed limits will meet the objectives of a safe system. Zhang et al. 13 studied the contour line of lateral transfer ratio (LTR) to predict the vehicle rollover index threat via the roll dynamics phase plane analysis.
Most of the research, though, has focused on studying the rollover stability of the civilian vehicles. The rollover threshold of heavy-duty vehicles during cornering is not clearly addressed yet. In addition, since the structure of the heavy-duty vehicle is quite different from other vehicles, a high-fidelity nonlinear model is indispensable for studying the vehicle rollover. 14 Therefore, further investigation is required.
The objective of this article is to establish a high-fidelity rollover model and to investigate the rollover threshold of the heavy-duty vehicles during cornering. First, the rigid-flexible model of the heavy-duty vehicle is established based on the multi-body dynamics theory. 15 A virtual three-dimensional stochastic road is also employed to simulate the external excitation of the ground. Second, a full-size vehicle test was carried out to validate the model, which laid a solid foundation for the results of the multi-body dynamics simulation. Then, cornering conditions of different velocities and different steering wheel angles are analyzed to study the vehicle dynamic responses. Finally, by means of the response surface methodology (RSM), the rollover threshold of the heavy-duty vehicles during cornering is concluded.
Multi-body dynamic model
Topological structure of model
The whole dynamic model is mainly composed of the flexible chassis, the payload, the cab, the suspension, the tires, and the three-dimensional stochastic road. The topological structure is illustrated in Figure 1. The payload and the cab are fixed to the flexible chassis. The suspension is a double A-arm suspension and there are nonlinear spring forces between the upper control arms and the chassis to simulate the suspension forces. The rotation motions are applied on the kingpins directly to simulate the steering actions. And the driving torque moments are exerted on the tires directly. The modeling of each subsystem will be discussed as follows.
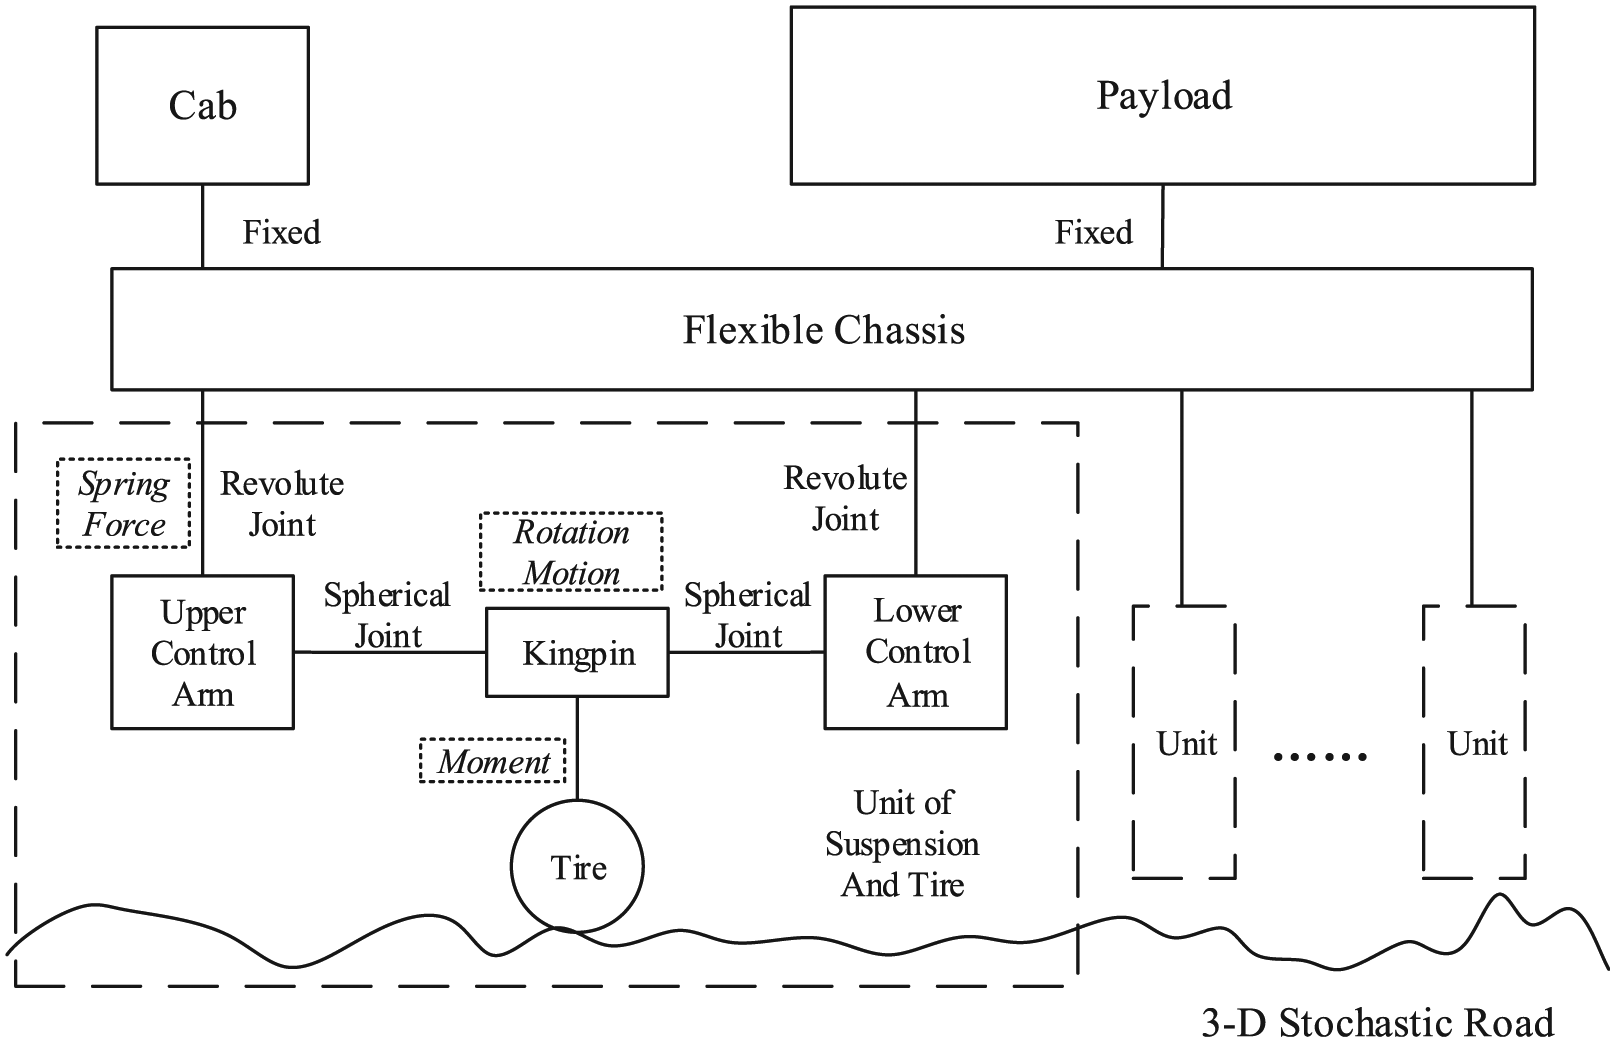
Topological structure schematic of the whole model.
Modeling of chassis
Considering the structural characteristic influence of the chassis, the chassis is modeled to be flexible. The modified Craig–Bampton method 16 is implemented to remove the six rigid modes in order to meet the requirements of multi-body system dynamics calculation. In addition, the reinforcing beams are set as the beam elements with cross-sectional attributes. The flexible part comprised 34 attachment points, 43,763 elements, and 62,603 nodes. According to literature, 17 modes with the frequency less than 50 Hz are adopted to ensure the accuracy of the calculation. Table 1 lists the modal frequencies of the first 12 modes, which begins from mode 7. And Figure 2 shows the first mode and the second mode of the chassis. The result of modal frequency is verified by comparing with a similar chassis in literature. 18
The modal frequencies of the first 12 modes.


The first mode and the second mode of the vehicle chassis.
Modeling of suspension
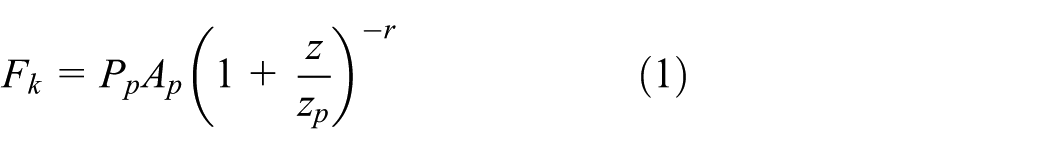
The double A-arm suspension consists of upper control arms, lower control arms, kingpins, and hydro-pneumatic springs, as shown in Figure 3. As the hydro-pneumatic springs have strong nonlinear mechanical characteristics, the suspension forces are presented as nonlinear functions of displacement and velocity of the hydro-pneumatic spring deformation. According to the ideal gas equation, assuming the equivalent height


The double A-arm suspension model.
To balance the stress distribution of the chassis, every four hydro-pneumatic springs on the same side share one air chamber. It means the elastic forces of the four hydro-pneumatic springs are equal. Hence, the elastic force of one hydro-pneumatic spring is rewritten as

where z is the displacement of the hydro-pneumatic spring deformation;
The steering strategy of the heavy-duty vehicle is Ackermann steering, 21 which is efficient and dependable. Ackermann steering tries to ensure that all tires can perform pure rolling motion when the vehicle is cornering, to relieve the bending stress of the chassis and reduce the tire wear and friction force. As shown in Figure 4, the vehicle is steering to the left around the turning center O. According to the Ackermann steering principle, there is
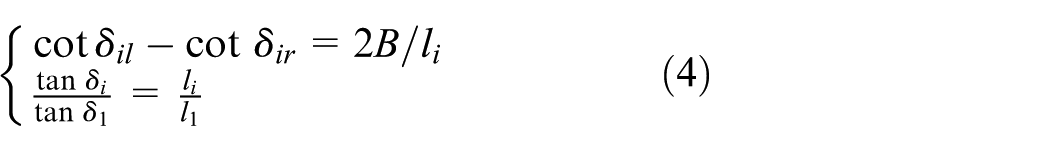
When the steering wheel angle
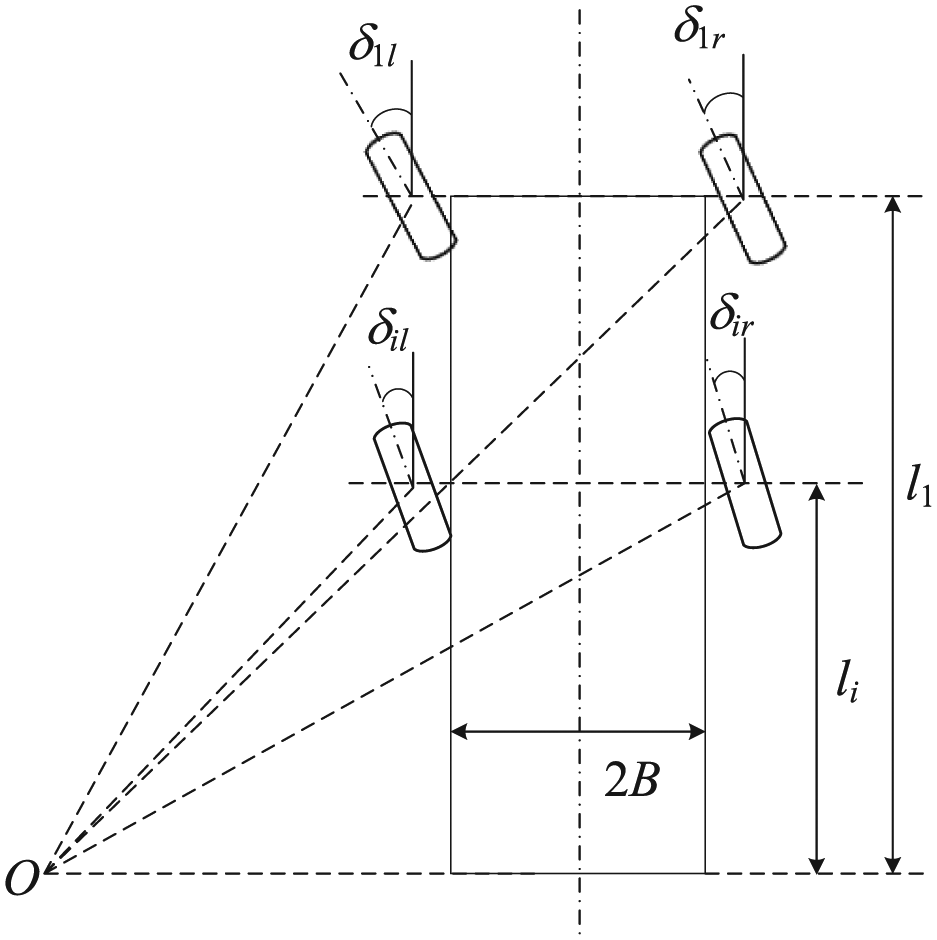
Ackermann steering principle schematic.
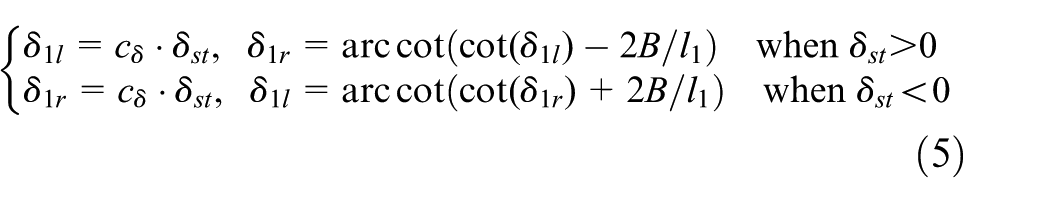
The steering angles of other steering axles are

The steering angles of none-steering axles are

where the coefficient
Modeling of tire
There are many types of tire models since tires are complicated mechanical systems. The type of tire model should be determined by the simulation purpose. The PAC2002 tire model 22 is very suitable for cornering maneuvers. It is the latest version based on the Magic Formula with benefits of modeling tire–road interaction forces accurately. In the radial direction, the PAC2002 tire model considers the tire to behave as a parallel linear spring and linear damper. And in longitudinal and lateral direction, the tire forces strongly depend on the slip between the tire patch elements and the road surface. In addition, the equivalent volume contact 23 is applied between the tire and the road, which can simulate the vehicle running on rough roads with high efficiency. The tire model is established according to the dimensional parameters and the tire stiffness provided by the manufacturer of Qianjin 11AGY027, based on the template of PAC2002-315/80 R22.5.
Modeling of road
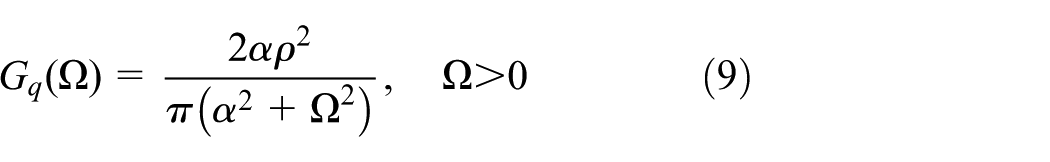
The ISO 8608: 2016 recommended to adopt the following equation as the road roughness power spectral density (PSD) function 24

where RC is the coefficient in respect of the class of road roughness.
On the other side, the rational function form of equation (8) can be expressed as
where α and ρ are the fitting parameters and Ω is the spatial frequency. The values of α and ρ for different road classes are obtained by the least square method. Some fitting results along with the sum of squares due to error (SSE) are given in Table 2.
Fitting results for different road class.

According to the Wiener–Khintchine formula, the autocorrelation function of equation (8) is

Due to the randomness and the isotropy of road roughness, PSD function
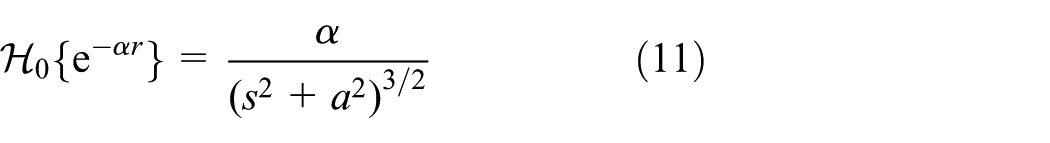
where s is the corresponding variable in the transformation domain. Hence, the one-side two-dimensional PSD function

By the method of the inverse fast Fourier transform (IFFT), 26 the three-dimensional road in space domain is given as

where
As the regular roads in reality usually belong to B class or C class, the road model created for simulation in this article is C class. A three-dimensional, C class road of 409.6 m × 102.4 m in size is finally built up. The partial view of the road roughness is shown in Figure 4. In this road model,

The partial view of road roughness.
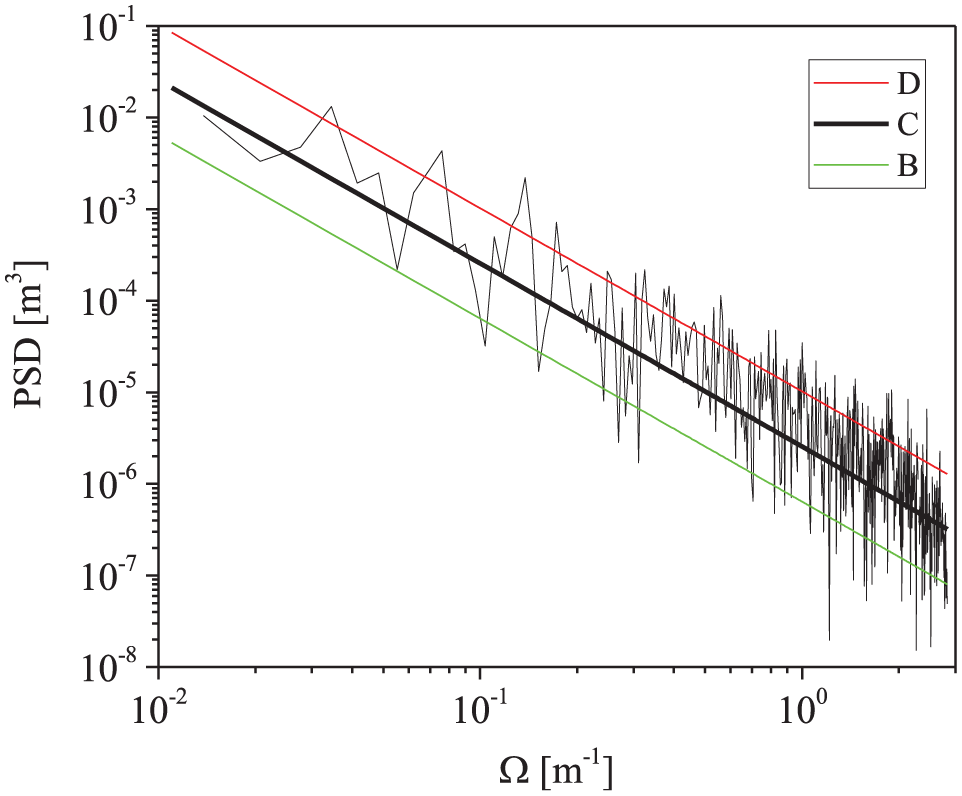
Comparison of the power spectral density (PSD).
Modeling of full vehicle
By Lagrange’s equation for constrained systems, the motion of each part in the system can be described in terms of the generalized coordinates q, as
The generalized coordinates q are given by

Multi-body dynamics equations (14) and (15) are sparsely coupled differential algebraic equations (DAEs). To solve the DAEs, the first job is to convert the algebraic equations into ordinary differential equations (ODEs). This procedure can be done by differentiating the algebraic equations three times, also called I3 formulation. To solve the ODEs, the backward differential formula (BDF) is applied.
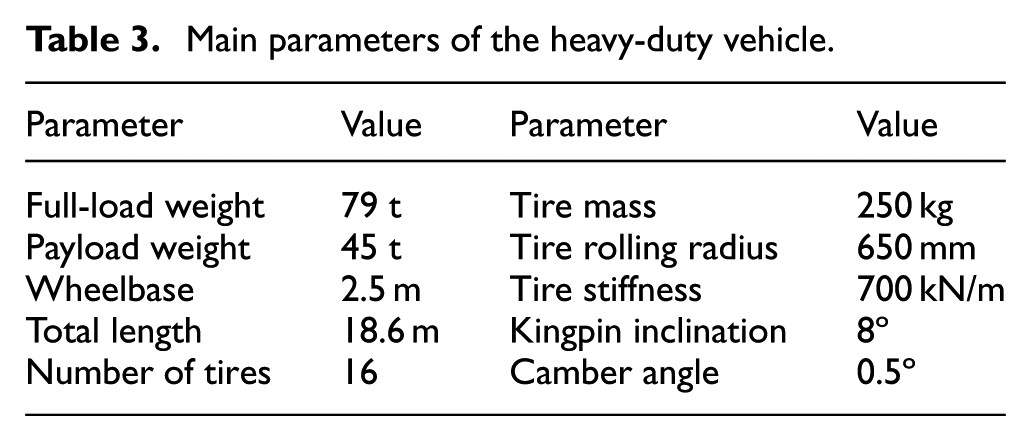
The whole multi-body dynamic model is shown in Figure 7. The main parameters of the heavy-duty vehicle model are given in Table 3. The measurement coordinate system is fixed at the centroid of the vehicle, defined as the x-axis pointing to the vehicle front, the z-axis pointing to the ground, and the y-axis following the right-hand law. The basic assumptions are as follows:
Main parameters of the heavy-duty vehicle.
All constraints are assumed to be ideal (regardless of gaps or frictions);
Neglect minor influence factors such as wind loads.
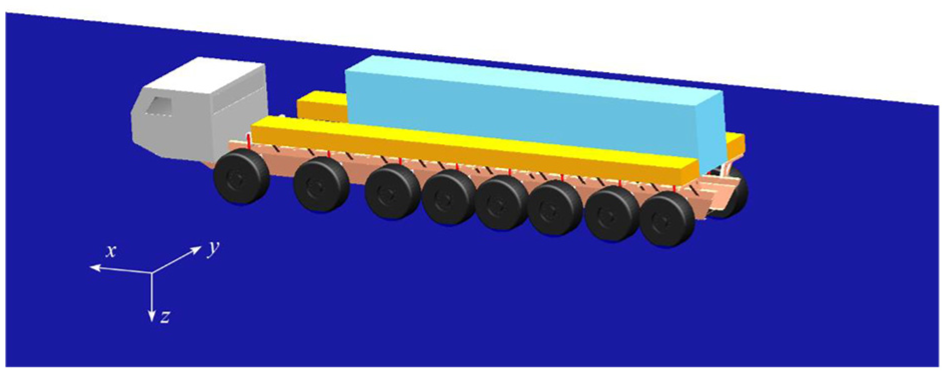
Multi-body dynamic model of the heavy-duty vehicle.
Model validation
Model simulation
The objective velocity and the steering wheel angle are the two input variables in the simulation. The vehicle accelerates at the start of the simulation on the three-dimensional stochastic road and finally maintains a steady velocity after 15 s. Proportional–integral–derivative (PID) control is implemented to control the velocity in the simulation. The input signal of the PID is the difference between the measured velocity and the input velocity (the unit is m/s). The output signal of the PID is the value of the driving torque moment for one tire. The parameters of the PID control are P = 2.0×10⁶, I = 2.0×10⁴, and D = 0.0, respectively. When the simulation time reaches 25 s, the steering wheel angle starts to change as the given input and the vehicle starts to corner. The vehicle maintains cornering until the end of the simulation. The total simulation time is 45 s and the time step is 0.02 s.
Vehicle test
The aim of the vehicle test is to validate the multi-body model. The test field is a suburban parking lot, which has 100 m in length and 70 m in width, with a dry and flat cement concrete pavement. As the space of test field is limited, the vehicle is cornering at the same radius. The circular path was marked by many barricades, as shown in Figure 8.
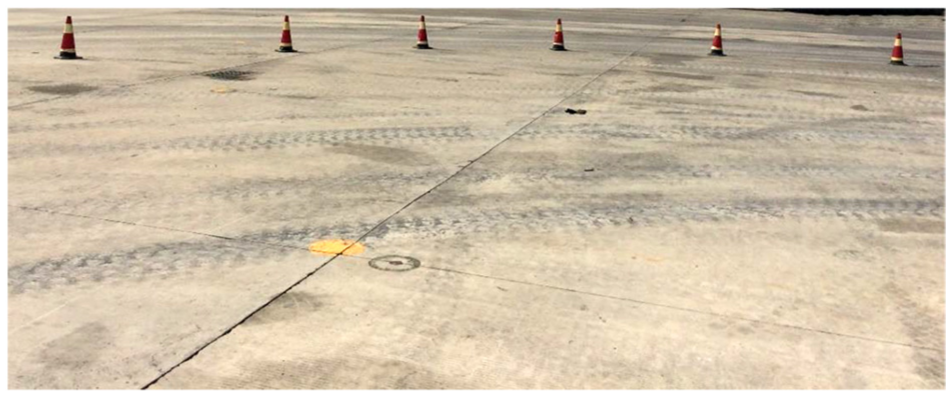
The test field with circularly arranged barricades.
The heavy-duty vehicle is fully loaded. Since the vehicle centroid is inside the payload, it is difficult to arrange the sensor to the vehicle centroid. Therefore, the measurement point was located on the upper surface of the payload, right above the centroid of the vehicle. The GPS/INS device, XW-GI5651 with twin antenna, was mounted on the measurement point. The precision of XW-GI5651 is 0.1° for orientation measurement and 0.01 m/s 2 for acceleration measurement. It transmits data to the laptop by RS-232 port. The output frequency of the measurement devices is configured to 50 Hz, which meets the experimental requirements. A steering wheel angle measuring instrument, HCZ-1A, was installed on the steering wheel. Figure 9 exhibits the measurement devices used in the experimental test. The measurement data mainly include the steering wheel angle, driving velocity, lateral acceleration, yaw rate, and roll angle. A tester was sitting in the cab and monitoring the data during the test.

Measurement devices (HCA-1A and XW-GI5651).
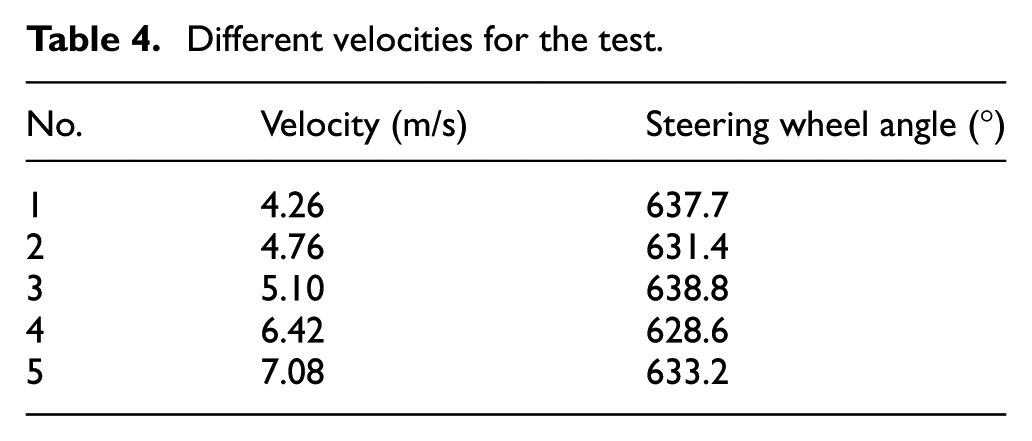
The five levels of driving velocities in the test are shown in Table 4. The steering wheel angles are approximately 630° in all tests.
Different velocities for the test.
Validation
The root mean square (RMS) of the measured lateral acceleration, yaw rate, and roll angle during the steady cornering period are compared with the simulation results. For the equal time interval data series, the RMS is defined as
The results of the comparison between simulation and test are shown in Figures 10–12, and the satisfactory agreement is confirmed. The maximum errors of the lateral acceleration, the yaw rate, and the roll angle are 10.1%, 10.5%, and –17.2%, respectively. And the rest of the errors is less than 8%. The reasons for the errors may be as follows:
It is difficult for the driver to keep the driving velocity to be constant during cornering.
The mechanical properties of the tire are different between low speed and high speed.
Other inevitable unavoidable influence factors such as the undulation of the road surface.
In conclusion, the multi-body dynamics simulation demonstrates the satisfying results by comparing with the test. Hence, the dynamic model is proven to be sufficient to analyze the roll threshold of the heavy-duty vehicle.

Lateral acceleration comparison between the simulation and the test.

Roll angle comparison between the simulation and the test.

Yaw rate comparison between the simulation and the test.
Cornering simulation and discussion
Cornering process analysis
As the long chassis results in a reduction in vehicle torsional stiffness, there is a roll angle difference between the cab and the payload during the steady cornering period, which is denoted as the vehicle torsional deflection (VTD) in this article. Therefore, the VTD in vehicle roll characteristics needs to be studied. 27 Therefore, four important parameters of the heavy-duty vehicle, yaw rate, lateral acceleration, roll angle, and VTD will be discussed in the section.
A case of cornering is analyzed to investigate dynamic response of the cornering process. The velocity in the simulation is 7 m/s, and the steering wheel angle input is shown in Figure 13. The result is presented in Figures 14–17, and it demonstrates that a dynamic cornering of the heavy-duty vehicle can be divided into four stages:
Stage 1: Straight driving period (0 < t ≤ 25 s)
The steering wheel angle is zero and the vehicle is keeping straight driving. Due to the stochastic excitation of the road, the lateral acceleration, the yaw rate, and the VTD oscillate around zero, while the roll angle slowly undulates around zero.
2. Stage 2: Dynamic steering period (25 s < t ≤ 28 s)
The steering wheel angle starts to increase and the vehicle starts to corner dynamically. The lateral acceleration and the yaw rate decrease rapidly; the roll angle increases rapidly; and the VTD increases at first and then decreases.
3. Stage 3: Transitional period (28 s < t ≤ 30 s)
The steering wheel angle just reaches the steady value. But as a result of the inertia effect, the lateral acceleration, the roll angle, and the VTD have some overshoots. It takes about 2 s to finally get them stabilized.
4. Stage 4: Steady cornering period (t > 30 s)
The steering wheel angle is constant and the vehicle is cornering steadily. The lateral acceleration, the yaw rate, the roll angle, and the VTD oscillate around the steady values. In this case, the RMS of the yaw rate is 11.869°/s, the RMS of the acceleration is 1.019 m/s 2 , the RMS of the roll angle is 2.074°, and the RMS of the VTD is 0.209°.

The steering wheel angle input.

Yaw rate versus time.

Lateral acceleration versus time.

Roll angle versus time.

VTD versus time.
Overall, the dynamic responses of the multi-body dynamic model present fine results under the excitation of the stochastic road. Further investigation can be achieved with the help of the cornering simulations.
Analysis of different conditions
When a vehicle is cornering at a high velocity, a rollover might occur. Most heavy-duty vehicle drivers fail to perceive their proximity to rollovers as the time span of rollover is short and abrupt. 28 Figure 18 displays a comparison between a critical cornering (velocity of 9 m/s) and a rollover cornering (velocity of 10 m/s). The states of the two vehicles are quite similar to each other before 28.5 s, and then, the rollover happens instantly. Due to the suddenness of the rollover, it is beneficial to be aware of the rollover threshold in advance.

Comparison between the critical cornering and the rollover cornering.
Simulations of different driving velocities and steering wheel angles were performed. Once the roll angle is larger than 50°, it is considered as a rollover and the simulation stops. The RMS of the lateral acceleration, the yaw rate, the roll angle, and the VTD is shown in Figures 19–22, respectively. The symbols and lines which are out of the figure boundary indicate that rollovers occur, and there are no valid values in the steady cornering period. The results are discussed as follows:
The lateral acceleration and the yaw rate increase with the increase in the velocity and the steering wheel angle. In addition, the lateral acceleration has an increasing tendency with the increase in velocity; the yaw rate increases with the increase in the velocity and the steering wheel angle proportionally.
The roll angle basically increases with the increase in the velocity and the steering wheel angle. However, when the steering wheel angle is 180°, the roll angle at velocity of 9 m/s is larger than the roll angle at velocity of 10 m/s; at a velocity of 5 m/s, the roll angle with steering wheel angle of 270° is smaller than the roll angle with steering wheel angle of 180°.
For the same steering wheel angle, the VTD increases first and then decreases below zero with the increase in the velocity. It also can be observed that the VTD in the critical conditions is always negative, which implies the payload is “taking the initiative” to roll the chassis. This behavior of VTD in the steady cornering period could indicate whether the vehicle is in the critical condition or not.
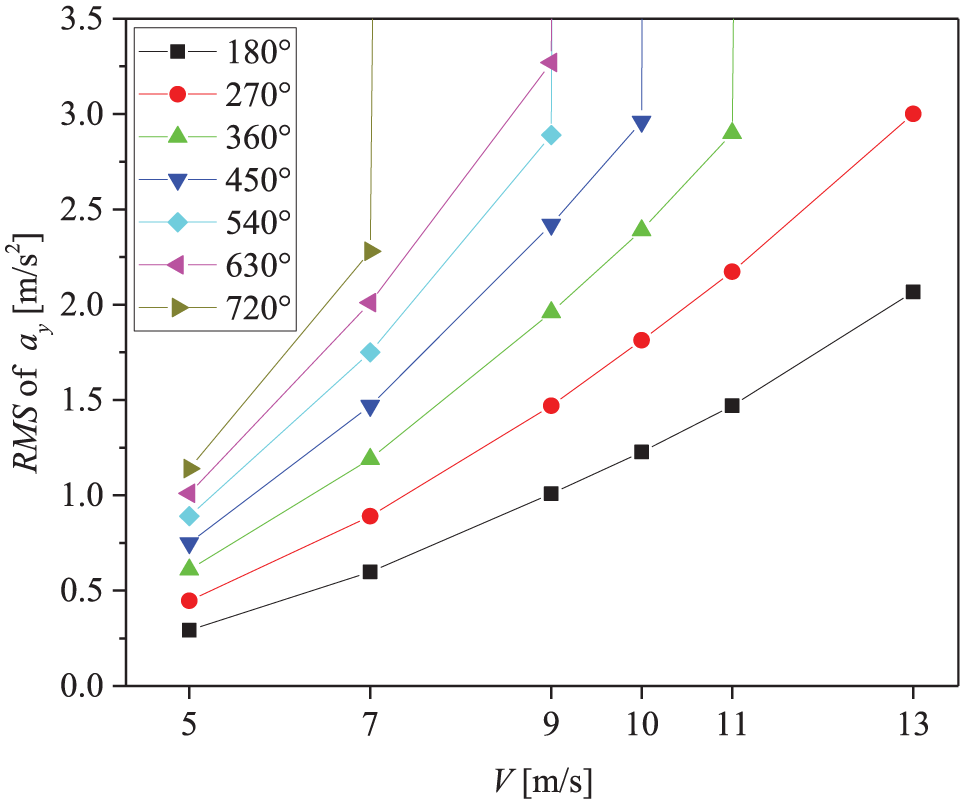
The RMS of lateral acceleration with different velocities and steering wheel angles.
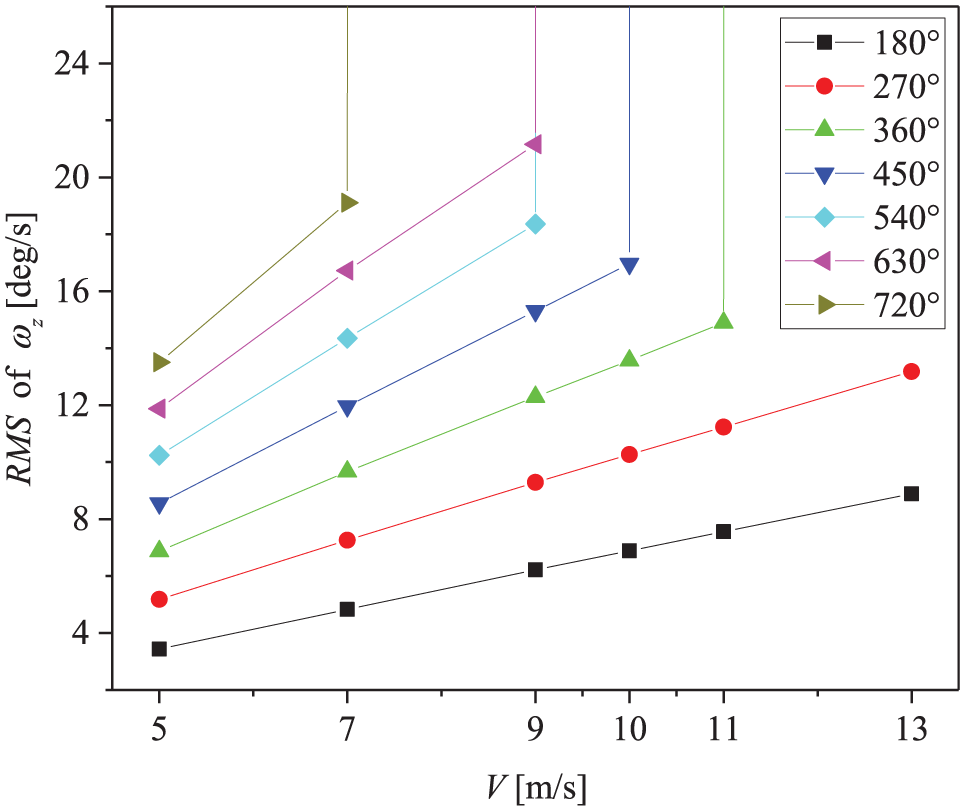
The RMS of yaw rate with different velocities and steering wheel angles.

The RMS of roll angle with different velocities and steering wheel angles.

The RMS of VTD with different velocities and steering wheel angles.
Rollover threshold investigation
The lateral transfer ratio (LTR)29–31 has been considered as the most commonly used index for evaluating the vehicle rollover tendency. It is a dimensionless normalized value ranging from –1 to 1. When LTR equals –1 or 1, it means that one side of tires is totally lift off from the ground. LTR is defined as

where Fz, R is the sum of the right tire vertical forces and Fz, L is the sum of the left tire vertical forces. Although the tire forces are non-uniformly distributed and difficult to measure in reality, they could be easily reckoned up from the simulation.
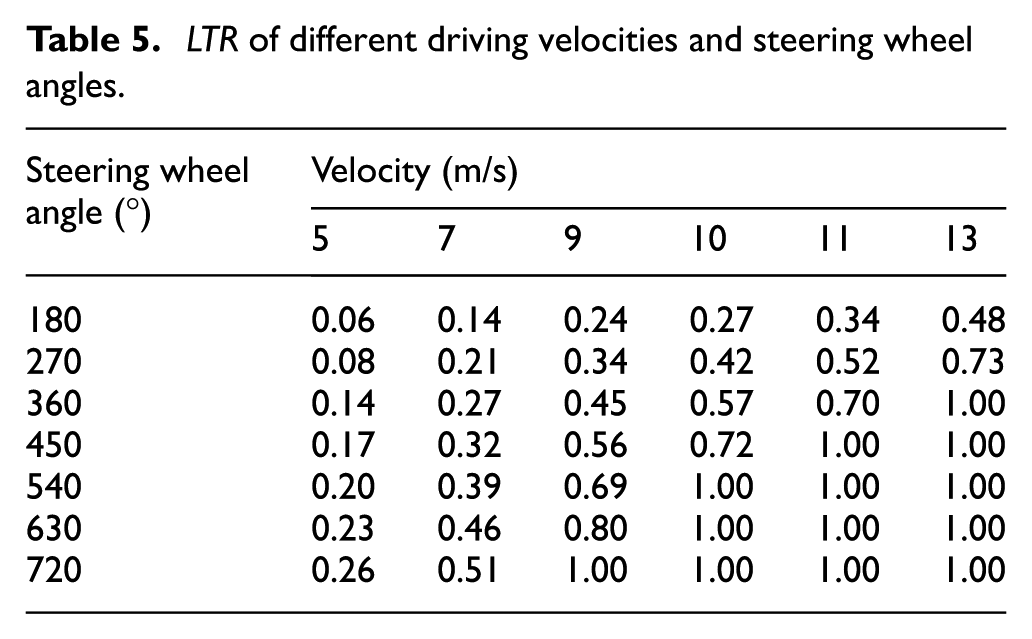
The results of LTR of different driving velocities and steering wheel angles in steady cornering period are shown in Table 5, where LTR = 1 indicates a rollover occurs. It can be seen that the rollovers are more intended to occur at a velocity larger than 9 m/s or when the steering wheel angle is bigger than 540°.
LTR of different driving velocities and steering wheel angles.
To investigate the critical cornering condition, the relationship between LTR and the driving conditions is constructed and analyzed by the RSM. 32 The basic form of an RSM model using a second-degree polynomial function with two variables is given as

where

where
Based on Table 4, 29 sampling points are applied to construct the response surface model, excluding the sampling points with LTR = 1. The response surface model and sampling points are shown in Figure 23. The SSE of the response surface model is 0.0266, which meets the accuracy requirements of the RSM. The coefficient


Illustration of the response surface model and the sampling points.
Since all the LTR in the non-rollover conditions is no bigger than 0.8 as shown in Table 5, the critical value of LTR is set to be 0.8. The contour plot of the response surface model is shown in Figure 24, including the curve of the critical condition. It offers an intuitive diagram for evaluating the rollover tendency of the heavy-duty vehicle in respect of the velocity and the steering wheel angle.

Contour plot of the response surface model.
Based on the response surface model, the rollover threshold can be fitted by the polynomial interpolating function given as follows

where V is the velocity and χ4 = 0.1071, χ3 = −6.08, χ2 = 134, χ1 =−1385, and χ0 = 5951.
The cornering conditions which comply with equation (21) are considered as the safe conditions. The maximum of the steering wheel angle is 492 deg at a velocity of 10 m/s, for example, which means that rollovers may occur with huge possibility when the steering wheel angle is bigger than 492° during cornering. Finally, since the maximum steering wheel angle of the heavy-duty vehicle is 750°, the safe cornering velocity of the heavy-duty vehicle is 8.12 m/s according to equation (21).
Conclusion
This article has demonstrated the application of multi-body dynamics in investigating the rollover threshold of heavy-duty vehicles. A rigid-flexible multi-body dynamic model subjected to a steering input function with a constant velocity has been presented. The rollover threshold of the heavy-duty vehicle is investigated by means of RSM with two variables: the velocity and steering wheel angle. The conclusions are summarized as follows.
Based on the multi-body dynamics theory, a high-fidelity virtual prototype model is established, which takes account of the chassis flexibility, the suspension nonlinear characteristics, the tire handling model, Ackermann steering, and the three-dimensional stochastic road. The main vehicle parameters are enclosed in this article. The modeling process could be a useful reference for other studies.
The comparison between the vehicle tests and simulation demonstrates that the multi-body dynamics simulation can offer efficient and reliable numerical results for studying vehicle rollover purpose. Based on the simulation, the vehicle dynamic responses in each stage of the cornering process are discussed in detail.
In terms of the velocity and the steering wheel angle, the lateral acceleration, the yaw rate, the roll angle, and the VTD are analyzed. The lateral acceleration and yaw rate both increase with the increase in the velocity and the steering wheel angle. Road roughness plays a dominant role in the roll angle when the steering wheel angle or the velocity is small. The sign of VTD in steady cornering period corresponds to whether it is in the critical cornering condition. The results could contribute to the development of the rollover warning systems.
Based on the RSM model of LTR, the rollover threshold mathematical expression of the steering wheel angle and velocity is concluded. The safe cornering velocity of the heavy-duty vehicle is 8.12 m/s for all possible steering wheel angles. Appling RSM to multi-body dynamics simulation has been proven to be an effective solution to investigate the rollover threshold, which also shows great potential in studying other hazardous driving maneuvers.
Footnotes
Acknowledgements
Xiaotong Dong contributed the most to this paper. Xiaotong Dong and Yi Jiang designed and performed the experimental test, Xiaotong Dong and Wei Zeng analyzed the data, Xiaotong Dong and Zhou Zhong contributed the analysis tools, Xiaotong Dong and Yi Jiang wrote the paper, and Yi Jiang organized and managed the team.
Handling Editor: Crinela Pislaru
Declaration of conflicting interests
The author(s) declared no potential conflicts of interest with respect to the research, authorship, and/or publication of this article.
Funding
The author(s) received no financial support for the research, authorship, and/or publication of this article.