
Abstract
The stiffness of mounting system determines the vibration isolation ability of the transmitted path, which is the key factor that affects the vibration and noise of vehicle. In order to improve the vibration isolation ability of the powertrain mounting system, considering the powertrain of front wheel drive car as the research object, the vibration decoupling rate and its corresponding frequency of the powertrain mounting system are analyzed by rigid body dynamics and energy method. The correctness of the calculation program with energy method has been verified by calculated vibration decoupling rate. Based on the genetic algorithm and the fusion robustness analysis, the decoupling rate and modal frequency of the mountings in all directions are considered as the objectives; the stiffness of the three mountings is optimally designed. Through multi-excitation of three methods and vehicle test, the vibration response characteristics and the vibration noise test data of the optimization stiffness are compared and the results shown that the vibration isolation performance has been significantly improved more than 10%. An integrated design method of stiffness optimization design and vibration analysis in vehicle PMS is formed, which has theoretical and practical value, and can reduce vehicle vibration and noise.
Keywords
Introduction
Noise, vibration, and harshness (NVH) performance is one of the main attributes in a passenger car. The Powertrain Mounting System (PMS) is one of the key subsystems that affect the performance of NVH. PMS as an important node in the vibration transmitted path, more and more aroused the attention of major vehicle original equipment manufacturer (OEM). The vehicle vibration comes mainly from two parts, one is from the powertrain, transmitted to the vehicle body through the PMS, and the other is from the ground load, through the tire to the PMS, and finally transmitted to the vehicle body. 1 It is an effective way that vibration decoupling of the 6 degrees of freedom of PMS to improve the level of vibration isolation in transmitted path, and also it is the key measures to improve the vehicle vibration and noise level. 2
In order to improve the vibration isolation capability, many researchers use a variety of vibration isolation components. Many scholars have studied the vibration characteristics of the mounting system to improve vehicle ride comfort.3,4 In the 1920s, rubber components were first used to connect powertrain and frames, 5 which can reduce the vibration transmission between the PMS and the body and improve driving comfort. In the 1950s, with the maturity of various mathematical methods, people apply crashing center theory and energy decoupling to PMS. Brach 6 applied crash center theory to the decoupled design of the PMS, achieved a better decoupling effect. In the 1960s, people study the dynamic properties of rubber, gradually improve the previous understanding of mounting design; Jeong and Singh 7 proposed a dynamic decoupling theory based on torque axis, used in PMS design, obtained a good vibration isolation. Park and Singh 8 proposed a decoupling method of PMS with non-proportional damping. The feasibility of this method is verified by experimental methods. W Sochacki et al. 9 studied the vibration of the frame considering the mounting damping.
For the optimization design of PMS, in 1979, Johnson 10 was the first researcher to optimize the design of PMS, taking the PMS of front-drive applied car as the research object, with the natural frequency and energy decoupling rate as the optimization targets, optimize the related parameters, and achieved good results. Bernard and Starkey 11 applied “frequency shift method” to the PMS optimization design, reached the optimal frequency of natural frequency. Hafidi et al. 12 take the stiffness and location of PMS as design variables, designed the decoupling rate of PMS with three decoupling techniques, and improved the vibration isolation of PMS. For a model of 5-degree-of-freedom car, Nariman-Zadeh et al. 13 performed multi-objective optimization with genetic algorithms (GAs) and the optimization results obviously improve the vibration isolation performance. Moens and Vandepitte 14 established a dynamic model of truck, the sensitivity of each design parameter to the frequency response is calculated, and the research results can be used as a reference to guide the PMS design. Lee et al. 15 designed a PMS based on independent stiffness and frequency with the target of minimizing vibration.
In vehicle vibration applications, in 1982, Racca 16 considered the vibration isolation performance in terms of limiting the space, position, stiffness, natural frequency, and vibration decoupling of PMS, summarized the PMS fully in most sides. In 1984, Geck and Patton 17 from Ford Motor Company considered PMS together with a vehicle system, take all factors into consideration, improved the optimization design theory of PMS; in 1993, Bretl 18 believed that the ultimate goal of PMS design optimization is to minimize the body’s vibration response; in 2016, Shangguan et al. 19 analyzed and optimized the stiffness of the PMS based on a 13 degree-of-freedom model of the vehicle, and the results have been verified. In 2016, Y Shi et al.20,21 built the power system of a new kind of air-powered vehicle using hydropneumatic (HP) transformer as the pneumatic pressure boosting structure and hydraulic motor as the power unit, but it does not take into account the vibration isolation of the suspension system.
Although many scholars have done a lot of research work on the optimization design and vibration analysis of PMS, there are still some unresolved problems:
Their study relatively independent of the vibration analysis and optimization of the vehicle mounting system.
Most of the vibration analysis results only consider the engine excitation, but rarely consider the ground load excitation.
The optimization results of stiffness are lack of robustness analysis and should be pay more attention on engineering application.
The major contribution of this article is to optimize design methods for determining mount stiffness and considering vibration analysis of multi-excitation under excitation of engine and ground. First, take the front-drive powertrain as the research object22–24 and built the model with rigid body dynamics and energy method. Then, optimize the stiffness of the PMS through calculating and analyzing the decoupling rate and the corresponding modal frequency of PMS. When optimizing the design, the energy decoupling principle and GA are comprehensively used, and coupled with robustness analysis. Finally, verify the results with a variety of methods, and form an integrated design method of stiffness optimization design and vibration analysis in vehicle PMS.
Model of PMS
PMS, as a connection between the powertrain and the chassis of the car, plays the main role of supporting the powertrain, limiting the powertrain displacement, as well as isolated vibration excitation. The optimal design of the PMS is the key to improve the vibration performance of the vehicle.
Multi-body dynamics model of PMS
As shown in Figure 1, it is the multi-body dynamics simplified model (right) for the PMS (left). The PMS has three mountings, wherein the upper mounting is arranged above the transmission, the down mounting is arranged near the joint surface of the engine and the transmission, the left mounting is arranged on the left side of the engine. In the Cartesian coordinate system, the model simulates the actual powertrain by setting the corresponding mass and inertia properties. The structure characteristics of PMS are simulated by three bushing (red in the figure 1), and setting corresponding stiffness and damping characteristics.
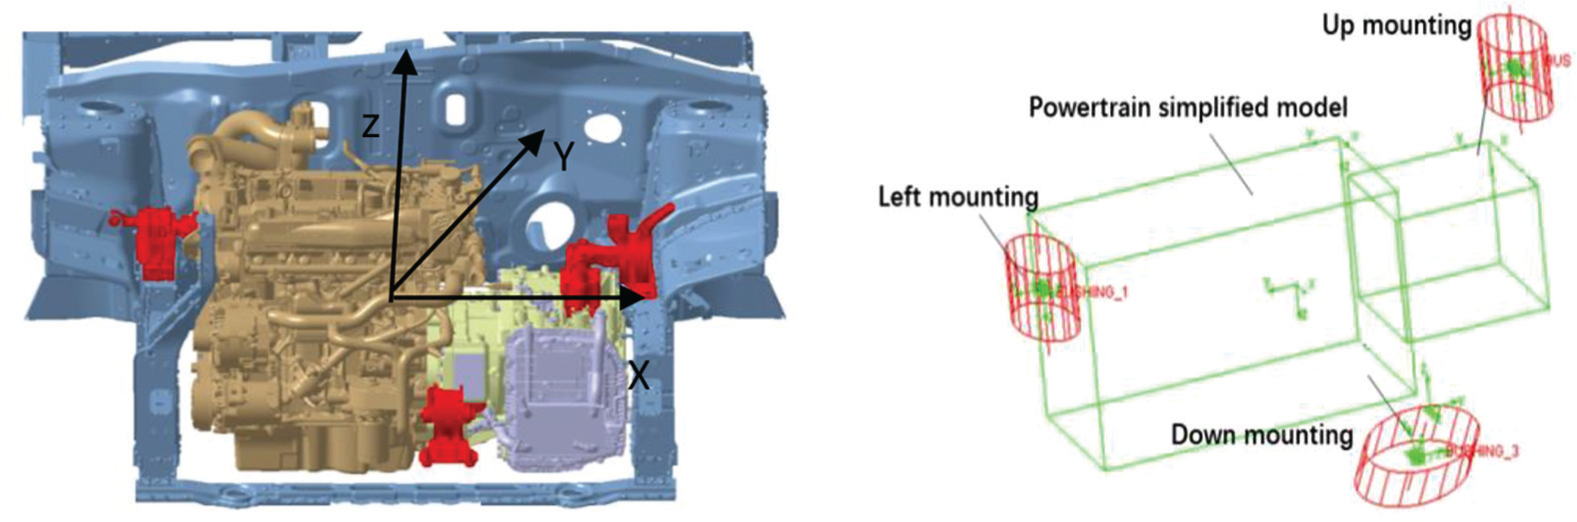
The prototype (left) and model (right) of PMS.
The mathematical model of the PMS and the energy method decoupling
It is considered that the vibration of the PMS is decoupled, if the vibration is independent in all directions after the PMS is excited in one or more directions. In fact, the vibrations are coupled with each other in the six directions when the PMS withstand the time-varying load, which results wider vibration frequency of PMS and seriously feel for passengers.
Express the PMS with a mathematical model, as shown in Figure 2. G0 is gravity center of PMS, and there are up mounting, down mounting, and left mounting. Every mounting have three freedom of translational movements in axis direction and three freedom of rotation movements around the axis.

Mathematical model of PMS.
From the viewpoint of energy conservation, the energy of a certain direction is switched to another direction while vibration coupling, but the value of total energy will keep constant. Obtain the energy distribution matrix of the PMS using the generalized energy and formation. The energy of the j in generalized coordinate express as following, while the PMS vibrate at the i order frequency
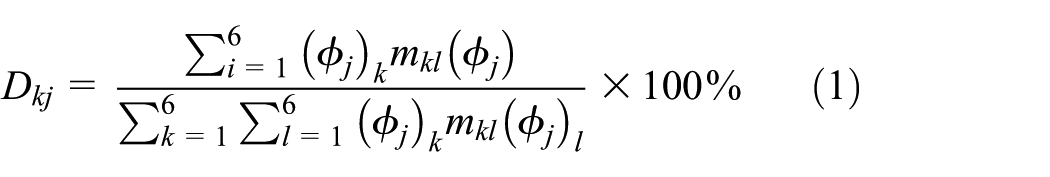
where
Therefore, the objective function of the energy method to decouple the PMS is in following
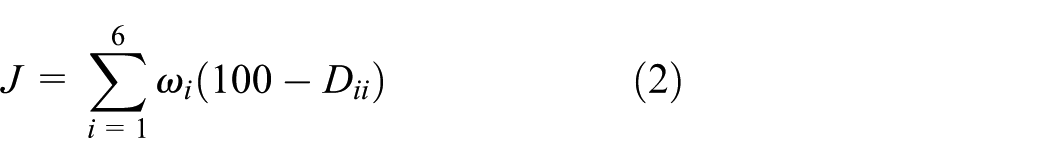
where
Vibration analysis of PMS
When the car is moving, under the excitation of the engine and transmission, powertrain will produce vibration, which caused big vibration on vehicle body transmitted by mountings, and resulting in bad comfort. Measure related input parameters of PMS before optimizing. The PMS is used in a passenger car; the mass of PMS is 252 kg. The coordinates of gravity center and mountings are shown in Figure 1 and Table 1.
Coordinates of gravity center and mountings.

The coordinate system is introduced as follows: the origin of the coordinate system is located in the intersection point of the engine and the transmission surface and the crankshaft. The X-axis is directed by the engine to the transmission in the crankshaft direction; the Y-axis is directed by the tail of the car; the Z-axis is upward along the vertical direction. Set the center of gravity as the coordinate origin, the relative positions of mountings are shown in Figure 3.

The relative positions of mountings.
The moment of inertia, stiffness values in all directions of PMS are shown in Tables 2 and 3.
The moment of inertia of the PMS.

PMS: powertrain mounting system.
The stiffness of each mounting of the PMS.

PMS: powertrain mounting system.
The decoupling rate and the corresponding frequency of PMS are calculated depend on the input data. The results are shown in table 4.
The decoupling rate (%) and the corresponding frequency of PMS with rigid body dynamics model.

PMS: powertrain mounting system.
From table 4, the vibration decoupling rate of PMS is smaller in the freedom of Z, Rxx and Ryy directions, the values are 78.05%, 70.53% and 80.28%. The difference between the modal frequencies of the second order and third order is small (8.33–8.11 = 0.22), which easily lead to the order of the vibration coupling. In the test of real car, there are shake occurs near to 1500 r/min. Therefore, the mountings need to be optimized.
In the meantime, based on equations (1) and (2), calculate mounting decoupling rate and the corresponding frequency, the results are shown in Table 5.
The vibration decoupling rate (%) and corresponding frequency of the PMS with mathematical model.
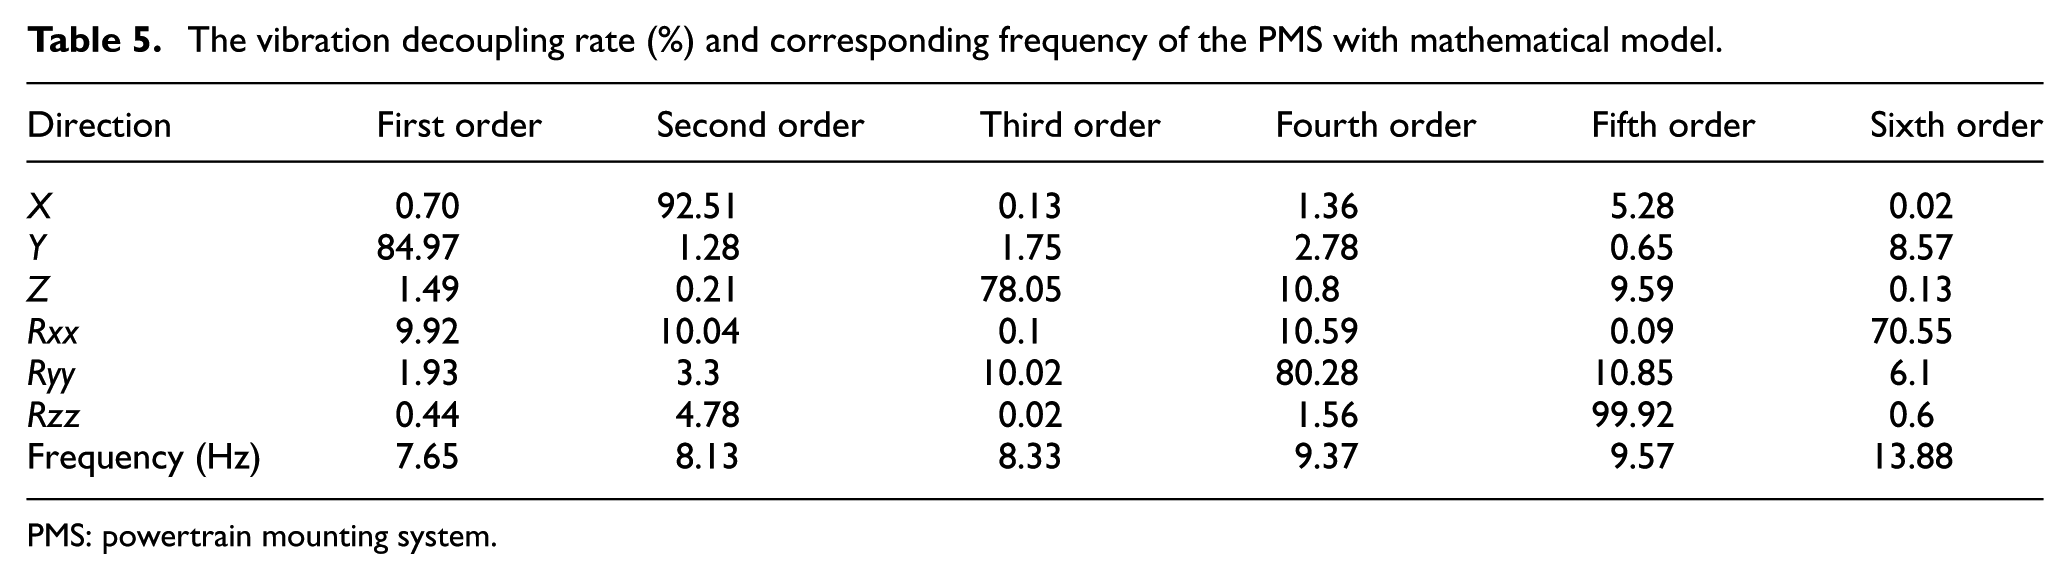
PMS: powertrain mounting system.
From tables 4 and 5, it shows that the results, calculated by rigid body dynamic method and mathematical energy method model, are the same. Therefore, we can use the method of the integrated program to optimize the stiffness of PMS.
Optimization design method of mounting system
After decoupling analysis of the PMS, we can see that there is still a lot of room for performance improvement of the decoupling rate and modal frequency, so the stiffness of PMS needs to optimize. When solving this kind of problem, the sequential quadratic programming (SQP) method that solves the constrained nonlinear optimization problem has good convergence and high computational efficiency, but its relative stability is poor. There are many global search optimization algorithms that target the minimum mean square error. The gradient descent and the simulated annealing algorithm (SAA) have all been used to optimize the model parameters of rubber suspensions. However, such traditional optimization algorithms are prone to fall into the local optimal solution and cause the optimization process to stagnate, and the GA can well solve this problem. The GA can be a good solution to the issues. GA is an optimization technology of practical, efficient, and robust,25–33 widely used in function optimization, automatic control, and other fields. GA is from “MATLAB” toolbox function. The objective function can be programmed to optimize calculation; the call format is as follows

where x is the optimal design variable value; fval is the objective value of the optimization; the exitflag is the reason why the iterative algorithm terminates. output is the iterative solution of the algorithm-related information; optfun to optimize the objective function m file; confun is a constraint function m file; nvars is the number of design variables; lb is the lower limit of the design variable; ub is the upper limit of the design variable; options is setting options of the structure parameters of GA function.
Model of optimization design
First, write the program with the energy method of the PMS. The program includes the informations of mountings position, rotation angle, stiffness, moment of inertia, mass, natural frequency, decoupling rate, vibration transmit rate. Optimize the stiffness by running this program. Optimization model is shown in Figure 4.

Optimization design model of PMS.
Design variables of optimization design
It is difficult to change the mass, moment of inertia, mountings position, and inclination, because of the vehicle is in a platform. The stiffness of mountings in 6 degree of freedom (DOF) can be adjusted easily. In addition, damping of mountings plays a role in accelerating convergence, it has little effect on the vibration results, so we don’t consider here.
Constraint condition
In order to obtain good effect of vibration isolation, setting constraints of decoupling rate >80% for all directions. Taking the layout of the power-train, the large vibration in the vertical direction (Z) and the rotation direction (Ryy) into account, set constraints of decoupling rate >85% for this two critical vibration directions. In addition, to avoid the adjacent order vibration coupling, setting the difference of modal frequency between adjacent orders >0.5 Hz.
Optimize design
The optimization process is divided into three steps: first of all, taking the mounting stiffness as the design variable, a first-level initial population is created within its design space. Then, taking the individual and mounting position parameters as interval variables within the first level of initial genus, index the second-level initial genus that is generated in variation interval to fitness function calculation. Finally, get a robust and reliable optimal solution through the iterative optimization calculation.
Objective function of deterministic optimization design
Setting the decoupling rates si (i = 1, 2,…, 9) and the corresponding modal frequencies Pi (i = 1, 2,…, 6) in 6 DOFs of the PMS as the optimization target. Optimization design of multi-variable and multi-objective is expressed in the following


where set m objective functions, the expression is
Robust optimization analysis
Although we can get the best stiffness value of mounting dynamic by optimization design, it is important to analyze the robustness based on the optimization results, because of the uncertainty of the manufacturing, installation, and measurement of PMS. Robust optimization transforms deterministic constraints into probability constraints, expresses design variables in some random distribution, so as to obtain the distribution of the objective function. The targets of optimization are to maximize the mean value of the optimization goal and minimize the variance. So that to reduce the sensitivity of optimization objectives to design variables, and to achieve the objective of robust design optimization.
The general expression of robustness optimization model is expressed in the following

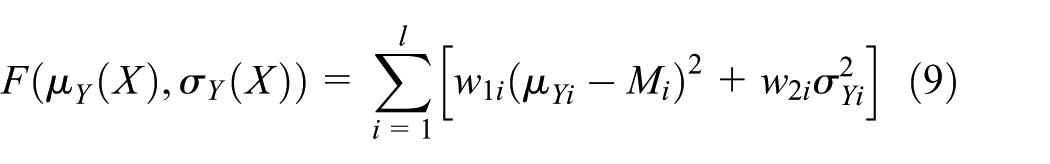

where XL and XU are the upper and lower limits of the design variable X, respectively; μX and σx are the mean and standard deviation of design variables X, respectively; YL and YU are the upper and lower limits of the design goal Y, respectively; μY and σY are the mean and standard deviation of design goal Y, respectively; m is the number of constraints; n is the number of σ levels; F(μY(X), σY(X)) is the objective function, including the mean and standard deviation of the target; w1i and w2i are respectively the weighting factors of mean and variance of the i design goal; Mi is the target value of the i design goal; and l is the number of design goals.
It is generally normal distribution of the dynamic stiffness of mountings in the normal manufacturing process. This content simulates the worst condition of average distribution of mountings and solves the actual distribution of the decoupling rate in the key direction.
Optimization results
As shown in Table 6, it is the decoupling rate and the corresponding modal frequency of optimized mounting system in all directions.
The vibration decoupling rate (%) and corresponding frequency of the PMS after optimized.

PMS: powertrain mounting system.
From Table 6, it is clear that the decoupling rate has been further improved after the optimization. The vibration decoupling rate in the Z and Ryy directions is >90%. In addition, the modal frequency distribution corresponding to each order is more reasonable.
Table 7 shows the optimized mounting decoupling rate and the corresponding frequency value in six orders corresponds to six directions. Compared to the optimization before, stiffness of mounting in all directions is more uniform and reasonable, so that it is conducive to the production.
The dynamic stiffness of PMS after optimized.

PMS: powertrain mounting system.
As shown in Figure 5, it is an average distribution of design variables (left) and result distribution of optimization targets (right). In the left part of the figure, setting the tolerance value of dynamic stiffness with ±10 for mountings, to simulate the requirements of accuracy in machining process. In the right part of the figure, it is the decoupling rate of the key orders obtained after the robustness analysis; majority of decoupling rates are >85%, which meet the requirements of robust design. It is proved that the optimization results are reliable in the actual processing.

Average distribution of design variables (left) and result distribution of optimization targets (right).
Vibration analysis
After optimization, a group of better dynamic stiffness values of PMS are obtained, analyze the vibration of PMS based on this stiffness values, compare with the pre-optimization results. In order to fully verify the improvement before and after optimization, analyze the vibration characteristics of PMS from the following three aspects:
Time domain analysis under the excitation of the powertrain;
Frequency domain analysis under the excitation of the powertrain;
Vibration response analysis under the excitation of ground load spectrum.
Time domain analysis under the excitation of the powertrain
Applying the reciprocating moment of inertia of the engine at the center of gravity of the PMS, judge the advantages and disadvantages of PMS by the acceleration amplitude when the transient response reaches the steady-state response. In Figure 6, it is the vibration acceleration in the vertical direction of the mounting before optimization (left) and after optimization (right).

The vibration acceleration in the vertical direction of the mounting before optimization (left) and after optimization (right).
There is transient excitation and larger vibration amplitude in the start point of PMS and tends to steady state during a period of time. The vibration acceleration value of the optimized suspension point was reduced from 0.65 to 0.13 m/s2, under the same moment of inertia of engine reciprocating. The amplitude of the vibration acceleration of the optimized mounting is obviously reduced, under the same moment of inertia of engine reciprocating. Correspondingly, the vibration displacement and supporting force in the vertical direction of the PMS are also greatly reduced. The details can be seen in Figure 7.
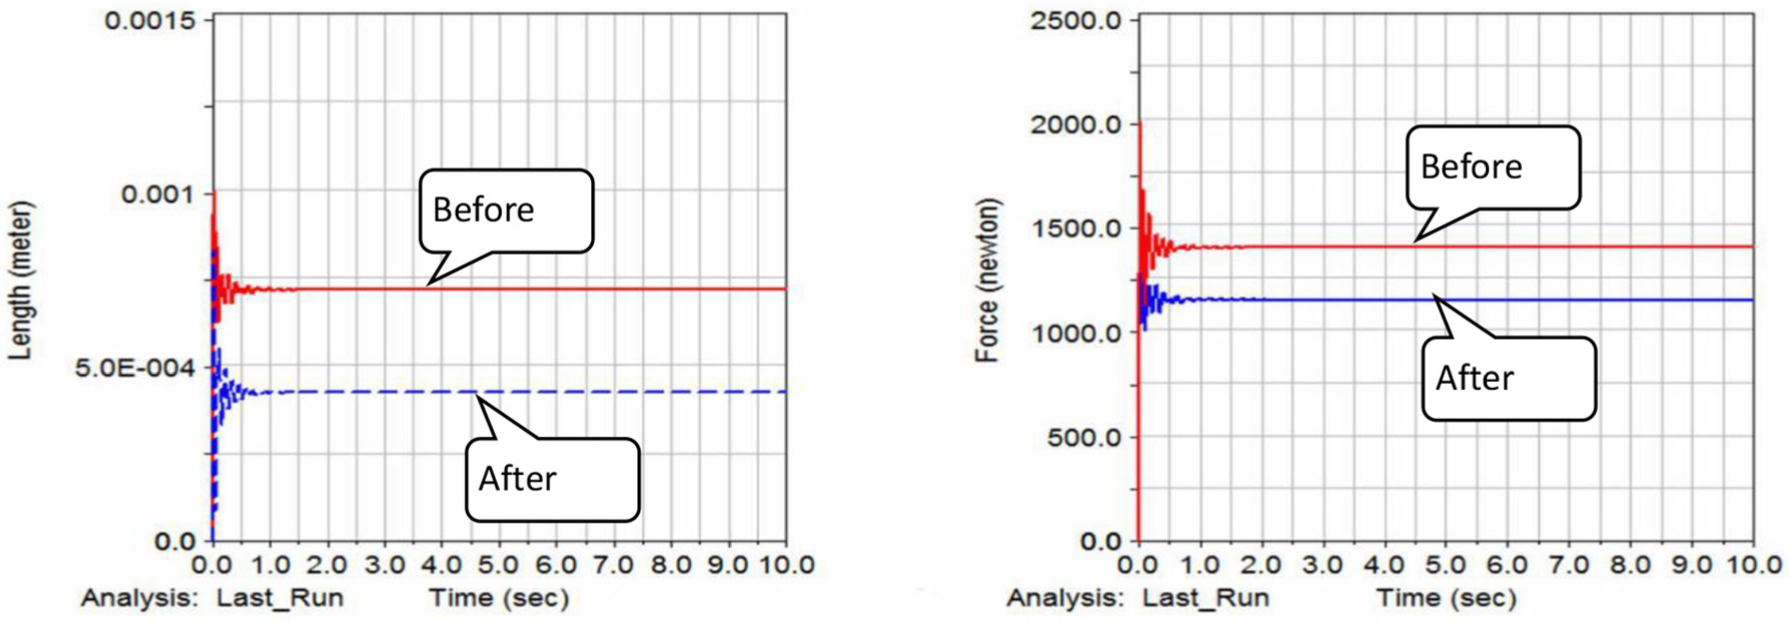
The vibration displacement and support force in the vertical direction of the PMS before optimization and after optimization.
Frequency domain analysis under the excitation of the powertrain
Applying the reciprocating moment of inertia of the engine at the center of gravity of the PMS, the acceleration of vibration amplitude of the PMS indicates the performance, the smaller, the better. Calculate the frequency response of the PMS. The frequency spectrum characteristic of vibration angular acceleration of the PMS before and after optimization is shown in Figure 8.

The frequency spectrum characteristic of vibration angular acceleration of the PMS before and after optimization under the excitation of the powertrain.
After optimization, the maximum frequency response significantly reduced in the frequency range of 5–15Hz; it is same as the analysis under time-domain.
Vibration response analysis under the excitation of ground load spectrum
Take the curve of power spectral density (PSD) to fast Fourier transform (FFT) in the form of acceleration to simulate the excitation spectrum of ground, applying the excitation at mountings, monitor the vibration amplitude at the center of gravity of the PMS. Calculate the frequency response of the PMS. The frequency spectrum characteristic of vibration angular acceleration of the PMS before and after optimization is shown in Figure 9.

The frequency spectrum characteristic of vibration angular acceleration of the PMS before and after optimization base on due to PSD of ground load.
After optimization, the frequency spectrum characteristic of vibration angular acceleration of the PMS significantly reduced in the frequency range of 0–10 Hz, and the peak moves to the left, which further weakening the possibility of interfering with the natural frequency of the PMS.
Test verification
It is easily to feel the effect of the optimization of PMS during speed up, speed down, or shifting time. Figure 10 shows that we have done the vibration test of the PMS in car with base band modem (BBM) equipment come from Müller-BBM Company, Germany. The red circle is the location of the test points.
Key date from the equipment:
Channel: 16;
Max. sampling frequency: 102.4 kHz;
Max. bandwidth: 40 kHz;
Accuracy: 24 bits;
Phase accuracy: <0.2° at 10 kHz.

Vibration test of PMS with BBM equipment.
As shown in Figure 11, in speeding up conditions, the result of after optimization is better than before.

The color map and sound pressure level of the vibration before and after optimization.
After optimization, vibration signal significantly weakened and sound pressure level decreased at the mounting. It is efficient to reduce the vibration which transmitted from PMS to the vehicle frame by optimizing the stiffness of the mountings.
Optimization design method of PMS
The optimization design method of PMS is established, and the method mainly includes three aspects. The flow route of optimization design method of PMS is shown in Figure 12:
The decoupling rate and modal frequency of PMS are calculated by two methods which are the rigid body dynamic method and the energy method. And checking each result by both methods, this can ensure the accuracy of the calculation results.
In order to obtain the optimal stiffness of the PMS, we integrated with GA, took the vibration decoupling rate and the difference of vibration frequencies of PMS as the optimization targets, considered the robustness of the optimization objectives which can ensure the practical value of the result.
Analyze the dynamic vibration response of PMS before and after optimization under multi-excitations including internal engine excitation and external ground/road excitation. At same time, the vibration acceleration, the support force, and amplitude–frequency characteristics of the mountings are analyzed, so it is easy to judge improve effect of vibration isolation for PMS.

The flow route of optimization design method of PMS.
Conclusion
On the basis of theoretical research, the models of rigid body dynamics and energy method of mounting system are established. The decoupling rate and the corresponding modal frequency of the model are calculated. Through theoretical research and numerical experiment analysis, the following conclusions are obtained:
The analysis model is checked in two ways. The calculation program of decoupling rate and modal frequency for PMS was proved to be correct, which can be integrated in optimization energy method to design the stiffness of PMS.
Optimization design of integrated robustness. The methods of GA and fusion robustness analysis are used to optimize the stiffness of the PMS, which can ensure that the results of optimization results not only are theoretical optimal solution but also are feasibility in practical application.
The effect of boundary frequency excitation on the natural frequency resonance of the suspension system is analyzed. Optimization results are verified under multi-excitation: engine excitation and ground excitation. Through the study of optimization design of PMS considering vibration analysis of multi-excitation, we find that the optimization methods can help to reduce the vibration and noise.
The optimization method has a certain guiding significance for the stiffness design of vehicle powertrain mounting components.
Footnotes
Handling Editor: Ito Kazuhisa
Declaration of conflicting interests
The author(s) declared no potential conflicts of interest with respect to the research, authorship, and/or publication of this article.
Funding
The author(s) disclosed receipt of the following financial support for the research, authorship, and/or publication of this article: This work is supported by National Natural Science Foundation of China (no. 51105017) and National Science and Technology Support Program of China (2011BAG09B00).