
Abstract
Colorized physical terrain models are needed in many applications, such as intelligent navigation, military strategy planning, landscape architecting, and land-use planning. However, current terrain elevation information is stored as digital elevation model file format, and terrain color information is generally stored in aerial images. A method is presented to directly convert the digital elevation model file and aerial images of a given terrain to the colorized virtual three-dimensional terrain model, which can be processed and fabricated by color three-dimensional printers. First, the elevation data and color data were registered and fused. Second, the colorized terrain surface model was created by using the virtual reality makeup language file format. Third, the colorized three-dimensional terrain model was built by adding a base and four walls. Finally, the colorized terrain physical model was fabricated by using a color three-dimensional printer. A terrain sample with typical topographic features was selected for analysis, and the results demonstrated that the colorized virtual three-dimensional terrain model can be constructed efficiently and the colorized physical terrain model can be fabricated precisely, which makes it easier for users to understand and make full use of the given terrain.
Keywords
Introduction
The term digital terrain model (DTM) is commonly used for the two-dimensional (2D) digital expression of terrain information, and digital terrain analysis (DTA) based on DTM data is an evolving technology with the development of computer-aided mapping (CAM) and geographic information system (GIS) technologies. Digital elevation model (DEM) is a subset of DTM, commonly used for expressing the elevation information of the terrain surface. In recent decades, with the basic theoretical issues of DEM having been solved, the theory and technology of DTA based on DEM data has been progressively moving to maturity and used in many applications. However, there are still deficiencies due to the unilateral consideration of elevation data. For instance, it is difficult to distinguish lakes from plains because their surfaces are both planar. Aerial images provide color information of terrain surfaces and can be a beneficial supplement for DEM data to make a more appropriate analysis. It will be convenient to make a distinction between lakes and plains when the color information is considered as well, for the color of lakes is usually blue or dark and the plains is commonly green or brown colored. Colorized terrain model is better than unicolor terrain model when used for intelligent navigation applications because additional color information in the colorized terrain model makes it easy to identify terrain type and extract topographical features, which contributes to fulfill efficient and accurate navigation.
The DEM data can be used to build virtual models using three-dimensional (3D) visualization technology. These virtual models are widely used in town planning, architectural designing, military strategy planning, intelligent navigation, and so on. In terms of intelligent navigation, C Boucher and JC Noyer 1 obtained a 3D map by fusing OpenStreetMap (OSM) road network and global positioning system (GPS)/DEM data through a nonlinear filter, which can be used for vehicle localization and route planning freely. S Chiodini et al. 2 performed a sensitivity analysis of the Visual Position Estimator for Rover (VIPER) algorithm using data and images provided by NASA Mars exploration rovers (MERs) and NASA Mars Reconnaissance Orbiter, which can be used to initialize the rover position after landing in a mars body-fixed frame and as verification of rover guidance and navigation outputs.
However, the demand for physical models still exists. The physical model is superior to the virtual model in the following aspects: first, physical models are more visible than virtual models because even a slight change in the physical model can be found easily; second, physical models provide more detailed information; and finally, physical models make it convenient for designers to communicate with each other.3,4 Terrain physical models are needed in many application domains of GIS technologies, such as watershed hydrological modeling, town planning, landscape architecture, land-use planning, transportation planning, military strategy planning, pipeline packing, and watershed and geological education. Physical terrain model is better than virtual terrain model when used for intelligent navigation applications, especially for verifying applications of costly or significant systems because the physical terrain model is more touchable and convincible.
Hand-made physical terrain models have been widely used in the planning and construction of some large-sized projects, such as home-building, land-use planning, and transportation planning. The use of hand-made physical terrain models can significantly reduce the total cost of large-sized projects. However, the fabrication of hand-made models costs too much time and money, and it is difficult for craftsmen to present every single detail exactly. Rapid prototyping (RP), also called 3D printing, is a kind of advanced manufacturing technology which builds physical models layer by layer in accordance with the computer-aided design (CAD) models. RP can make physical models, miniatures, and even final products by using a variety of materials such as plastic, nylon, polycarbonate, wax, sand, wood, gypsum, and metal. Compared with the hand-made models, RP technology fabricates physical models precisely and saves 50%–90% of cost. Moreover, the latest 3D printers can make colorized physical models, which express the topographic information more veritably. The Z-Printer650 machine produced by Z Corporation can present 390,000 kinds of different colors through five nozzles and make a physical model in high-resolution 600 × 540 dots per inch (DPI).
Color 3D printers generally use virtual reality makeup language (VRML) file format to fabricate colorized physical models. VRML file expresses the surface information of geometric models through a set of virtual nodes, and a colorized terrain model can be expressed by an ElevationGrid node and five IndexedFaceSet nodes. By contrast, the elevation data obtained by GIS are mostly stored as DEM file format, and the color data obtained by aerial vehicles are generally stored as tag image file format (TIFF) or joint picture group (JPG) file format. Therefore, when using color 3D printers to fabricate a colorized physical model, the registration of DEM data and color data should be executed first. Then a VRML model is generated by creating corresponding VRNodes. And the bidirectional tool paths are created by slicing the VRML model layer by layer. Finally, materials are added layer by layer to build a colorized physical terrain model.
Many researchers have tried to use RP techniques to make physical terrain models for different fields. Most of them transformed the GIS data to stereolithography (STL) file format and made unicolor terrain models, while a fraction of them attempted to fabricate colorful terrain models. Jacobs 5 converted a spatial data transfer standard (SDTS) file to a DEM file by using a GIS data convertor, and then, he used the Land Desktop and MAGICs RP to obtain an STL file. Agrawal et al. 6 used a global mapping algorithm to convert ASCII XYZ DEM data into STL surface data, which were downloaded into MAGICs RP to obtain a 3D STL file, and then, they built a physical terrain model by using the EOSINT P 380 machine. Modi et al. 7 proposed an approach to directly convert two kind of typical terrain data formats (surface mesh and ARC/INFO data) into STL file format. Agrawal et al. 8 wrote a C program to directly transform the ASCII data into STL file format. Jingbin et al. proposed a method to convert the DEM file of a given region directly to the 3D STL model, which can be processed and fabricated using the RP system. They eliminated the intermediate processes of data conversion and reduced the volume of the final STL model, which makes it faster and cheaper to fabricate the physical terrain model. 9 However, the STL file format is not suitable to store color information, and there are deficiencies for unicolor models to express the actual terrain.
Rase 10 created a polyhedral terrain model with color information by using the VRML file format, which was downloaded to the Z-Printer406 machine of Z Corporation to produce a physical terrain model. Rase 11 built several multicolored physical models using a color 3D printer to visualize conceptual surfaces derived from demographic and economic data, travel distances, and terrain in 2011. However, the height and color information Rase used was extracted from a contour map, the elevation data are approximate and the color data are different from the real color of the terrain surface. Bailey 12 attached an aerial photo to the STL file of the state of Oregon and created an enhanced version of STL that contains a series of added command lines to assign R, G, and B values of every triangle facet, and then, he downloaded the enhanced STL model into Z406 machine to produce a colorful physical model. The data size of the enhanced STL file Bailey created is so large that it greatly increased the processing time of follow-up works. Saldana and Johanson 13 presented a multiplatform workflow for the RP of multicolored historical cityscapes using GIS, procedural modeling, and interactive game development. But they did not take the actual color information into consideration.
The issue of registration of optical imagery with 3D laser detection and ranging (LiDAR) data is an increasing research topic and has given rise to a number of papers recently. A Zhang et al. 14 proposed an approach to use aerial images to localize the global positions of laser scans by creating an edge map from laser scans and registering the edge map with aerial images through the iterative closest point (ICP) algorithm. N Shorter et al. 15 proposed the use of phase correlation for the automatic registration of LiDAR data and aerial imagery. Palenichka and Zaremba 16 proposed a novel method based on transformation-invariant detection of salient image disks (SIDs) for automatic extraction of control points for the registration of optical images with LiDAR data. Parmehr et al. 17 presented a multivariable mutual information (MI) approach that exploits complementary information of inherently registered LiDAR digital surface model (DSM) and intensity data to improve the robustness of registration of optical imagery and LiDAR point cloud. Parmehr et al. 18 proposed a new approach for the registration of optical imagery with LiDAR data based on the theory of MI, which exploits the statistical dependency between same-modal and multi-modal datasets to achieve accurate registration. S Suri et al. 19 proposed a solely histogram-based method to achieve automatic registration within TerraSAR-X and Ikonos images over urban areas. The abovementioned researchers registered LiDAR data and color information and created colorful virtual models by using different techniques, but they did not discuss the fabrication of corresponding physical models.
This article presents a methodology to register the DEM file and aerial images of a given region and construct a colorized virtual 3D terrain model directly, which can be processed by color 3D printers to fabricate a colorized physical terrain model. A direct conversion program from DEM data and aerial images to VRML file was written for MATLAB software.
Materials and methods
Basic conceptions
DEM
A DTM is a 2D discrete function of a morphometric variable, which defines the topographic surface as a set of values. Among DTMs are DEMs, digital models of slope gradient, horizontal curvatures, and other topographic attributes. 20 There are four freely available sources of DEM data: Shuttle Radar Topography Mission (SRTM) DEM, Advanced Spaceborne Thermal Emission and Reflection Radiometer Global Digital Elevation Model (ASTER GDEM), Global Multi-resolution Terrain Elevation Data (GMTED) 2010 DEM, and United States Geological Survey (USGS) DEM. USGS DEM is a traditional format produced by USGS, and it is still popular now due to large number of legacy files and broad, mature software support. There are five typical examples of USGS DEM: 7.5-min DEM, 30-min DEM, 1-degree DEM, 7.5-min Alaska DEM, and 15-min Alaska DEM. This article uses 7.5-min USGS DEM as a uniform format of the DEM files for the subsequent processing.
Aerial images
Aerial images can provide color information and enable users to understand and utilize the information describing the characteristics of the terrain, which is a beneficial supplement for DTA. Due to technical limitations, there is a contradiction between the scale and resolution of aerial images, especially for large-sized terrains. Compared with large-scale aerial images, the small-scale aerial images include a much larger amount of topographic information and are more likely to be matched with DEM file by registering their edge maps; unfortunately, the color information of such image is often indistinct and inaccurate. However, image stitching has been a hot topic in the field of image processing and a large number of related algorithms and papers were presented in recent years.21–23 This article stitches the large-scale aerial images as an intermediate step to matching the true color information in high resolution and DEM data of a given region.
VRML
VRML represents an open and flexible platform for creating interactive 3D scenes (virtual worlds). In VRML, a 3D scene is described by a hierarchical tree structure of nodes (as shown in Figure 1). Every node in the tree represents some functionality of the scene. There are 54 different types of nodes. Some of them are shape nodes, and some of them are grouping nodes used for holding child nodes. Each node contains a list of fields that hold values defining parameters for its function. In this article, an ElevationGrid node and five IndexedFaceSet nodes are defined to create a colorized virtual terrain model.

Hierarchical tree structure of VRML file format.
Methodology
The whole process of colorized physical terrain modeling from DEM and aerial images can be divided into four major steps: data acquisition, data fusion, VRML file generation, and physical model fabrication. A program was developed by using MATLAB software to convert USGS DEM and aerial images directly to a colorized 3D VRML file. All the large-scale aerial images with high-resolution color information were jointed together into a single image, which covers the complete topographic information and can be registered with the DEM data based on terrain features. Then an array including the location, elevation, and color information of every physical point was obtained by resampling, which contributed to the creation of the colorized virtual 3D terrain model. The virtual model was downloaded into a color 3D printer to fabricate a colorized physical terrain model, which can be used to verify the effect and quality of the above transformation.
Data acquisition
Two types of data source are needed in this study: the grid-based DEM file of a given region and a series of large-scale aerial images.
The grid-based DEM file can be downloaded freely from several opened databases, and a more accurate one could be obtained from the local government. The downloaded DEM file usually covers 1° × 1° in geographic coordinate system and has various formats, which should be processed by Global Mapper to create the corresponding USGS DEM file of the selected region.
The corresponding aerial images of the given region can be acquired by aerial vehicles. The flight path of the aerial vehicle should be planned to cover the whole region. Parameters of flight height, flight speed, and exposure frequency should be preset to get high-resolution aerial images.
Combination of DEM data and color information
The combination of DEM data and color information can be divided into three steps: image stitching of all the large-scale aerial images, registration of DEM data and the composite image, resampling of the RGB values of elevation points.
Step 1: stitching all the large-scale aerial images into a single one.
An image stitched by two large-scale aerial images is shown in Figure 2. However, there are distortions between the composite image and the orthophoto of terrain, a simple affine transformation (scale, translation and rotation) is not able to register the composite image and DEM perfectly. Therefore, this article proposed a method to extract the edge maps of DEM and the composite image and then correct the edge map of the composite image on the basis of the edge map of DEM. Finally, the transform formula from the corrected composite image to the DEM file can be calculated out by executing an affine transformation.
Step 2: obtaining the coordinate transform formula from the composite image to the corresponding DEM file.

An image stitched by two aerial images.
The geometric registration of DEM data

A simplified island terrain was created to demonstrate the detailed register processes of DEM data and the composite image, which is shown in Figure 3. The simplified terrain is a green quadrangular island surrounded by blue sea, and the detailed register process is as follows:
Extracting edge maps of the composite image and DEM file. In the case of simplified island terrain, the edge map of the composite image can be obtained by extracting boundary points that separate different colors and connecting them, the edge map of the DEM file can be obtained by extracting the border lines of the area that have greater elevation values than sea level. The thresholds were given by users or default.
Simplifying the edge maps by removing unimportant corner points. A parameter sc was defined to measure the shape contribution of every corner point to the edge map, the calculation formula of sc can be expressed by equation (2). A threshold mn was defined to limit the minimum number of corner points, which can be given by users or default. Those corner points with smaller sc values should be removed iteratively on the limitation of mn. In order to increase the efficiency, the iterative process was divided into two parts. Half of the corner points should be removed when the number of total corner points is greater than


Registration of the composite image and corresponding DEM data.
For each corner point, the parameter
3. Correcting the edge map of the composite image on the basis of the edge map of the DEM data. Two pairs of corresponding border lines were selected by users or default to set up connections between the edge maps. Then the edge map of the composite image can be corrected into a similar polygon of the edge map of DEM file.
4. Calculating out the transform formula from the corrected edge map of the composite image to the edge map of DEM file by executing an affine transformation, this can be expressed by equation (3)

In the above equation

Step 3: obtaining color information of every elevation point.
Equation (3) established connections of every single elevation point in the DEM file and a specific pixel point in the true color image, and then the colorized DEM can be obtained by resampling, which is stored as an
For every single physical point, the

Assume that the four surrounding pixel points of a specified physical point

Where
Generation of the colorized virtual 3D terrain model
In order to generate the colorized virtual 3D terrain model of a given terrain, an ElevationGrid node should be created first; second, creating the terrain surface by defining the field point of the ElevationGrid node; third, adding color information to the terrain surface by defining the field color of the ElevationGrid node; finally, adding a base and four walls of terrain by creating five IndexedFaceSet nodes to build a complete model. The unicolor terrain surface model and colorized terrain surface model are shown in Figure 4.

Virtual terrain surface models: (a) unicolor terrain surface model and (b) colorized terrain surface model.
One IndexedFaceSet node should be created and the field point should be defined to build the base of terrain model. The corner points of base correspond to the corner points of surface. The corner points of base have the same x and z values with their corresponding corner points of surface. The y value of a corner point of base equals to the y value of its corresponding corner point minus h, where h is set by users to indicate the minimum height of elevation points in the final physical model. The base of the virtual terrain model is shown in Figure 5(a).

Base and one of the walls of the virtual terrain model: (a) base and (b) one of the walls.
Four IndexedFaceSet nodes should be created and the field point should be defined to build the walls of terrain model. Each wall is corresponding to a boundary line of the surface and a boundary line of the base. Therefore, a wall can be built by extracting the points of the corresponding boundary line of the surface and the endpoint of the corresponding boundary line of the base and connect them in sequence. One of the walls is shown in Figure 5(b) and the complete colorized virtual 3D terrain model is shown in Figure 6.

Colorized virtual 3D terrain model.
Fabrication of the colorized physical terrain model
In order to fabricate the colorized physical terrain model, the Z-Printer650 machine of Z Corporation was used, which is shown in Figure 7. This machine has a large build volume of 254 mm × 381 mm × 203 mm, a quick build speed of 2–4 layers per min, and a high print resolution of 600 × 540 DPI. The complete-process of physical terrain model fabricating by using Z-Printer650 is as follows:
Open and transform the colorized VRML file in ZPrint.
Slice the virtual model layer by layer.
Print the physical model layer by layer.
Dry the physical model.
Place the physical model in the post-processing unit to remove remaining powder.
Strength the physical model by using the Z-Bond instant infiltrant.

Z-Printer650 machine.
Case study
In order to verify the feasibility of the above method and program, a typical region of Tajikistan was selected for analysis, which covers the area from (41.715°N, 72.71°E) to (41.782°N, 72.80°E) and the resolution was assigned to be 30 m. The data set of ASTER GDEM V2 that contains this area numbers as ASTGTM2_N41E072, which was downloaded from the geospatial data cloud of China (http://www.gscloud.cn). Then the ASTGTM2_N41E072 DEM file was processed by the Global Mapper to export an USGS DEM file with the specified coverage. The ASTGTM2_N41E072 DEM file and the USGS DEM file in visualizations of Global Mapper are shown in Figure 8. The small images that contain precise color information were obtained by an aerial vehicle, stitched together into a large one (as shown in Figure 9). The USGS DEM contains
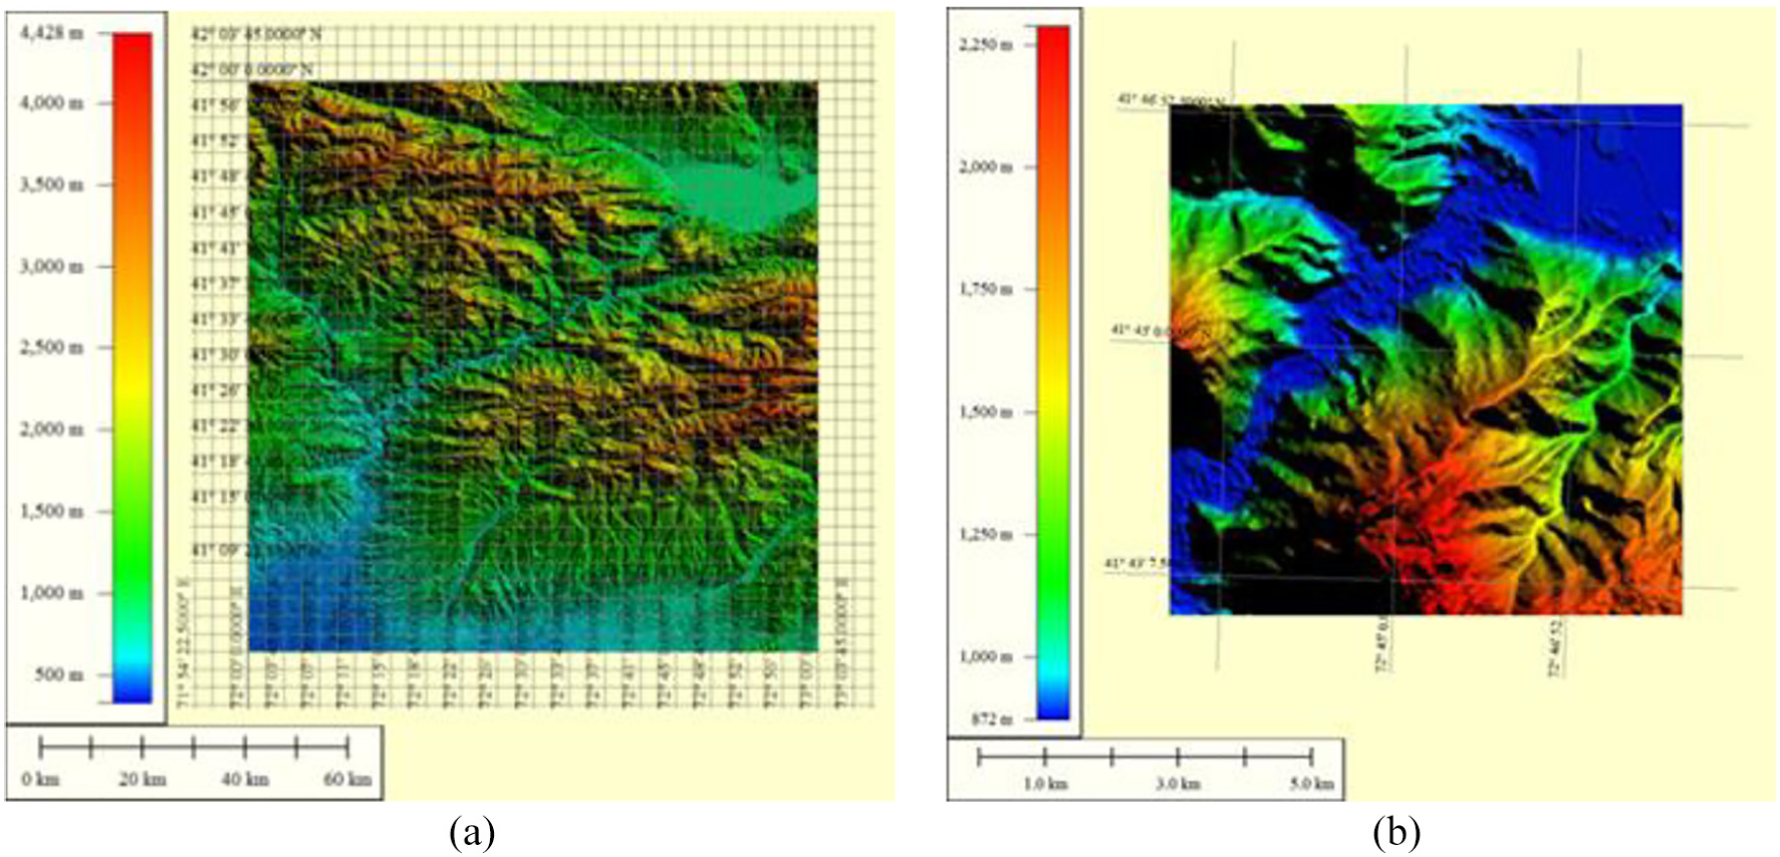
DEMs in visualizations of Global Mapper: (a) the ASTGTM2_N41E072 DEM file and (b) the USGS DEM file of given region.

Small aerial images and the stitched large-sized image: (a) small aerial images and (b) the stitched large-sized image.
The colorized virtual terrain model with a .wrl suffix was obtained by importing data sources and running the program, its file size is 5.13 MB. The virtual scene of the colorized virtual 3D terrain model is shown in Figure 10. Then the virtual model was downloaded into the Z-Printer650 machine to fabricate a physical model, which is shown in Figure 11. The colorized physical terrain model expresses both the topographic information and true color information, which makes it easier for users to understand and make full use of the description of the given region. The colorized physical terrain model is very suitable for the verifying applications of costly or significant intelligent navigation systems such as verification experiments of intelligent vehicle navigation in complex terrains.

Colorized virtual 3D terrain model.

Colorized physical terrain model.
In order to demostrate the accuracy of the projection algorithm from composite aerial image to DEM data, a parameter q was defined to measure possible color errors of elevation points. The computational formula of q can be expressed by equation (6)

In the above equation, variable e is the color difference value of the interpolated color data of a physical point and the color data of one of its four surrounding pixel points. Variable d is the distance of the projection point of a physical point and one of its four surrounding pixel points. The computational formula of


The number of elevation points that have the same level of q values are computed and displayed in Figure 12. It is obvious that most elevation points have low possible color error values (less than 10), which demostrate the high accuracy of the developed projection algorithm.

Possible color error values of elevation points after projection.
Discussions
The proposed method attempts to create a colorized virtual 3D terrain model by combining DEM data and color information. The generated VRML file contains both elevation data and high-resolution color information, which can be downloaded into the Z-Printer650 machine to fabricate a colorized physical terrain model. In comparison, the traditional method of colorized physical terrain modeling is to fabricate a unicolor physical model by using the STL model first and then attach the color information from given images on the surface of unicolor physical model directly, without the matching process.
Compared with the proposed method, the traditional method combines the elevation data and color information by using a simple and unintelligent way, which might lead to imprecise colorized terrain surface because the image and DEM file cannot always fit each other without undertaking a registration process. In order to demonstrate the advantage of the proposed method, this article takes three basic topographical areas (mountainous area, water area, and valley area) in four situations to compare their effects: (1) a rotation error of 5° exists around the center point of DEM between DEM file and image; (2) a rotation error of 10° exists around the center point of DEM between DEM file and image; (3) a translation error of 1/10 of the length of DEM exists between DEM file and image; and (4) a translation error of 1/5 of the length of DEM exists between DEM file and image. The used topographic areas are shown as Figure 13. A parameter p was defined to measure the deviation rate between the obtained color data and the intrinsic color data of each elevation point. The computational formula of p can be expressed by equation (9)


Three basic topographical areas in the initial state: (a) mountainous area, (b) water area, and (c) valley area.
The quantitative proportions of elevation points that have the same level of p values are computed and displayed in Figures 14–17. In these figures, purple, green, and yellow colors represent the mountainous area, the water area, and the valley area, respectively, and the left and right of figures represent the proposed method and the traditional method, respectively. The values of the horizontal axis represent the deviation rates p, which were divided into a serial of intervals. The values of the vertical axis represent the quantitative proportions of elevation points that have the same level of p values in the total elevation points. Due to the matching process, the color deviation rates of elevation points processed by the proposed method equal to zero theoretically. And values of the color deviation rates of elevation points processed by the traditional method range from zero to positive infinity because there is no matching process, just a simple attaching operation. The numbers of elevation points that have the same level of p values are shown in Table 1.

A rotation error of 5° around the center point of DEM between DEM file and image.

A rotation error of 10° around the center point of DEM between DEM file and image.

A translation error of 1/10 of the length of DEM between DEM file and image.

A translation error of 1/5 of the length of DEM between DEM file and image.
The numbers of elevation points that have the same level of p values.

It is worth noting that the traditional method inevitably fabricates inaccurate colorized physical model while there are position errors between the DEM and image, which might result in incorrect understanding and faulty decision-making. On the contrary, the proposed method is able to register the DEM data and color information of given terrain and create a 3D VRML model with true color information, which can be used to fabricate a precise colorized physical terrain model.
Conclusion and future scope
This article proposed a method and a conversion algorithm that can convert the USGS DEM data and aerial images of a given region into a VRML model, and developed corresponding program by using MATLAB software, which can be used to register the elevation data and true color information and create a colorized virtual 3D terrain model. A typical region of Tajikistan was selected for verification, all the small aerial images of this region were stitched into a large-sized one, which was registered and fused with the USGS DEM data and created a colorized virtual 3D terrain model, proving the effectiveness of this convert program. The virtual model was downloaded into Z-Printer650 machine to fabricate a colorized physical terrain model, which contains both the topographic information and true color information, and make it easier for users to understand and make full use of the given region. Three basic topographical areas in four situations were taken to make comparisons, and the results demonstrated the advantage of the proposed method relative to the traditional colorized physical terrain modeling method.
Follow-up studies will pay attention to researching a simplified method of colorized virtual terrain model to reduce the data volume and processing time.
Footnotes
Handling Editor: Zhixiong Li
Declaration of conflicting interests
The author(s) declared no potential conflicts of interest with respect to the research, authorship, and/or publication of this article.
Funding
The author(s) disclosed receipt of the following financial support for the research, authorship, and/or publication of this article: This work was supported by the National Natural Science Foundation of China (grant nos.: 51305443 and 51475459), the Natural Science Foundation of Jiangsu Province (grant nos.: bk20130184 and bk20160258), the State Scholarship Fund of the China Scholarship Council (grant no.: 201706425017), the Fundamental Research Funds for the Central Universities (grant no.: 2012QNA27), and a project funded by the Priority Academic Program Development (PAPD) of Jiangsu Higher Education Institutions.