
Abstract
This article presents a two-step approach for structural damage identification in beam structure. Damages are located using the influence line difference before and after damage, the calculation of damage severity is accomplished by acceleration data and bird mating optimizer algorithm. Local damages are simulated as the reduction of both the elemental Young’s modulus and mass of the beam. The technique for damage localization based on displacement influence line difference and its derivatives for beam structure has been outlined. An objective function that comprises dynamic acceleration is utilized in bird mating optimizer. All data are originated from only a few measurement points. Two numerical examples, namely, a simply supported beam and a four-span continuous beam, are investigated in this article. Identification results from different objective functions are compared with results from objective function conventional modal assurance criterion, which shows the superiority of the proposed function. In addition, results of dynamic responses under different types of excitation are presented. The effect of measurement noise level on damage identification results is studied. Studies in the article indicate that the proposed method is efficient and robust for identifying damages in beam structures.
Keywords
Introduction
It is well known that structures are suffering from all kinds of damage problems due to both the unpredictable internal and external factors that jeopardize the safety of the structure; thus, a reliable structural damage identification method is needed.
Generally, damages are quantified by the reduction of stiffness parameter,1,2 which affects the dynamic property of the structure, such as natural frequencies and mode shapes. In the last few decades, many damage identification methods had been developed using the vibration data in frequency domain. Cawley and Adams 3 first localized the damage from natural frequency of structure. Pandey et al. 4 and Rizos et al. 5 identified the local damage by curvature of mode shapes. And flexibility of structure6–9 is also used. Lee 10 applied frequencies in iteration to detect the location and severity of damages. Zhong and Oyadiji 11 detected damages by combining wavelet and modal data. On the contrary, a great deal of methods based on data in time domain had also been developed. Majumder and Manohar 12 proposed a time domain approach for beam structures using vibration data. Zhu and Law 13 applied wavelet to deflection of time history to identified damages. Law and Lu 14 proposed a method based on dynamic response and later presented response sensitivity–based model updating method to identify structural damage and parameter.15,16 Recently, Khorram et al. 17 combined wavelet and factorial design to detect the crack from moving load responses. In addition, two-step approach was developed by Lu et al. 18 Based on curvature of mode shape, the crack location is predicted by a damage indicator, and then response sensitivity–based model updating is applied to identify the crack depth and location further. More recently, a two-step method based on modal strain energy and response sensitivity extended to identify the damages in isotropic plates by Fu et al. 19
In mathematical aspect, damage identification problem can be regarded as an optimization problem that aims to find the optimal solution of an objective function which manifests the difference between real structure and simulation. When adopting conventional methods to solve these problems, it is easy to reach a local optimum and are sensitive to initial value. More attention was paid in heuristic algorithm these years, Wu et al. 20 is among the earliest one who detect damage using neural network, and the method was developed further later.21–23 Majumdar et al. 24 assessed damage of truss from changes in natural frequencies using ant colony optimization (ACO). Maity and Tripathy 25 used genetic algorithm (GA) to identify the damage from changes in natural frequencies, and Ravanfar et al. 26 utilized GA as the second step in his two-step method to assess the severity of the damage. Mohan et al. 27 compared the particle swarm optimization (PSO) and GA in the efficiency and accuracy of identification. Seyedpoor 28 developed a two-step method using PSO for damage identification. Sokhangou et al. 29 made use of pseudo-residual force vector to determine the damage element, and then applied gravitational search algorithm (GSA) to get the damage extent. Chaotic artificial bee colony (CABC) algorithm derived from artificial bee colony (ABC) was used to detect damage by Xu et al. 30
A new heuristic algorithm named bird mating optimizer (BMO) was proposed by Askarzadeh31,32 and Askarzadeh and Rezazadeh33,34 recently, which imitates the mating behavior of birds. The algorithm was simulated and compared with GA, PSO, and GSO 31 and had better accuracy, Askarzadeh further estimate parameters with the most influence on the electrochemical model, 32 modeled the fuel cell system, 34 and extracted the maximum power point in solar cells. 33 Li et al. 35 utilized the method in damage to optimize the objective and optimum set of stiffness reduction parameters. Zhu et al. 36 designed a disturbance procedure in BMO which enhances the precision of damage identification.
As it is mentioned above that some two-step approaches are applied in damage identification area, the localization of the damage greatly reduces the parameter dimension, which greatly reduces the amount of calculation; hence, the efficiency will improved. Seyedpoor 28 localized the damages from modal strain energy–based index and assess them through PSO. Sokhangou et al. 29 used pseudo-residual force vector to determine the damage element. Grandić et al. 37 used the change in the rotation of displacement influence lines to indicate damage. Wang and colleagues38,39 located and quantified damage by strain statistical moment in both beam and plate structure.
In this article, a two-step method for damage identification is proposed. Displacement influence line will be utilized to determine the damage location, which is conducted by difference quotient in finite element model. Then, the damage is quantified using BMO in the second step. An objective function is established by minimizing the discrepancies between the simulated “measured” dynamic acceleration responses and calculated ones using direct integration. As only a few number of measurement points are needed, and it has the advantages making of plenty of time domain data, it is convenient in practical applications. A simply supported beam and a four-span beam are studied to show the promising results of the method, and the influence of measurement noise on damage identification results is also investigated in the numerical simulations. In addition, comparison among the proposed objective function and other objective functions consisted of modal assurance criterion (MAC) and dynamic displacement is conducted to validate the superiority of the dynamic acceleration–based objective function.
Damage detection methodology
Damages are normally defined as the deduction of stiffness, beside they can be simulated in many forms. As it is shown in Figure 1, a rectangular portion of the cross section was hollowed out, and this damage will cause the stiffness to reduce and mass loss. Given this premise, we can quantify the local damage as the reduction of both stiffness and mass in some parts.

A damage model with rectangular crack.
Damage model construction
In this article, analytical models of beam structures are established by finite element method (FEM). When damage occurred in a structure, the extent of reduction in stiffness and mass can be represented by elemental damages with parameters

where
Now, the free vibration equation of damage beam is acquired

where
And the natural frequencies and the associated mode shapes can be obtained from the following eigen equation

where
Localization of the damage by influence line difference
The reduction of stiffness and mass will cause deviation in responses of the structure. In a beam structure with length

where
If we assume that there is a damage existing in the beam between
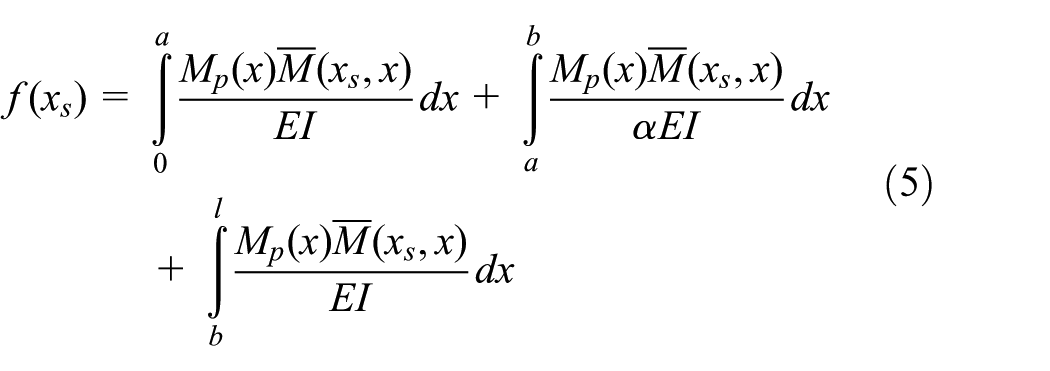
Subtracting equation (5) by equation (4), we obtain the following
If we set the external force

Judging from the integral range of equation (7), the value of
where

The change of bending moment before and after a force is through the point.
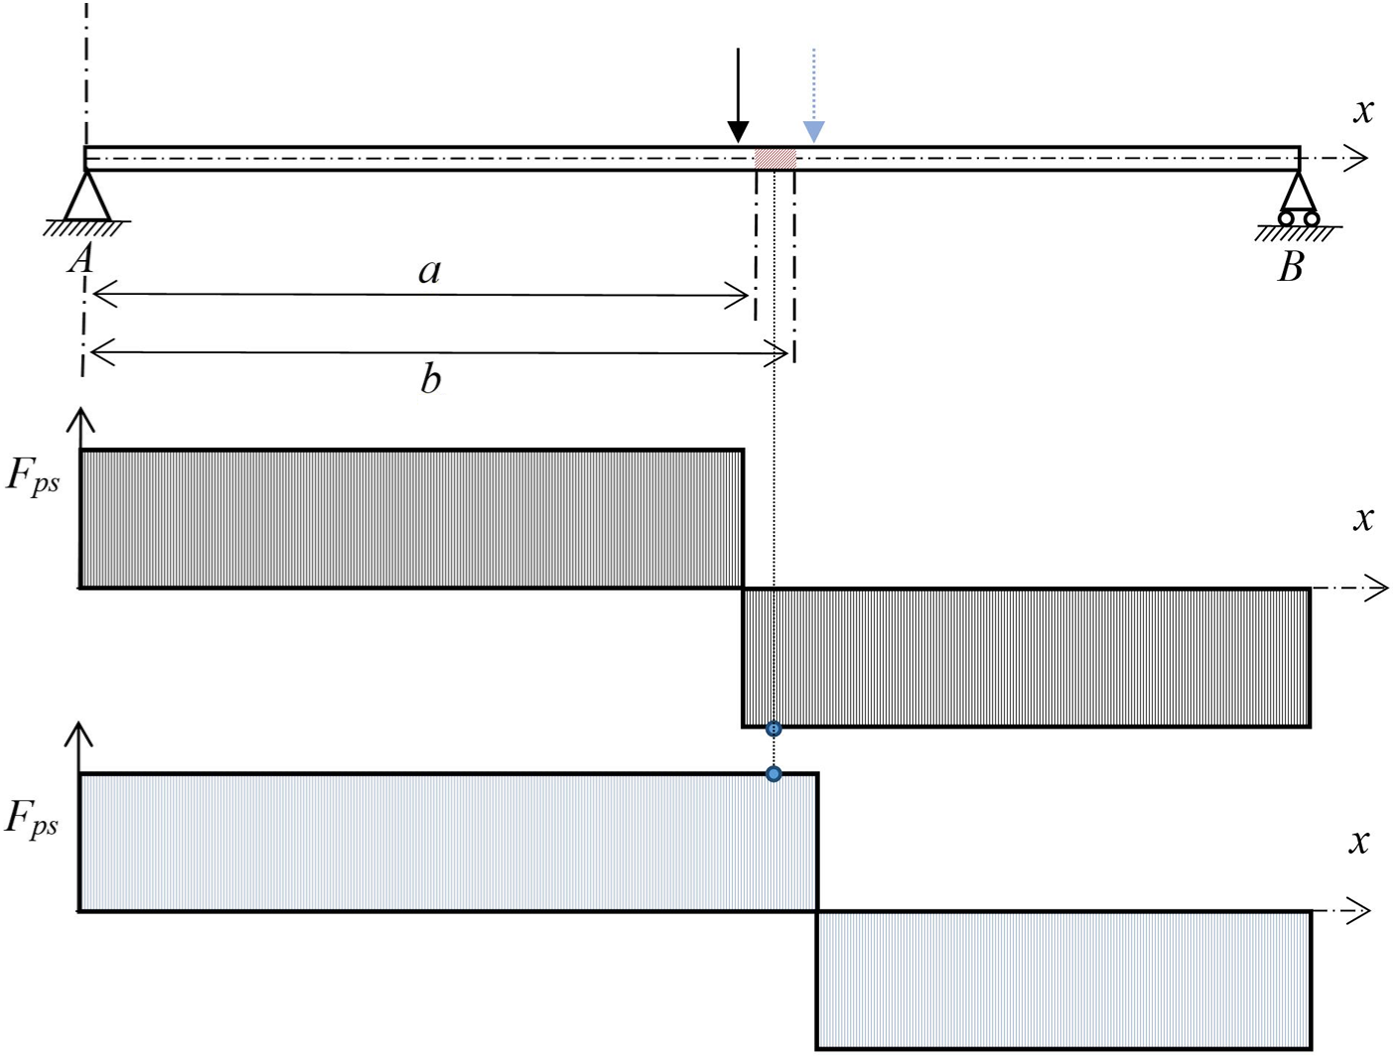
The change of shear force before and after a force is through the point.
For a structure with multiple damages, the values of
where
To further calculating the DILD in discrete model, forward difference quotient scheme is applied, and DILD values are calculated by equation (10)

where
One can further specify the change of DILD by taking derivative to DILD with respect to xp again. In the analytical FE model, the second-order central difference quotient is used to calculate the second derivative. Difference quotient of DILD (DDILD) is calculated in equation (11)

And it is obvious that the value of DDILD will not be zero if the corresponding point is damaged.
Note that in this study, a damage is assumed as an elemental damage associated with two nodes; on the contrary, the values of
Objective function for detection assessment
Since the localization of the damages by DDILD is based on the affection of the stiffness damage but not the mass damage, the DDILD values is not available on damage level assessment. Normally, the damage identification problem can be numerically transferred into an optimization, the goal is to minimize the difference of property between simulated and actual structure.
Damage always results in changes of property in structure, responses such as vibration frequency, mode or dynamic responses, are frequently used in damage identification.
MAC, as shown in equation (12), is usually the object function in damage assessment, where

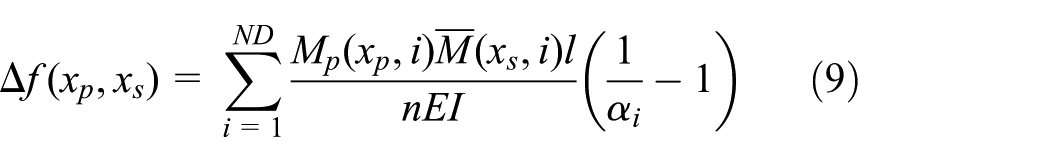
In addition to data from frequency domain, there will be influences on dynamic responses in time history to change, such as acceleration that contains numerous damage information. To node number

By measuring the deviance of acceleration responses between actual and calculation in the form of MAC, function accMAC is defined as follows

where the superscripts

Where
So the goal is to minimize equation (15). Compared to taking the least-squares of deviation between simulated and actual responses, accMAC prevents the inconformity of two acceleration vectors because acceleration with larger absolute values would weigh heavier in least-squares scheme.
BMO
BMO is an evolutionary algorithm proposed by Alireza Askarzadeh, which imitates the breeding behavior of bird spices, and its core idea is to pass on superior genes to next generations.
In this algorithm, a feasible solution is called a bird, and there are two kinds of birds in a society, male and female. The breeding process is equivalent to searching process in the algorithm. Individuals are categorized into five mating patterns judging by sex and gene quality, with two for female and three for male. Their traits to produce offspring are introduced as follows.
Monogamy
A monogamy male bird

where
Polygyny
A polygyny bird has several interested female birds and the resultant brood

where
Parthenogenesis
The best solutions play the role as parthenogenetic birds. Each parthenogenetic bird produces a brood by the following equation

where
Promiscuity
Promiscuity birds mutated from birds with worst genes judging by the fitness function; this group is produced by chaotic sequence. And the way they breed is the same as that for monogamous birds, that is, equation (16).
Polyandry
In this group, each female will mate with several males, so the resultant brood is produced by equation (17) too.
After every mating process, the fitness values of all the resultant broods are evaluated through a fitness function, the group with better individuals will substitute the worse one and prepare to breed the next generation.
Damage detection procedure
Based on BMO algorithm and in combination with the influence line difference, the damage identification procedures are shown as follows, also illustrated in Figure 4:
Step 1. Measurement: The influence line before and after the damage (deflection data) and responses of the damaged structure are measured and recorded.
Step 2. Localization: Using influence line difference data and calculated DDILD to localize the damage position, a few times of measurements can be applied till a stable trend is eminent in the curve, and the damaged elements are selected.
Step 3. Initialization: A set of damage parameter vectors with dimension of damage number are randomly set in the searching space
Step 4. Ranking: Each parameter vector ranks according to the corresponding gene quality judging by the fitness value.
Step 5. Classification: Vectors with the best fitness value are selected as female birds and the others are chosen as males and the ratio will be preset in the simulation. There is a ratio 50:30:10:5:5 31 to monogamy, polygyny, parthenogenesis, polyandry, and promiscuity recommended by the author. Then females are equally divided into two groups that the better ones make parthenogenetic birds and the others make polyandrous group. The males are categorized into three groups. The males with better quality are selected as monogamous, the worst males are substituted by new individuals generated by chaotic sequence as the promiscuous, while the remaining ones are chosen as polygynous.
Step 6. Breeding: Each bird breeds the resultant brood by its own way.
Step 7. Replacement: Evaluate the quality of new and existed birds by fitness function, the number of a society is limited, and the better ones are remained to form a new society.
Step 8. Searching: Loop steps 5–7 until a fitness value meets with the accuracy threshold, or the number of evolution reaches the maximum generation.
Step 9. The bird with best quality is considered to be the identification result.
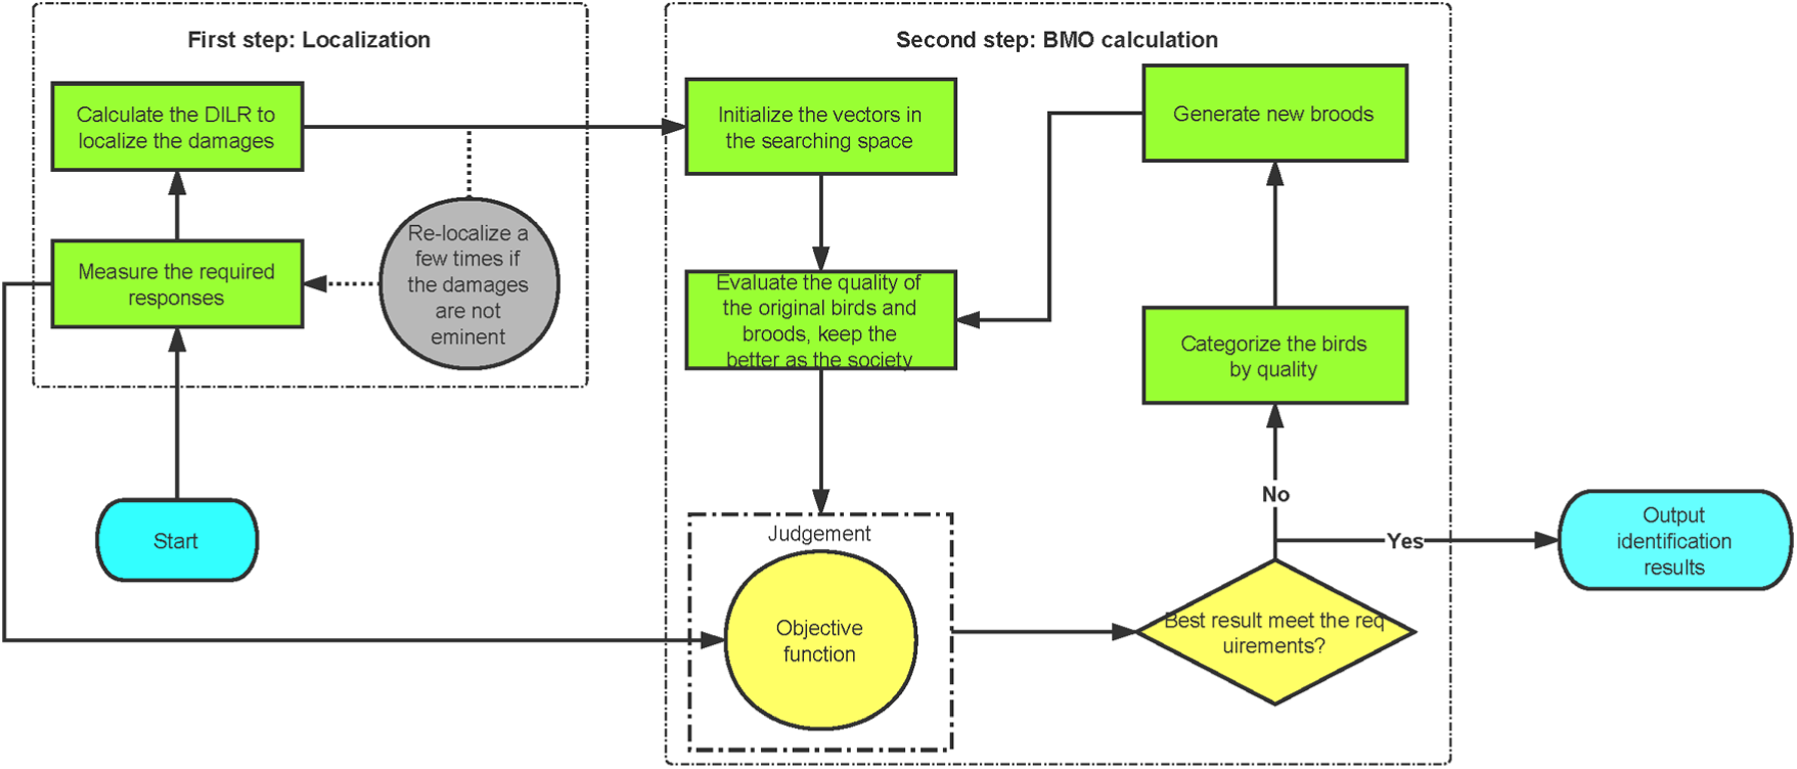
Flow chart of the proposed method.
Numerical simulation
Parameter of BMO
The basic parameters of BMO are presented as follows:
The society scale is 100, which means 100 damage parameter vectors are set in the assessment. The number of monogamous, polygynous, promiscuous, polyandrous, and parthenogenetic birds are 50, 30, 10, 5, and 5, respectively.
Each polygynous or polyandrous bird has three interested mates.
The mutation control factor
The value of parameter
The time weighting factor w decreases linearly from 1.9 to 0.1.
The maximum evolution step is 200.
A simply supported beam
A simply supported beam made of aluminum with 12 Euler–Bernoulli elements shown in Figure 5 is the first simulation example for damage identification. With length

A simply supported beam.
Damage status of the simply supported beam.

To ensure practicality and reliability of the identification, 3% random noise presented by equation (19) is added to the displacement values during localization

where

Localization of the simply supported beam: (a) DILD and (b) difference quotient of DILD.
Case study 1: damage identification from noise-free measurements
In this numerical example, the objective function accMAC in equation (15) is used in BMO. The acceleration responses of the structure under a constant sinusoidal force acting at node 7 in the global
The identification results are shown in Table 2 and Figure 7, the logarithmic best fitness value and the corresponding damage indices of the suspicious elements in a single run during the evolution process are shown in Figure 8. The six damage parameters in identification yield good results, and the maximum relative error is 0.9667% by elemental stiffness of the third element. It can be seen from Figure 8 that the fitness value converges after 80 generations, and after 70 generations, every damage index tends to convergence, the surplus iterations guarantee better identification results. The study case illustrates the availability and efficiency of the proposed method.
Identification results of the simply supported beam in multiple noise levels.


Damage identification results (noise free): (a) stiffness indices and (b) mass indices.
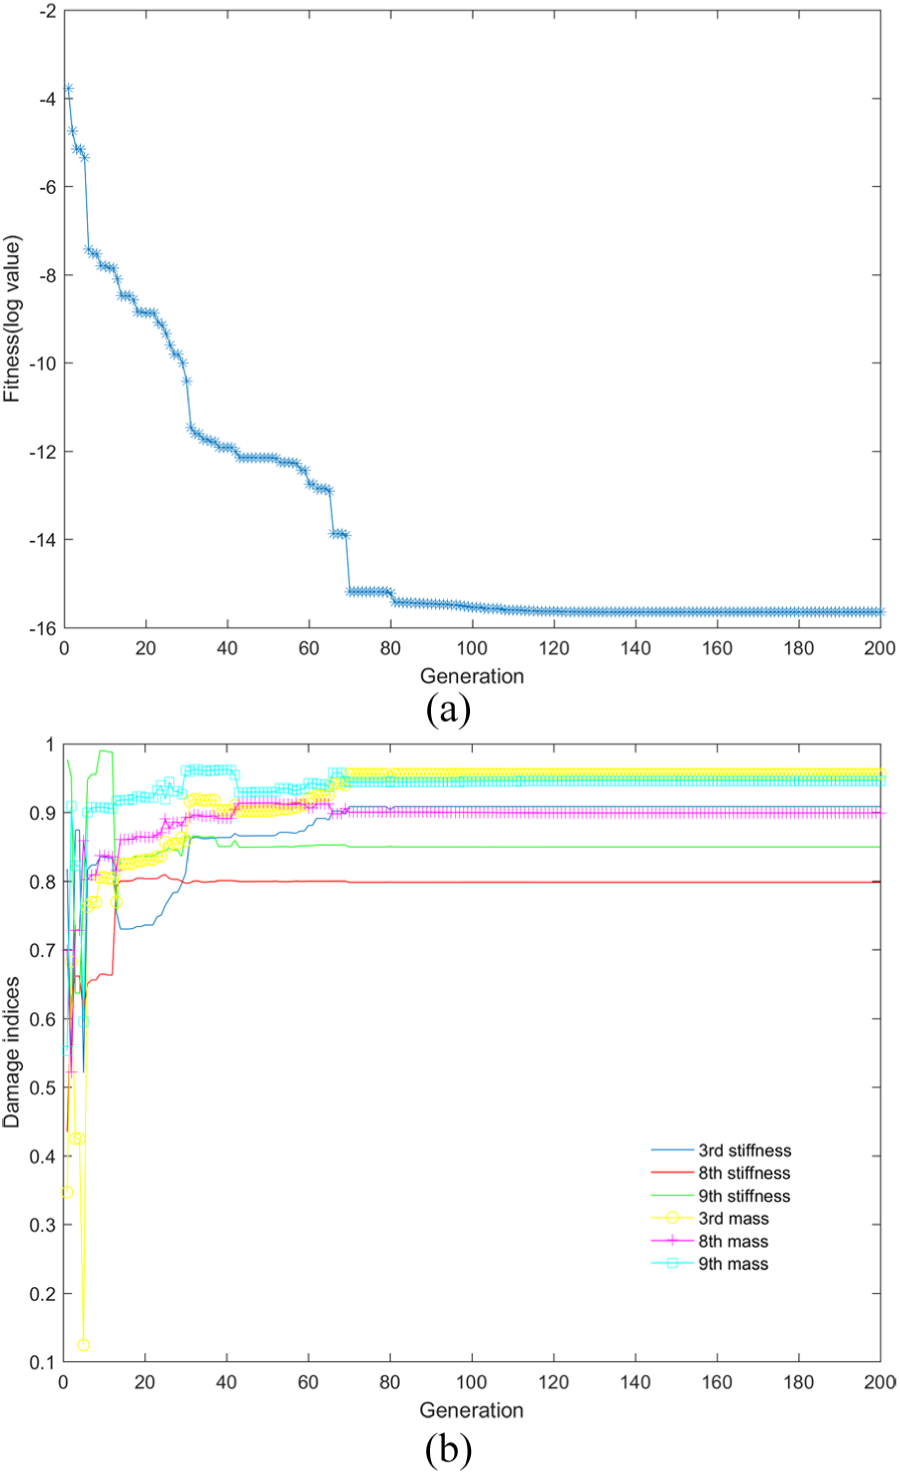
Evolution of the identification: (a) logarithmic best fitness and (b) damage indices.
Case study 2: damage identification in multiple noise levels
To illustrate the robustness and accuracy of the proposed method, damage identification is conducted under different noise levels. For acceleration responses

The identified results are shown in Table 2, with comparison to the result of noise free in Figure 9. In low noise level, the result is still satisfactory with maximum deviation less than 5%, and in high noise level the maximum relative error is 5.2526% which is still satisfactory compared to the result of 5% noise.

Comparison of identification results under different noise levels: (a) stiffness indices and (b) mass indices.
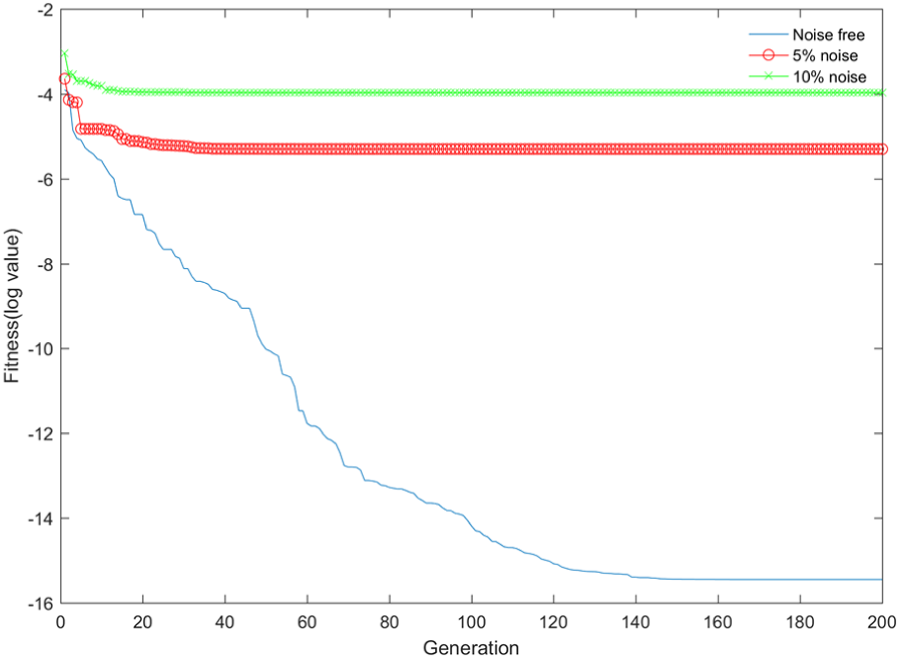
In the best fitness value chart shown in Figure 10, it can be observed that with higher noise, the searching process reaches convergence faster; in the other words, the data were contaminated greater by the noise, thus the precision dropped and tend to converge easier.

Comparison of logarithmic best fitness under different noise levels.
The results of the objective function based on conventional MAC are further demonstrated. The objective function that comprises MAC is shown in equation (21), where
Here, the weighting factors

Identification results of the simply supported beam using MAC-based objective function.


Comparison of identification results between accMAC-based and MAC-based objective functions under different noise levels: (a) stiffness indices and (b) mass indices.
The damage model combines both stiffness and mass damages. More information is needed in the objective function should better results are to be acquired; the traditional MAC takes more measure points and it is hard to measure mode shape especially in high order. On the contrary, the proposed method can measure data from many time steps which provides more damage information.
A four-span beam
A four-span beam structure as shown in Figure 12 is the second numerical example in the study. The length of the beam is 6 m, with width

Four-span beam structure.
Damage status of the four-span beam.

The deflection data of two sensors located at the midpoint of first and third spans, namely, nodes 6 and 26, are used in localization, and all the influence line data were contaminated by 3% random noise. As shown in Figure 13, nodes 3, 4, 12, and 13 show stable non-zero values in the chart of DDILD measured in node 6, and the bars of nodes 25, 26 and 33, 34 also show the potential of damage and is certified by the chart of DDILD measure in node 26. Hence, the corresponding elements 3, 12, 25, and 33 are the suspected damage elements of the four-span beam.

Localization of the four-span beam: (a) DILD and (b) difference quotient of DILD.
Case study 3: damage identification in multiple noise levels
The acceleration responses were obtained by a sinusoidal force acting at the 16th node of the beam in the global z direction with
It takes almost 140 steps for the noise-free identification to reach a stable convergence; with the increase of noise level, the converge step decreases to 30 and 20 in 5% and 10% noise level, respectively. It can be implied from the convergence chart (Figure 14) that the contamination of noise influences the details of the data; thus, the algorithm tends to converge once an approximate optimal solution is found, though it converges faster, the accuracy drops.
Comparison of logarithmic best fitness under different noise levels.
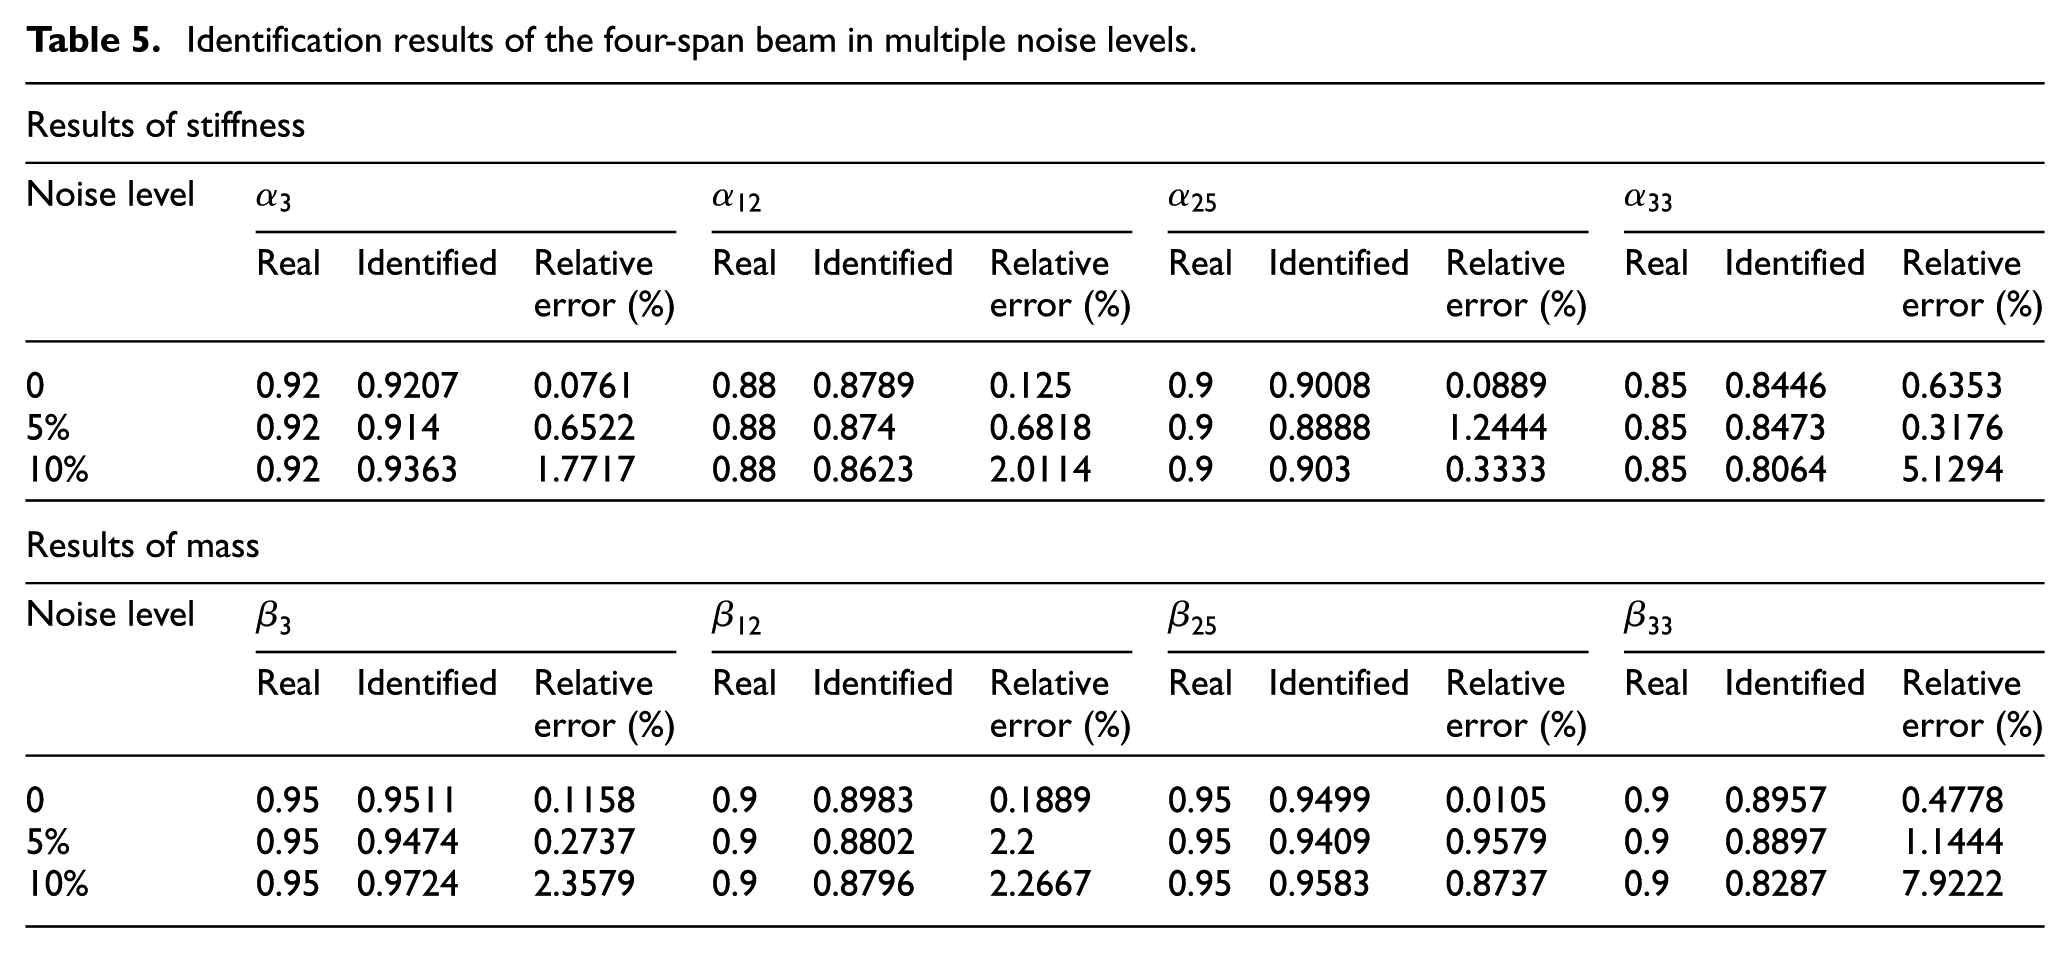
The final identification results of three noise levels are shown in Table 5 and Figure 15. The noise-free condition yields a good result with maximum relative error less than 0.5%; even in the 5% noise condition, only the mass damage index
Identification results of the four-span beam in multiple noise levels.

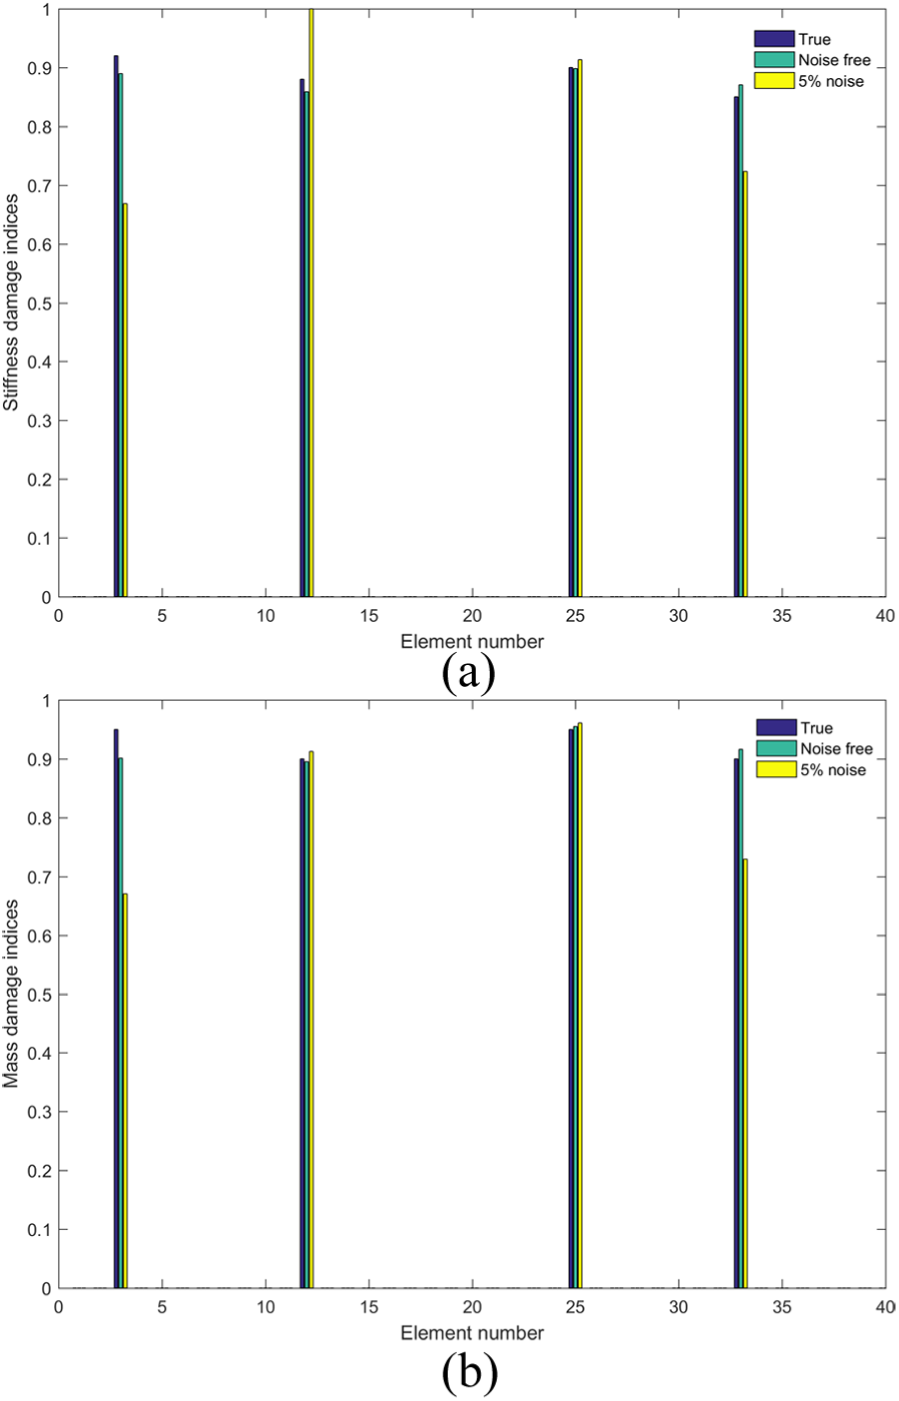
Comparison of identification results under different noise levels: (a) stiffness indices and (b) mass indices.
An objective function originated from dynamic responses is further investigated. Here, the dynamic displacement of the same structure is acting as objective function, hence equation (22)

where the superscripts
The results are shown in Figure 16. The results from noise-free data are satisfactory but in 5% noise condition there exists huge error between the identified results and the designed ones, and the identification of 10% is not shown here. The displacement cannot provide more dynamic information compared to acceleration, and the disturbance of noise makes the data even worse, thus in the noise condition it failed to identify damages. The comparison shows the superiority of the chosen data type for structural damage detection.
Identification results of disMAC-based objective functions under different noise levels: (a) stiffness indices and (b) mass indices.
Identified results of MAC are also studied here, as shown in equation (21). The weighting factors
Identification results of the four-span beam using MAC-based objective function.


Identification results of MAC-based objective functions under different noise levels: (a) stiffness indices and (b) mass indices.
Case study 4: damage identification under impulse force
In the previous study cases, dynamic responses of sinusoidal excitation show good result in damage identification. This study case will further conduct damage identification using acceleration response from impulse excitation. An impulse is supposed to act at the 16th node of the beam in the global z direction with
Figure 18 and Table 7 show the results; one can find that the identification error becomes large especially in noise condition compared to results from sinusoidal load, the largest relative error is 2.9882% and 11.5529% in 5% and 10% noise level condition, respectively, but the identified results are still satisfactory. The time histories of the calculated acceleration and the simulated measured acceleration of 25th node are shown by Figure 19. As the calculated damage parameters converged to the true ones, the calculated dynamic responses match well with measured data, and it is obvious that the lower the noise level, the better the calculated acceleration data accord with the true. The reason is that the noise becomes significant when the acceleration responses ebb. This case study shows that the acceleration responses under the impulse excitation can also be used for damage identification by proposed method, though the results are worse than identification from sinusoidal force.

Comparison of identification results using impulse excitation under different noise levels: (a) stiffness indices and (b) mass indices.
Identification results of the four-span beam using impulse excitation.


Comparison of the calculated acceleration responses and the measured responses.
Case study 5: effect of additional measure points to reduce the impact of noise
It can conclude from the above cases that in the conditions with high noise level, the accuracy of the damage identification dropped to some extent. Considering that data of only two nodes were used in previous cases, the result of more measured points is investigated in the study case.
The model of four-span beam with sinusoidal excitation
Arrangement of the measure points.

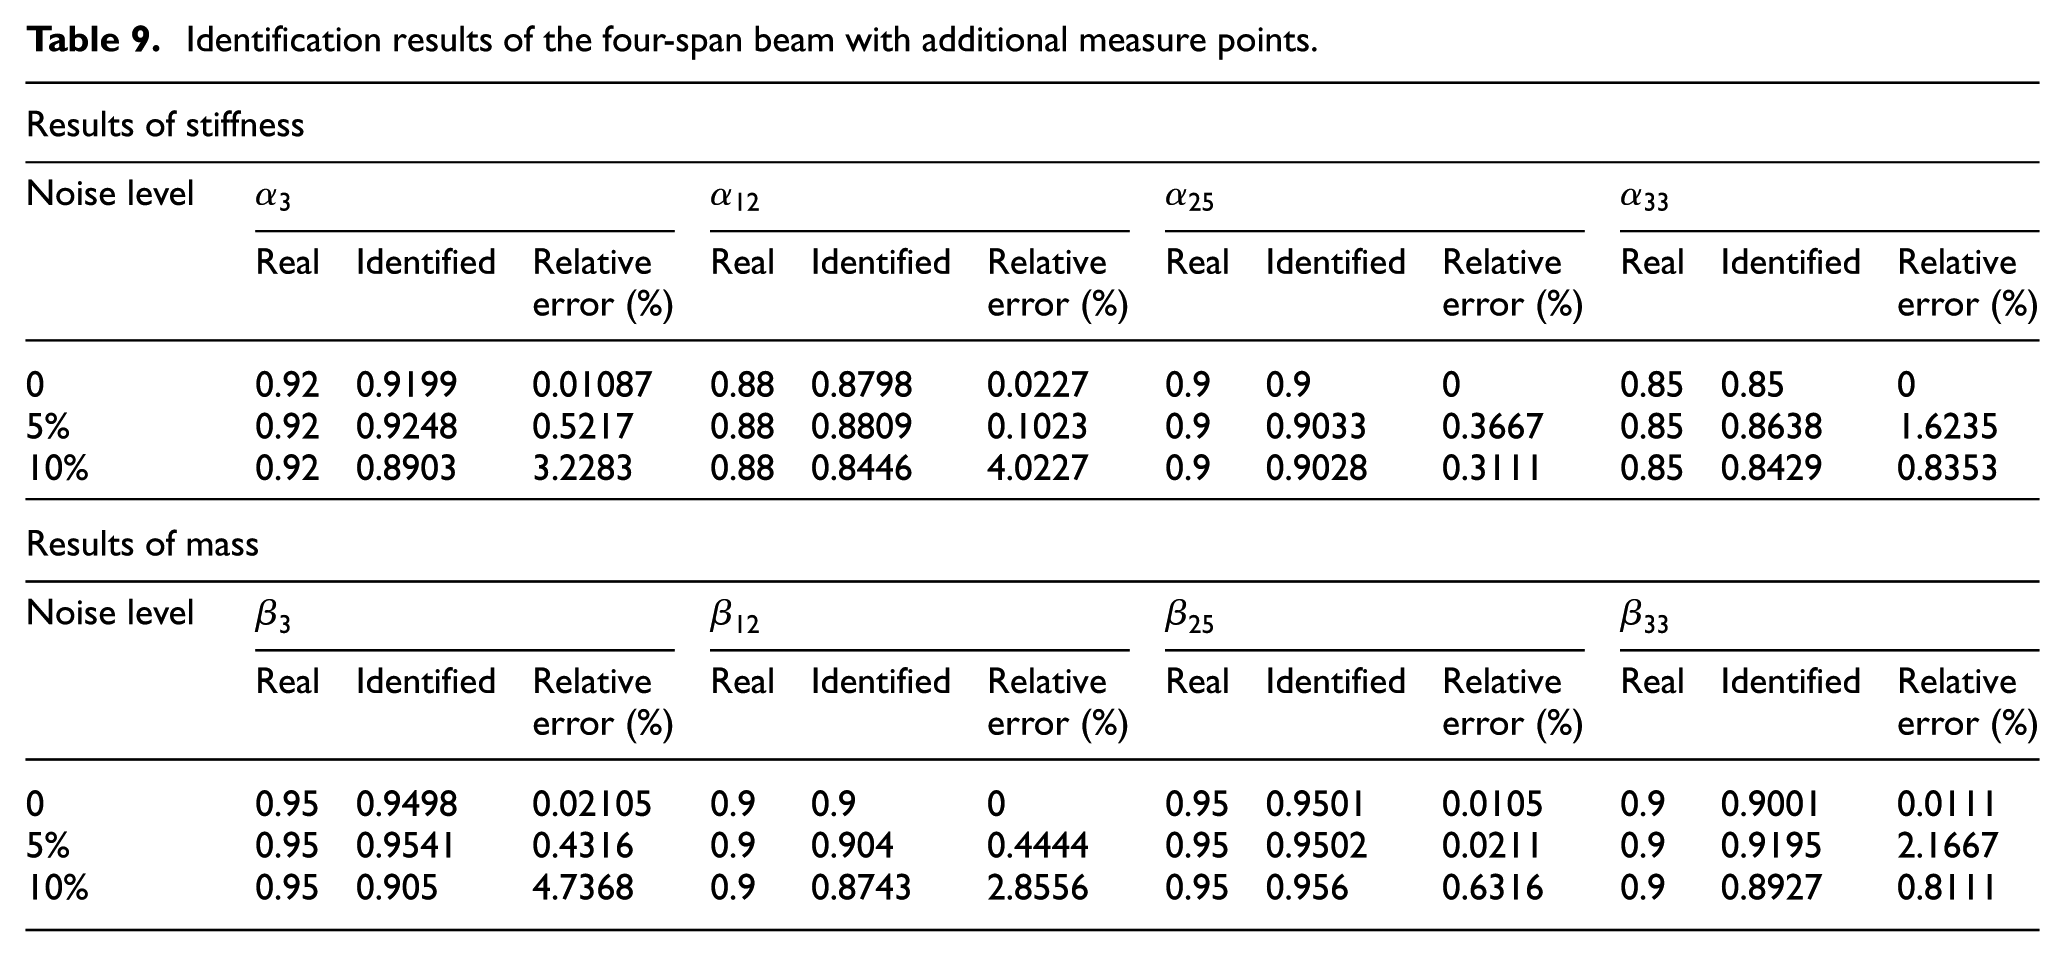
Table 9 shows the identified results, compared with case 3; the results in noise conditions show better accuracy when the acceleration data of only two nodes are used, as shown in Figure 20. The maximum relative error dropped from 2.2% to 1.6235% in 5% noise condition; in high noise scenario with 10% noise, relative error dropped from 7.9222% to 4.7368%. The identification yields better results especially the mass damage indices. This case illustrates that with proper addition of the sensors along the beam, damage identification through the proposed method can yield better results in noise condition.
Identification results of the four-span beam with additional measure points.

Comparison of identification results using different measure arrangements under different noise levels: (a) stiffness indices and (b) mass indices.
Discussion
Through the numerical examples conducted in the simulation section, the proposed method presents several advantages in structural damage identification. However, there are several aspects of the proposed method cannot be covered in the studies above. Hence, some discussions are made as follows:
In the study, damage model is parameterized in a simple way, while the mechanisms of damages in real structures are much more complicated. Therefore, complicated damage model, such as breathing crack or even crack with geometric parameters, should be considered to examine the proposed method in the future study.
It requires both data from time domain and frequency domain in the proposed method. This will increase workload and may reduce the accuracy and efficiency of identification, and the measured data are always contaminated by noise which means there are noises exist in both deflection and acceleration data. Improvements should focus on identification derived from a single type of data using a newly constructed quantity 39 or new method.
It should consider conducting experiments in the study for the proposed method in further research, which may validate the practicality on real structures.
Excitations are known in the identification process. However, the most common type of vibration in real structures is random vibration excited by ambient excitations. Further investigation should aim to apply the proposed method on structures under ambient excitation.
Conclusion
By making use of the influence line difference and acceleration data, a two-step damage detection method for beam structures is proposed in this study. A damage model combined with stiffness and mass reduction is applied. The influence line data of displacement is used and further investigated to localize the damage. An objective function based on acceleration and the form of MAC is established, and then BMO is used to minimize the discrepancies between the simulated measured data and the data from damaged structure. Two beam structures with several study cases reflect the effectiveness of the proposed method; comparison shows that the proposed function has better results than identification dynamic displacement or MAC. In addition, both the acceleration data from sinusoidal and impulse excitation proved successful in the identification. All numerical simulations are conducted in three different noise levels which demonstrate that the proposed method is insensitive to measurement noise, and by increasing the sampling number of acceleration measure points, the results in noise condition had improved.
Footnotes
Handling Editor: Sung-Cheon Han
Declaration of conflicting interests
The author(s) declared no potential conflicts of interest with respect to the research, authorship, and/or publication of this article.
Funding
The author(s) disclosed receipt of the following financial support for the research, authorship, and/or publication of this article: This work is supported by the National Natural Science Foundation of China (11572356), the Guangdong Province Science and Technology Program (2016A020223006), and Guangdong Province Natural Science Foundation (2015A030313126), and the Fundamental Research Funds for the Central Universities (No. 17lgjc42).