
Abstract
We use tensile–shear tests to investigate the failure modes of Ti–1Al–1Mn microscale resistance spot welds and to determine how the failure mode affects the microstructure, microhardness profile, and mechanical performance. Two different failure modes were revealed: interfacial failure mode and pullout failure mode. The welds that fail by pullout failure mode have much better mechanical properties than those that fail by interfacial failure mode. The results show that weld nugget size is also a principal factor that determines the failure mode of microscale resistance spot welds. A minimum weld nugget size exists above which all specimens fail by pullout failure mode. However, the critical weld nugget sizes calculated using the existing recommendations are not consistent with the present experimental results. We propose instead a modified model based on distortion energy theory to ensure pullout failure. Calculating the critical weld nugget size using this model provides results that are consistent with the experimental data to high accuracy.
Introduction
The increasing demand for lightweight and miniaturized products necessitates effective high-quality and reliable microjoining methods. Microscale resistance spot welding (MSRSW) is one of the most commonly used microwelding technologies for joining sheet metals. However, appropriate recommendations for the welding parameters and specific standards for welding ultrathin sheet metals are needed to obtain the maximum benefit from this technology. 1 Furthermore, in stark contrast to large-scale resistance spot welding (LSRSW), research into how to predict spot weld performance is lacking for MSRSWs. 2
Generally, tensile–shear tests show that spot welds fail in one of the two different modes: interfacial failure (IF) mode and pullout failure (PF) mode (see Figure 1).
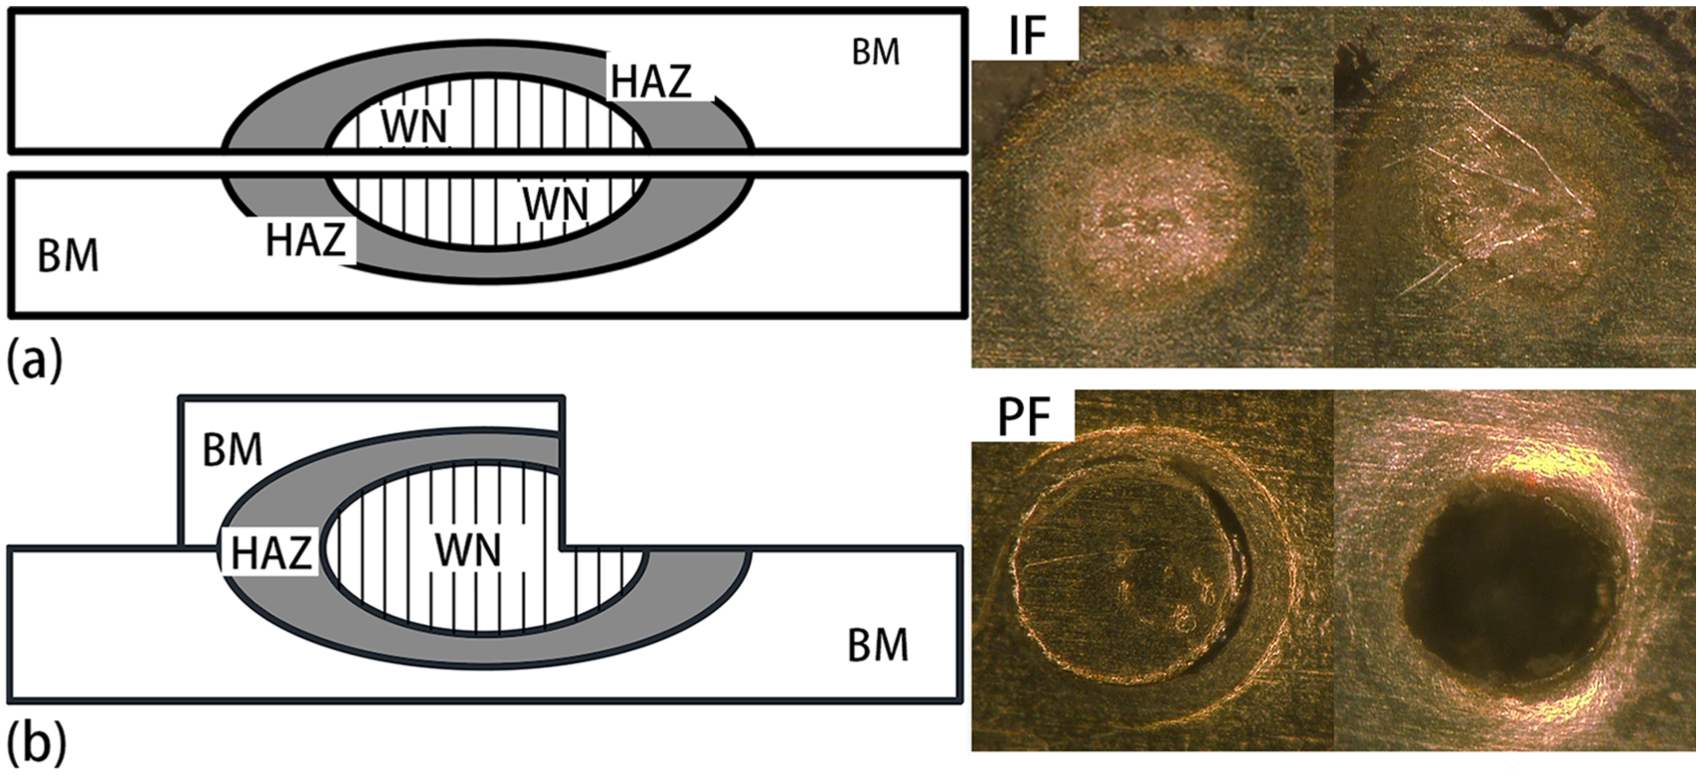
Schematic representation of different failure modes in tensile–shear tests of microscale resistance spot welds: (a) IF mode and (b) PF mode.
Failure occurs through the weld nugget (WN) in the IF mode (Figure 1(a)), whereas the PF mode failure occurs by complete withdrawal of the WN from one sheet (Figure 1(b)). Generally, welds that fail by the PF mode have much better load-bearing and energy absorption capability. 3 This claim is also supported by our previous study; see Figure 2. In terms of reliability and performance of spot welds, the PF mode is preferred, but proper welding parameters are required to ensure PF mode failure. 4 Moreover, various studies have focused on how to determine the critical WN size dcr to ensure PF mode failure in tensile–shear tests. For example, Vandenbossche 5 examined the failure mechanism of lap shear specimens based on an approach involving the perfectly plastic limit load. Ewing et al. 6 examined the tensile performance of RSWs of galvanized and bare high-strength low-alloy (HSLA) steels. Marya et al. 7 developed the weld fracture criteria of dual-phase steels by applying a least-squares root-fitting analysis to the data from tensile–shear tests. Pouranvari et al.8,9 proposed a failure mechanism to describe both IF and PF modes, and predicted the WN diameter to ensure the PF mode in tensile–shear tests. Radakovic and Tumuluru 10 used finite element modeling and fracture mechanics calculations to predict failure modes and loads in tensile–shear tests of advanced high-strength steels. Finally, Pereira et al. 11 proposed a convenient formula to predict the WN diameter of heat-treatable aluminum alloys, which considers the sheet thickness and mechanical properties of the weld. The aforementioned publications all focus on thick sheet metals and LSRSWs, so the methods to predict dcr do not reproduce the experimental results or are too conservative for MSRSWs.

Typical load–displacement curve for different failure modes.
Thus, we investigate herein the failure mechanism and mechanical performance of Ti–1Al–1Mn MSRSWs of ultrathin foils. Correlations between WN size, welding parameters, metallurgical factors, and failure performance are also analyzed. In light of the failure mechanism, we model and predict the failure modes expected from tensile–shear tests.
Experiment
Ti–1Al–1Mn ultrathin foils (0.05 mm thick) were selected as the base material (BM) for MSRSWs. The chemical composition of this foil is 1.8Al–1.8Mn–0.05Fe–0.01C–0.02N–0.13O–0.002H–othersTi (wt.%), its yield strength is 637 MPa, and its ultimate tensile strength is 762 MPa.
The welding experiments were done using specific welding parameters to explore how WN size affects the failure mode and mechanical properties of the spot welds. Figure 3(a) shows schematically the welding parameter profiles during MSRSW. Figure 3(b) shows the weld lobe for the MSRSW of the Ti–1Al–1Mn foils. The welding current was varied from 400 to 500 A to obtain different WN sizes and each weld was repeated five times at each current, with the remaining welding parameters fixed for all welds as detailed in Table 1.

(a) Schematic representation of welding parameter profiles for microscale resistance spot welding. (b) Weld lobe for Ti–1Al–1Mn for small-scale resistance spot welding. The welding duration was 6 ms.
Parameters for small-scale resistance spot welding.

Tensile–shear tests were conducted at a tension rate of 0.2 mm/min at room temperature. The specimens are shown in Figure 4: a spot weld was made at the center of two ultrathin foils and then the specimen was cut by wire cutting according to ASTM-E345. 12 The WN size and failure mode were determined by analyzing the failed specimens after tensile–shear tests with the help of a stereo zoom microscope (VK-9700; KEYENCE). The peak load and failure energy absorption were extracted from the load–displacement curves as per Pouranvari et al. 13

Dimensions of welds and tensile–shear test specimens.
The microhardness was measured using a Vickers hardness measurement machine with a 100-g load applied for 10 s. Figure 5 shows the location of the microhardness measurements and microhardness maps were obtained from the corresponding data using MATLAB R2014b. The metallographic observations of the welded joints were done after etching for 5 s by corrosion solutions (HF:HNO3:H2O = 1:2:19). After the tensile–shear tests, the fractured surface of the specimen was examined directly using a scanning electron microscope (SEM; FEI Helios NanoLab™ 660).

Location of microhardness measurements.
Results and analysis
Microstructure and microhardness
Figure 6 shows the typical structure of MSRSWs on Ti–1Al–1Mn for a welding current of 600 A. The results show that the BM contains α and β phases, with the α phase dominating the microstructure, as shown in Figure 6(a). The WN microstructure differs completely from that of the BM, with the main component being acicular martensite, as shown in Figure 6(b). This result is attributed to rapid cooling of the welding process and its quenching effect. Figure 6(c) indicates that pronounced grain growth occurs in the heat-affected zone (HAZ) because of the excessive heat input. However, the HAZ is not distinctive after MSRSW, and no clear-cut boundary exists between the BM and HAZ.

Cross-sectional micrographs of the welded sample obtained using default welding parameters: (a) base material, (b) welded nugget, and (c) heat-affected zone.
This result may be due to the fact that, to join these ultrathin metallic foils, regardless of the heat input, transmission and dissipation are all relatively concentrated. No overabundance of heat expands the HAZ and no obvious phase transformation occurs in the HAZ compared with LSRSW.
Generally, mapping microhardness is regarded as an effective way to investigate the distribution of mechanical properties and microstructure. 14 Figure 7 shows a typical microhardness map for the specimen shown in Figure 5, which was obtained with a welding current of 480 A. This current is the lowest possible, which ensured that all welded joints failed by PF mode in this study. This approach reveals the nonuniform distribution of microhardness, which corresponds to the distinctive zones in the welds (WN, HAZ, and BM). The variation in microhardness is ascribed to the different microstructures. The formation of martensite increases the microhardness in the WN 15 and grain coarsening softens the HAZ. As discussed above, because of the heat concentration that occurs when microjoining ultrathin foils, no obvious phase transformation takes place in the HAZ compared with LSRSW. Thus, the extra heat coarsens the grain in the HAZ, so that softening follows the Hall–Petch law. This softening is not consistent with the welding characteristics of these transformation-hardened materials with normal thickness. 16
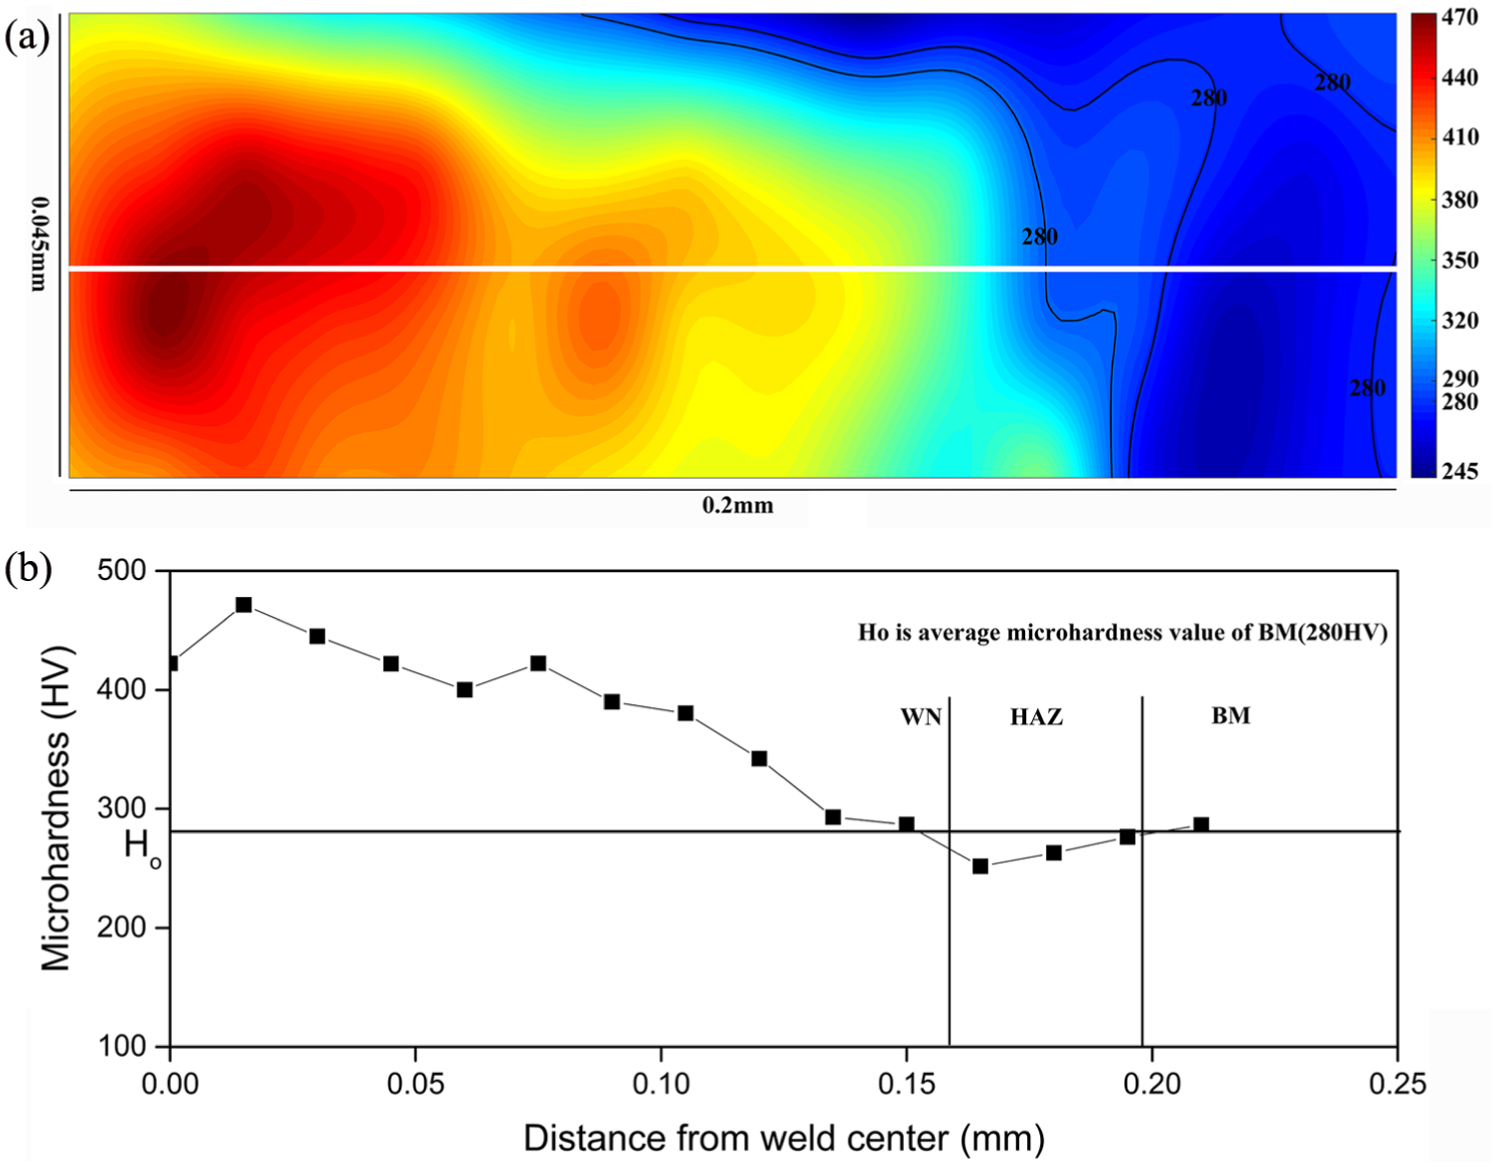
Typical microhardness profiles for the welded sample: (a) microhardness map and (b) microhardness profile along the horizontal line in (a).
The microhardness of MSRSWs is not easy to average because of the microhardness gradient, as shown in Figure 7(a) and (b). This behavior is the opposite of what occurs with LSRSWs (i.e. the WN microhardness is relatively stable, whereas the HAZ microhardness has an obvious gradient). The theoretical basis of heat-strengthened treatment for Ti alloys is martensite transformation. 17 Moreover, some researchers18,19 have pointed out that the cooling rate affects the phase transformation during the heat treatment of Ti alloys. Thus, different cooling rates may determine the density and distribution difference of martensite, thereby producing variations in the microhardness of the WNs. Air cooling is usually used during MSRSW; however, even under very high cooling rates, an uneven contact surface between the BM and the electrode or an inhomogeneous deformation of the BM can cause a significant difference in cooling rates because of the extreme thinness of the BM. Conversely, our previous study revealed that elemental Cu diffuses from the Cu electrode into the WN. Given the small quantity of Cu, Ti2Cu may be produced near grain boundaries, which would increase the local microhardness. 20 In addition, the cooling rate also affects the diffusion process, thus determining the number of diffused Cu atoms.
For these reasons, the different cooling rates result in the microhardness variation corresponding to the microstructure gradient. As shown in Figure 6(b), the number and distribution of martensite are not homogeneous.
At present, by mapping the microhardness, the boundary of each zone is distinguished and its microhardness is averaged with sufficient accuracy. As calculated, the average microhardness values in the WN, HAZ, and BM of a typical specimen are 400.43, 260.73, and 284 HV, respectively.
To compare the calculated dcr with the existing formulas and the experimental results obtained in this study, we determined the microhardness at the polished cross-section surface of the welded joint using the general method to determine microhardness (i.e. the same method as used for LSRSW), as shown in Figure 5. The WN microhardness ranges from 372.98 to 413.06 for welds with welding currents varying from 400 to 800 A. Note that, in our previous study 21 , the microhardness was measured directly by denting the weld surface, and the average microhardness was calculated from 11 dents made in various locations in the WN. With that measurement method, the WN microhardness ranged from 447.33 to 517.78 for the welding current varying from 400 to 800 A. That result, which gives a larger microhardness and a larger range, is not completely consistent with the results of this study. However, for the two different measurement methods, the effect of welding current on the average microhardness of the WN is consistent. The WN microhardness initially decreases and then increases monotonically to a maximum value with increasing welding current.
The reason for this behavior may be that, although the two measurement methods have no essential difference, the mechanical properties of base metallic foils originally differ in the rolling and thickness directions. Moreover, hardness mapping provides a way to investigate the distribution of mechanical properties throughout the entire weld zone by providing a matrix of points of microhardness measurements. Thus, the effect on the average WN microhardness of an abrupt change at a few points is negligible. When measured by hardness mapping, the range of average WN microhardness created by various welding currents is smaller, especially for ultrathin metallic foils with an inhomogeneous microstructure.
Failure mode
The two different failure modes shown in Figure 1 are both observed in the tensile–shear test of the welded samples. Figure 8 shows the relationship between WN size and failure mode. The PF mode is preferred and accounts for a greater failure load and energy compared with the IF mode. The failure mode of the specimen changes from IF to PF upon increasing the WN size, with the critical WN size separating the two modes being about 0.302 mm. Above this WN size, all specimens failed in the PF mode. A critical WN size for LSRSW during tensile–shear tests is also reported in many previous studies. 5 Moreover, in all experiments, a WN size exceeding 0.302 mm occurred whenever the welding current exceeded 480 A.

Effect of weld nugget size on the mechanical properties of Ti–1Al–1Mn MSRSW: (a) failure load and (b) failure energy.
Because a welded joint is subjected to tensile–shear force, stresses are generated both at the weld interface and around the WN. Thus, the failure occurs in the zone where the equivalent stress first reaches its peak value, so different failure locations host different failure modes (i.e. failure by IF mode in the WN and failure by PF mode in the HAZ or BM). Thus, the failure mechanisms of welded joints depend on the failure modes. Pouranvari et al. 8 proposed a failure mechanism for the IF and PF modes that was also confirmed by SEM investigations. They pointed out that elongated dimples in the shear and fracture surface instigate IF mode failure, whereas welded joints fail under tensile stress in the PF mode, creating near-circular dimples in the fracture surface. Using this mechanism, they accurately predicted the critical WN size for LSRSWs of low-carbon steel.
However, this fracture mechanism does not adequately explain the failure of welded joints after MSRSW of ultrathin Ti alloy foils. In this study, the actual stresses in the weld are not pure shear stresses not only for specimens that failed under PF mode but also for specimens that failed under IF mode. Because the weld rotates first as the external loading transmits from one component to another, a tensile stress is created at the weld interface. This observation is also confirmed by the SEM images of the fracture surface (see Figure 9). The precise shape of the dimples depends on the loading conditions. 8 Void coalescence due to stress normal to the overall fracture plane creates equiaxial dimples, whereas shear loading creates elongated dimples. 22 Figure 9(a) and (b) show that the failure mechanism of the IF mode is ductile, and the driving force of the failure is comprehensive stress comprising tensile stress perpendicular to the cross section of the WN and shear stress parallel to the WN cross section, as manifested by the different dimple directions and the lack of elongated dimples. The dimples prove that the PF fracture mechanism is also ductile, similar to the IF fracture mechanism (see Figure 9(c) and (d)). However, the dimples are oriented in the direction of the WN thickness, which is inconsistent with a failure of the fracture surface by IF mode.

Fracture surface of spot welds that failed under tensile–shear test: (a), (b) interfacial failure mode and (c), (d) pullout failure mode.
Vandenbossche 5 proposed a model to investigate the weld area stress during tensile–shear tests (see Figure 10). Upon applying a load F, the weld first rotates to transmit it and the load resolves into a tensile load perpendicular to the WN cross section and a shear load parallel to the WN cross section. In the IF mode, the degree of rotation is within a certain range, so the driving force for the failure is comprehensive stress, which is induced by a tensile load P and a shear load V, which can be expressed as

where
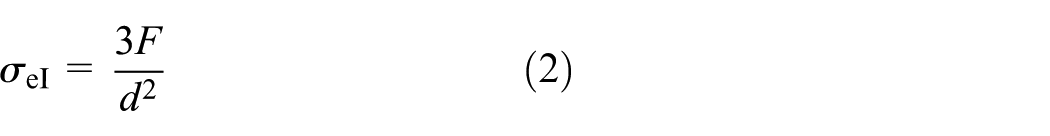
where σeI is the equivalent tensile stress in the WN, F is the driving force, and d is the WN size.

Free-body diagram of the specimen during tensile–shear test. 5
This mechanism provides a satisfactory explanation of IF mode failure, which is also confirmed by SEM images of the fracture surface, as discussed above.
However, with increasing WN size, the stress tolerance of the WN continually increases. Before failure, the WN is sufficiently strong to support quite a large rotation of the specimen. Moreover, considering further reduction in foil thickness due to necking in the thickness direction, the shear stress is much less than the tensile stress in the weld zone. We therefore assume that failure occurs when the maximum radial stress along the circumference of one half of the cylindrical nugget reaches the ultimate strength of the failure location, generally in the HAZ, which is the weakest around the WN. This mechanism may also be verified by observing the fractured surface of the welded joint after the tensile–shear test, which is where the fracture occurred in the WN (200.72 µm) for IF mode failure and in the HAZ (340–390 µm) for PF mode failure (see Figure 11). The related data are reported in our previous study. 21
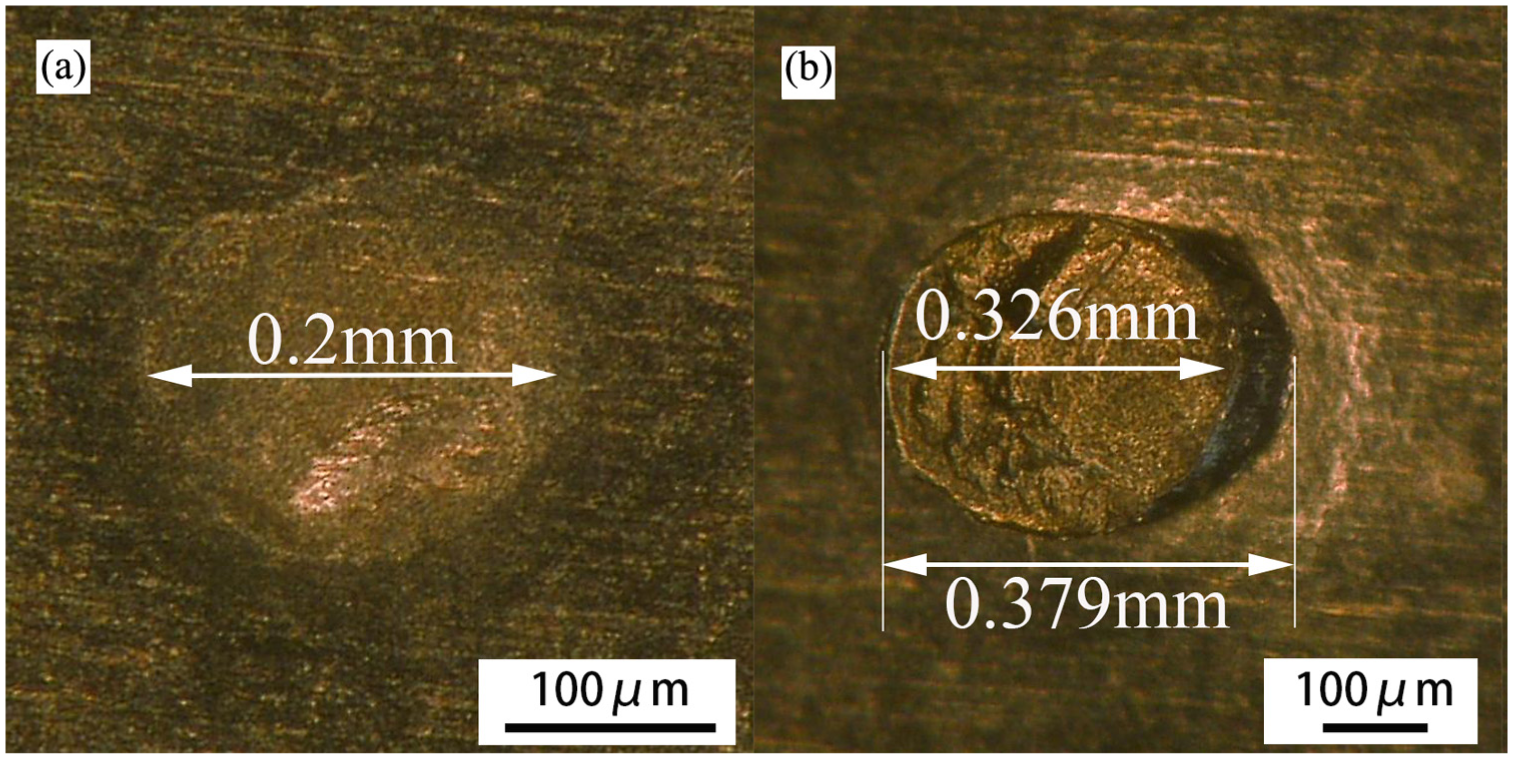
Typical fractured surface of welded joint for a welding current of (a) 400 A and (b) 500 A.
This assumption is also consistent with the fact that the dimples on the fracture surface for PF mode failure are oriented in the direction of the WN thickness, as mentioned above. Therefore, the equivalent stress in the HAZ may be given as

where σeP is the equivalent stress in the HAZ, F is the driving force, d is the WN size, and t is the BM thickness.
As mentioned, the failure mode depends on the relative stress in the WN and the HAZ (the lowest strength zone around the WN). The WN size is the principal factor determining stress distribution in spot welds. 11 Small WNs have little degree of rotation, so the shear stress increases more rapidly to the critical strength in the WN. Therefore, spot welds undergo IF mode failure. To ensure the PF mode, the following inequality should be satisfied

where [σHAZ] and [σWN] are the ultimate tensile strength values of the HAZ and WN, respectively. Using equations (3) and (4), we obtain

In spot welds with a nugget size greater than dcr, the relative stress is greater in the HAZ, which leads to PF mode failure. Conversely, relative stress is higher in the WN when the nugget size is less than dcr, so IF mode failure occurs first. Considering failure location and sheet thickness, the critical WN size may be derived. Because directly measuring the ultimate strength in different weld zones is difficult, the microhardness profile is generally used to estimate the strength. A direct relationship exists between ultimate strength and microhardness. 23 Therefore, we can write

where HHAZ and HWN are the average hardness values of the HAZ and WN, respectively. We thus propose the modified model based on distortion energy theory for predicting the failure mode of MSRSWs, which considers the BM thickness and the mechanical properties of the welded joint.
Model verification
For the material used in this study, the thickness is t = 0.05 mm and HHAZ and HWN range from 258.07 to 272.16 HV and from 372.98 to 413.06 HV, respectively. First, the typical microhardness values HHAZ = 260.73 HV and HWN = 400.43 HV are used to calculate dcr. As discussed above, a typical value is obtained for the specimen welded under the lowest welding current (480 A) to ensure that all the welded joints fail by PF mode in this study. Inserting these values into equation (6) gives a critical WN size of 0.307 mm, which is very close to the experimental results in which the IF and PF modes are clearly distinct, as shown in Figure 8. However, it is difficult to obtain the typical microhardness of a welded joint that fails by PF mode for the minimum WN size, which requires a large number of specimens welded under various welding conditions. To verify that equation (6) applies, we use the average microhardness values of HHAZ = 265.12 HV and HWN = 393.02 HV. Under these conditions, dcr is predicted to be 0.318 mm, which, compared with the experimental result of 0.302 mm, is a sufficiently safe value with only 5.3% error to ensure PF mode failure.
To further validate the proposed model, weld joints of various WN size were made on the Ni-based superalloy foil GH4099, with the conditions given in Table 2. The GH4099 foil was 0.07 mm thick and the ratio of WN microhardness to the microhardness at the failure location (i.e. the HAZ) was ∼1.17 (i.e. 295/252.4). Inserting these values into equation (6) gives a critical WN size of 0.564 mm, which separates the IF and PF modes according to the experimental observation with an error of 7%.
Effect of welding current on weld nugget size and failure mode.

IF: interfacial failure; PF: pullout failure; WN: weld nugget.
Conclusion
We investigated the failure modes of Ti–1Al–1Mn MSRSWs during tensile–shear tests. The results show a clear microstructure gradient, which produces variations in microhardness in the WN due to the different cooling rate of the MSRSW. Microhardness mapping proves to be an effective way to determine the mechanical properties and microstructure distribution. Typical microhardness values for the WN, BM, and HAZ range from 400 to 260 HV. The variation may be due to the different microstructures in these zones. The WN size proves to be the principal factor determining the failure mode of MSRSWs in tensile–shear tests, namely, comprehensive stress in IF mode failure and tensile stress in PF mode failure. The current recommendations for critical WN size are excessively conservative and thus not appropriate for MSRSWs. Instead, to predict the critical WN size, we propose to use a modified analytical mode, which considers both the material thickness and the mechanical properties of the welded joint.
Footnotes
Handling Editor: Jining Sun
Declaration of conflicting interests
The author(s) declared no potential conflicts of interest with respect to the research, authorship, and/or publication of this article.
Funding
The author(s) disclosed receipt of the following financial support for the research, authorship, and/or publication of this article: This work was supported by the Postgraduate Research & Practice Innovation Program of Jiangsu Province under Grant No. KYCX17_0285. The authors gratefully acknowledge the financial support from the China Scholarship Council (Grant No. 201706830035).