
Abstract
China’s rural areas have developed rapidly in the past 10 years, with remarkable changes in built environment. Nonetheless, the built environment in China’s rural areas has not been investigated. This study preliminarily explores an index system of China’s rural built environment, analyzes developing trends of rural built environment from a macro-perspective, and uses factor analysis to evaluate comprehensive level of rural built environment under multi-index panel data. A total of 24 samples were selected, including the entire China and the provinces (municipalities), by collecting and sorting a series of rural data from statistical yearbooks. Results show that rural built environment in China presents dynamic fluctuations, and the distribution of public factors presents irregular changes. Moreover, the overall ranking of built environmental scores in different provinces does not match the level of economic development, whereas the rural energy and ecological environment are relatively steady. These findings coincide with the current stage and policies of rural urbanization and new rural construction in China. China’s rural areas are rapidly developing, but the level and rate of development of each province is different. This study suggests that the government should first ensure the continuous promotion of projects that satisfy the needs of people’s livelihood in the next step of rural construction.
Introduction
In 1978, China implemented the internal reform starting from the countryside. After 40 years, considerable changes have taken place in China’s rural areas. In the past 10 years, the Chinese government attached great importance to the construction of rural infrastructure. Since 2005, the central “No.1 Document” is continuously proposed to strengthen the construction of agricultural and rural infrastructure and increase local governments’ support for rural infrastructure construction. Correspondingly, China’s rural fixed asset investment increased significantly in the past 10 years. The investment of rural fixed assets in 2015 was 2.64 times that in 2005, and rural infrastructure construction increased significantly, the growth rate of which in 2015 was 1.86 times that in 2005 (China Statistical Yearbook (2006–2016)). The investment in fixed assets of rural households in 2015 was 2.64 times as much as that in 2005 (China Rural Statistical Yearbook (2006–2016)). However, the built environment in rural China has changed greatly. Scholars have either studied the urban built environment or studied the rural infrastructure construction in China, and no scholars have studied the environmental changes in China’s rural areas. This study aims to fill this gap using macro-statistics data.
Literature review
Studies on built environment mainly focus on the impact of urban built environment on travel behavior. More than 200 papers on this topic had been published by 2010, 1 and the number of literature reviews continues to increase at present.1–5 Chinese scholars’ research on built environment and travel behavior is still in the initial stage of exploration and development 6 (only two publications in this field were found before 2005), but the motive force of scholars’ interest in this topic is unprecedented in the development of the city. 7 Chinese scholars have used various methods to study the impact of built environment on traffic behavior in several cities of China.8–13 More than 60% of existing literature regards the relationship between work and housing as the main research content of the built environment. 7 Employment, transportation, neighborhood relations, and daily living facilities are also often considered in studies.8,14–18 The case studies of Chinese scholars mainly focus on such first-tier cities as Beijing, Shanghai, Guangzhou, and Nanjing. 7 The existing references present the widely used “6Ds” of built environment, namely, density, diversity, design, destination accessibility, distance to transit, and demand management.1–3,19,20 The specific measurement indicators for the built environment variables are continuously accumulated and enriched.12,21 The most commonly used measure indicators are shown in Table 1.
The commonly used indicators of “6Ds” of built environment variables.

However, all the studies are conducted in developed areas such as Western China, and no research on rural areas in China has been found so far. Although no literature related to China’s rural built environment is available, a large amount of literature on the construction of China’s rural infrastructure exists. Studies related to rural infrastructure are mainly focused on the following four aspects: the sustainable development of infrastructure construction,22–24 the performance evaluation of government investment,25,26 the farmers’ participation in infrastructure construction and their satisfaction,27–30 and the investment efficiency and capital stock of rural infrastructure.31,32 However, the impact of rural infrastructure construction on rural residents, especially in rural residents’ travel behavior and energy consumption is still unknown.
The main reasons for the lack of research on rural built environment may include the huge rural population, the wide coverage area, the large geographical regional gap, the decentralized rural household layout, and data collection difficulties. Meanwhile, China’s rural areas are in a rapid development stage of new rural construction and rural urbanization, and the rural built environment is in a dynamic change process. This study attempts to answer the following questions by sorting out China’s relevant statistical yearbooks:
What indicators does China’s rural built environment have?
What trends and laws does China’s rural built environment have?
What is the integrated development level of China’s rural built environment and that of the other provinces (municipalities)?
Are there any internal laws among indicators that affect the changes of rural built environment?
What is the practical significance of the statistical analysis conclusion?
This article is organized as follows: section “Indicator, data sources, and descriptive analysis” includes the process of data collection and descriptive analysis of data; section “Comprehensive evaluation of rural built environment change” includes the introduction of factor analysis of multi-index panel data and parameters; section “Result and discussion” includes the conclusion and discussion of the comprehensive factor analysis evaluation; and section “Conclusion” presents the research summary, deficiencies, and prospects.
Indicator, data sources, and descriptive analysis
Data sources and analysis contents
A large number of literature on the relationship between urban built environment and travel behavior mainly reflect the urban built environment through density, diversity, destination accessibility distance to transit, and demand management (Table 1). The indicators of urban built environment may be a reference for rural built environment. However, the rural built environment research cannot easily be considered with the urban micro-environment index system due to the rural backward state of development, the wide regional coverage, evident geographical differences, and different characteristics of rural built environment. Meanwhile, the indicators for the built environment are not uniform. The comprehensive analysis of the literature reveals that as many as 171 built environmental measurement indicators exist in the international sample (excluding the Chinese sample), and as many as 99 indicators of the built environment from Chinese sample are available, as detailed in the supplementary materials.
This study attempts to construct an index system of China’s rural built environment starting from the rural education, culture, health, welfare, ecological energy, transportation facilities, and other basic needs of the people’s livelihood environment, combined with the “Chinese Statistical Yearbook,”“China Rural Statistical Yearbook,”“Chinese Auto Market Statistical Yearbook,”“Sichuan Statistical Yearbook,” and statistical yearbooks of other provinces. Finally, 14 indicators are established, and 24 samples are selected according to data integrity. The details of rural built environment and indicators are shown in Table 2, and all the samples are shown in Figure 1.
Contents and indicators of built environment.


Study areas in this article.
Trend analysis of rural built environment
To analyze the overall change trend of rural environment built, two samples from China and Sichuan are taken as an example, and the fixed growth ratio is used to calculate change trends in the past 16 years of each built environment indicator according to the continuity and integrity of the data. The following presents the formula for calculating the growth rate of indexes in each period

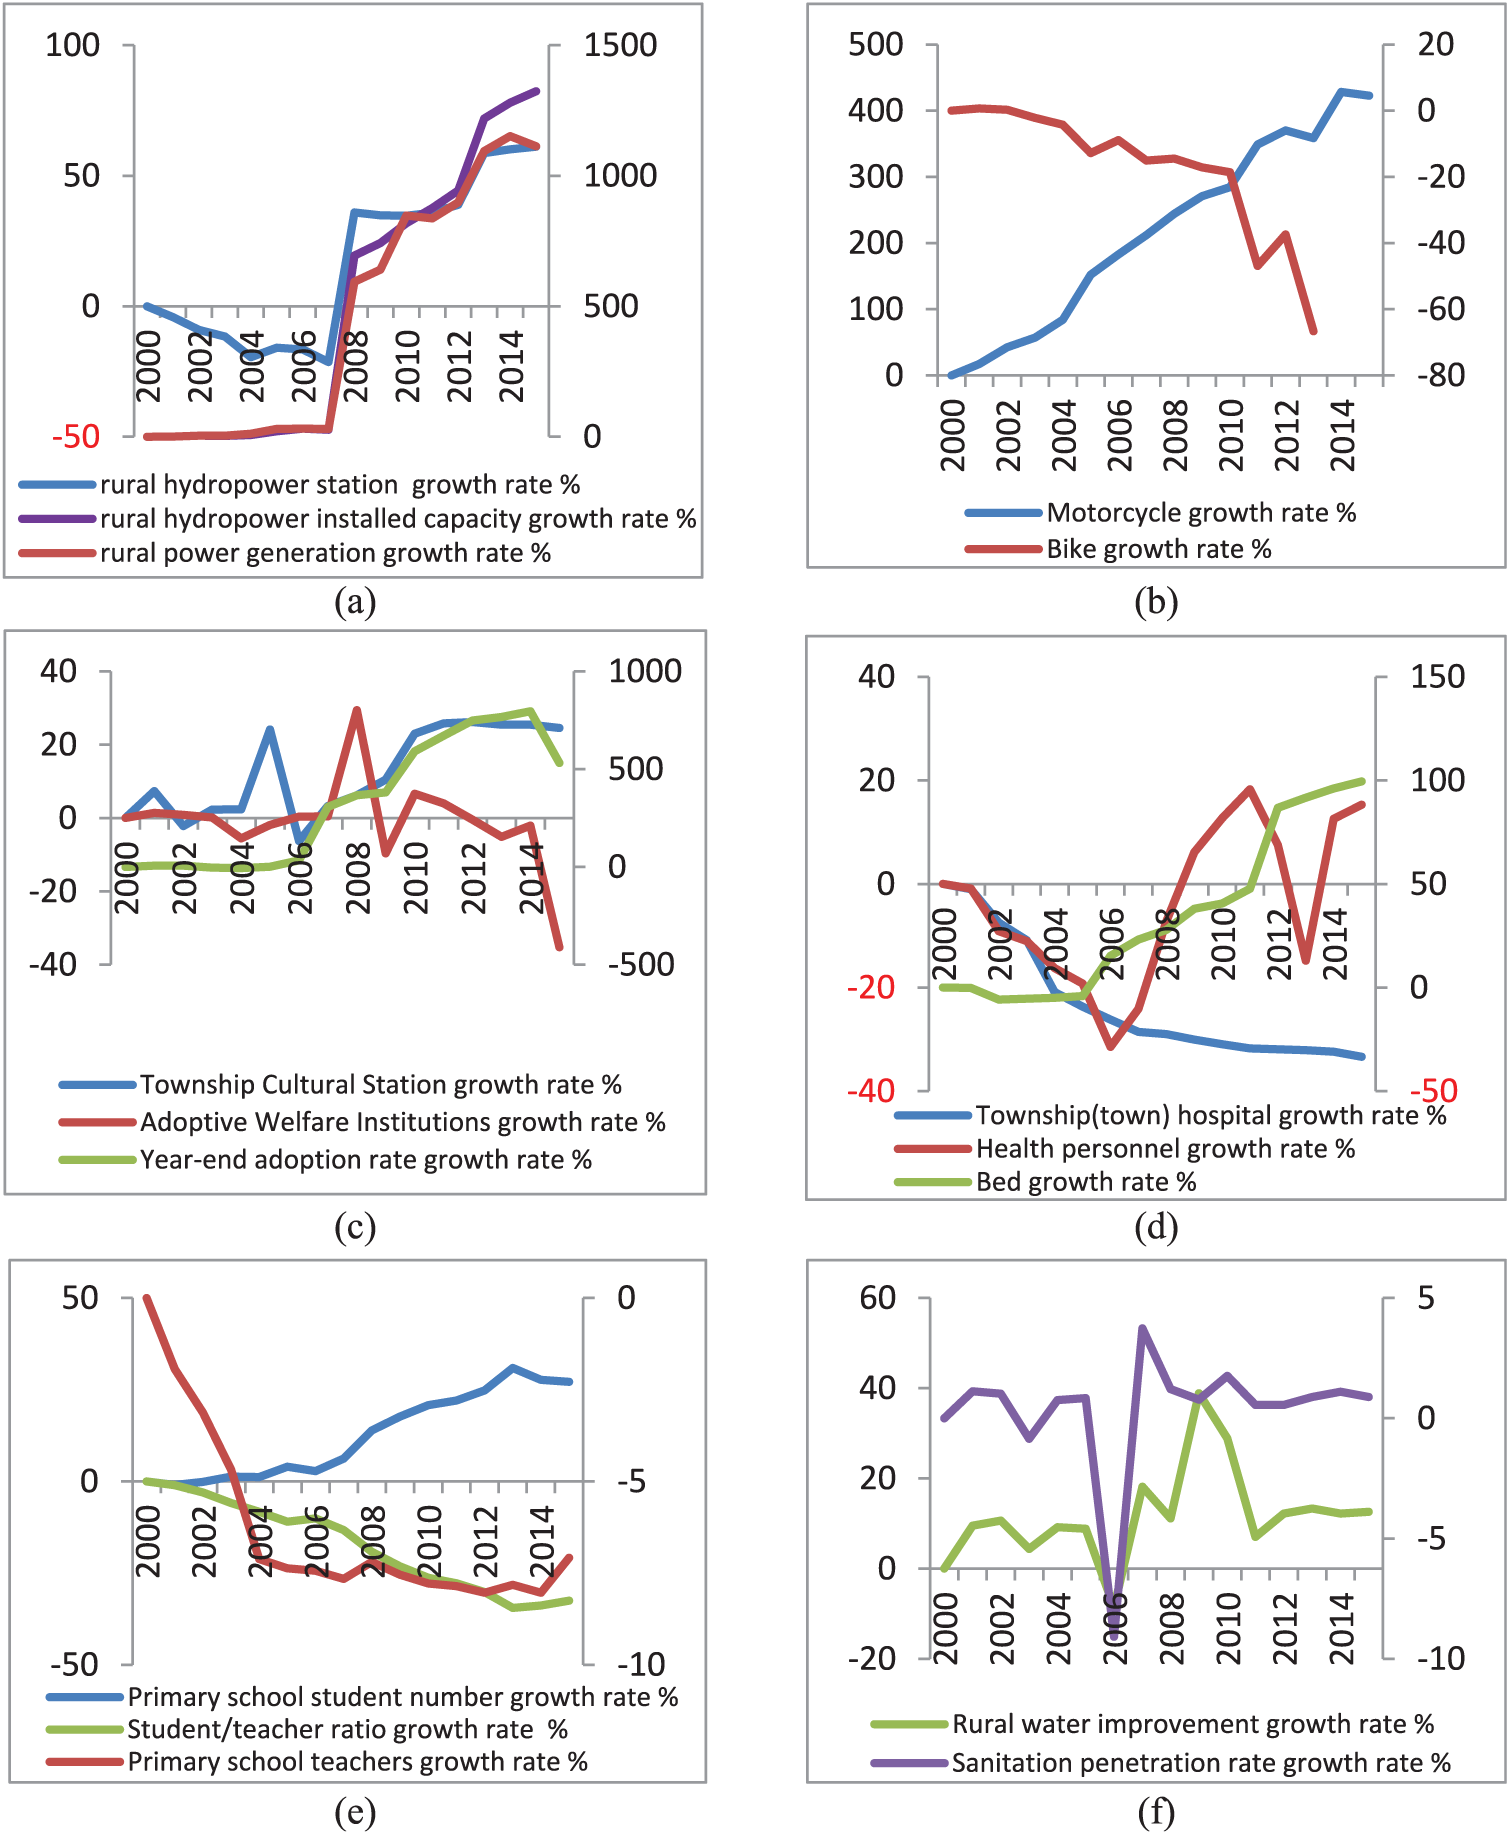
China’s rural power generation growth rate and the rural hydropower installed capacity growth rate continued to rapidly develop in the past 16 years, with the overall growth rate of 1046.98% and 985.61%, respectively. However, the growth rate was not evident; the overall growth rate was 58% by the end of 2015, thereby showing that rural hydropower stations are expanding rapidly in terms of scale rather than increasing in quantity. The overall growth trend chart shows that the growth rate of rural power generation is consistent with the trend of the installed capacity of rural hydropower stations, thereby indicating that the annual increase in the installed capacity was placed into production (Figure 2(a)). With the development of rural road construction, the number of motorcycle of rural residents also continued to increase. The overall growth rate of motorcycles per 100 households was 208.22%, and by the end of 2015, the proportion of rural residents with motorcycles was 68%. This corresponds to a continued decline in rural bicycle ownership in China. By the end of 2012, the overall growth rate of bike number of 100 households was −34.44%. No statistics of bicycle ownership was recorded in 2013–2015, but the data of bicycle ownership per 100 households, at 9.90, 11, and 13.30 (Figure 2(b)), began to appear in statistics. Access to roads increases the number of car ownership by residents and reduces the number of physical activities such as cycling.33–36 With the aspect of social and cultural welfare, the township cultural station and the elderly adoption welfare institutions showed a downward trend at −12.98% and −39.06%, respectively. However, at the end of the year, the number of adoptions continued to grow, with an overall growth rate of 169.05%, indicating that pension welfare institutions cause the situation of merger and expansion in the process of rural urbanization (Figure 2(c)). Similarly, the number of medical institutions in rural areas decreases by −25.21%, but the number of beds increases by 62.78% (Figure 2(d)). In the aspect of rural ecological environment, the growth of rural water supply total benefit rate fluctuated in the X axis, thereby showing that the rural water improvement project is basically universal and would change with the change in the rural resident population. The growth rate of rural sanitary toilets, which was 75% by the end of 2015, continued to increase year by year; however, the increase was not evident compared with other data (Figure 2(e)). The growth rate of rural primary school students and full-time teachers continued to decline, and the overall growth rates were −44.64% and −65.12%, respectively, by the end of 2015. A phenomenon of merging and relocation occurred in the process of urbanization, leading to a continued decline in the number of rural schools, students, and teachers. However, the number of teachers decreased slower than the number students, and the ratio of teachers to students in rural primary schools showed an increasing trend (Figure 2(f)).

Rural built environment changes of China.
Figure 2 shows that China’s rural built environment presents a regular change, basically no significant fluctuations occurred, thereby indicating that the overall control of China’s rural areas in an orderly development process was effective in the past 16 years. Compared with the built environment in rural China, the environmental changes in rural areas of Sichuan province fluctuated greatly, as shown in Figure 3.
Rural built environment changes of Sichuan.
The largest growth of rural built environment in Sichuan was still in the rural energy environment, and the overall growth rate of rural hydropower station installed capacity was as high as 1323.46, exceeding the national data with 337.85. The overall growth rate of the rural power generation in Sichuan was 1113.15, which was 66.17 more than the national data (Figure 3(a)). The rate of change of bicycle and motorcycle numbers per 100 households in rural areas of Sichuan is higher than that of the entire country. The overall growth rate of the number of bicycles was −66.63, the absolute ownership rate of which was 16.45%, and the overall growth rate of the number of motorcycles was 422.84, which was 214.62 higher than that of the entire country, by the end of 2013. No bicycle statistics was available in 2014 and 2015, but car statistics began to appear during that time, and the car ownership rate was 7.54% and 8.56%, respectively (Figure 3(b)).
The overall growth trend reveals no significant fluctuation in rural energy indicators, whereas the growth rates of other built environment indicators fluctuated evidently, such as rural elderly adoption welfare institutions, township cultural stations (Figure 3(c)), toilet popularity, and rural health personnel (Figure 3(d)). However, the overall trend is that the number of institutions, such as the elderly welfare institutions and health centers, decreases, and the overall level of accommodation, such as the number of elderly institutional adoptions and the number of beds in health centers, continues to increase. The situation of Sichuan is consistent with the overall trend of the country. In the process of urbanization, Sichuan province had the situation of service institution merger and expansion. For rural education, the change is generally consistent with the country. The number of students and teachers in rural primary schools continued to decline, and the number of teachers decreased faster than the number of students. The overall ratio of teachers to students increased (Figure 3(e)). The rural ecological environment, different from other environmental indicators, fluctuated in the X axis. The rural water supply benefit rate is particularly evident, indicating that rural water supply tends to be popularized mainly because of the resident population number (Figure 3(f)).
Comprehensive evaluation of rural built environment change
To comprehensively evaluate the changes in the built environment in China’s rural areas and the differences among provinces, this study uses the multi-index panel data factor analysis to study data from statistical yearbooks through statistical analysis. The indicators totally satisfy the specifications listed in Table 1. The data and provinces were selected by the principle that data missing values cannot be more than three consecutively. Finally, the data of 8 years from 23 provinces (including two municipalities: Chongqing and Tianjin) and China were selected. The missing values are supplemented by interpolation, and the data from statistical yearbooks are homogenized by population or household.
Factor analysis of multi-index panel data
Factor analysis is a multivariate statistical analysis method, which converts multiple measured variables into a few irrelevant comprehensive indexes. The few comprehensive indexes, namely, the factor, can reflect the main information represented by the multiple measured variables and explain the dependency relationship between these measured variables. Factor analysis is a method to study how to condense a large number of measured variables into a few factors with minimal information loss. The steps of the multivariable panel data factor analysis are shown by following formulas:
Calculating public factor score of each year

where
2. Calculating the comprehensive score of the rural built environment of each province in each year.
The environmental change formula of province

3. Calculating the total score of common factor of panel data.
The comprehensive calculation formula of the factors in the

4. Calculating panel data comprehensive score of each province.
The calculation formula of the comprehensive score of built environment for province J in 8 years is as follows

Empirical analysis
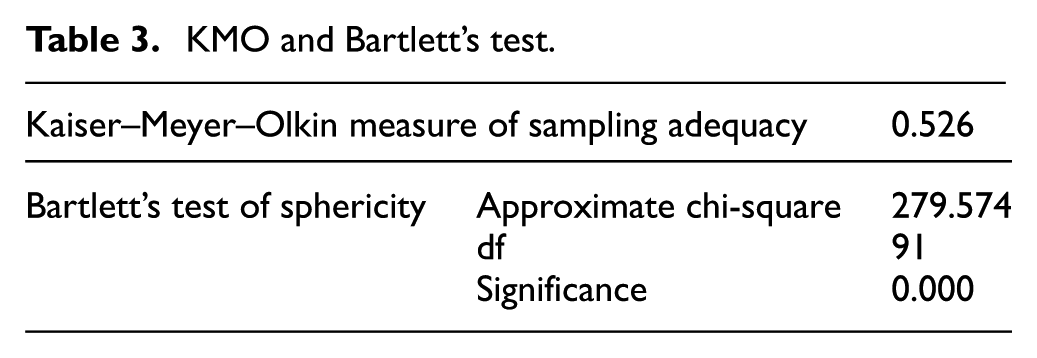
The evaluation index of the rural built environment is 14 indicators with different dimensions. The dimension inconsistency is eliminated first before analysis, and the data is standardized by Z-score. Kaiser–Meyer–Olkin (KMO) and Bartlett sphericity test were selected for the factor analysis. Taking the data of 2008 as an example, the KMO statistic is 0.526, which satisfies the minimum standard of 0.5, and the Bartlett spherical test corresponding probability Sig is 0.00, which rejects the original assumption of the unit matrix, thereby indicating the significant correlation between variables and that the data of 2008 are suitable for factor analysis. The data of other years are also suitable for factor analysis through KMO and Bartlett sphericity test. The following analysis is based on the sample data of 2008 as an example, and the KMO and Bartlett tests are shown in Table 3.
KMO and Bartlett’s test.
SPSS 23.0 is selected to conduct factor analysis for 14 indicators. The common factor was selected by the principle that the eigenvalue is more than 1, and the maximum variance rotation method is used to extract common factors.
Table 4 shows that the eigenvalues of the first four common factors are more than 1, and the rate of cumulative variance interpretation have reached 78.910%. Thus, the first four common factors are extracted, with few information losses.
Total variance explained.

The initial factor load matrix is orthogonally rotated by the maximum variance method, and the component score coefficient matrix is estimated by the regression method. The component score coefficient matrix is obtained, as shown in Table 5.
Component score coefficient matrix.

The score of the four common factors is calculated according to formula (1) (taking sample data of China in 2008 as an example)

According to formula (2), the comprehensive score of each province is calculated as follows (taking the data of Chinese sample in 2008 as an example)

Similarly, the comprehensive score of each year in each sample is calculated by eight factor analyses on 8 years’ statistical data. Table 6 shoes only the comprehensive scores of the national samples in each year.
The total score of national rural built environment in each year.

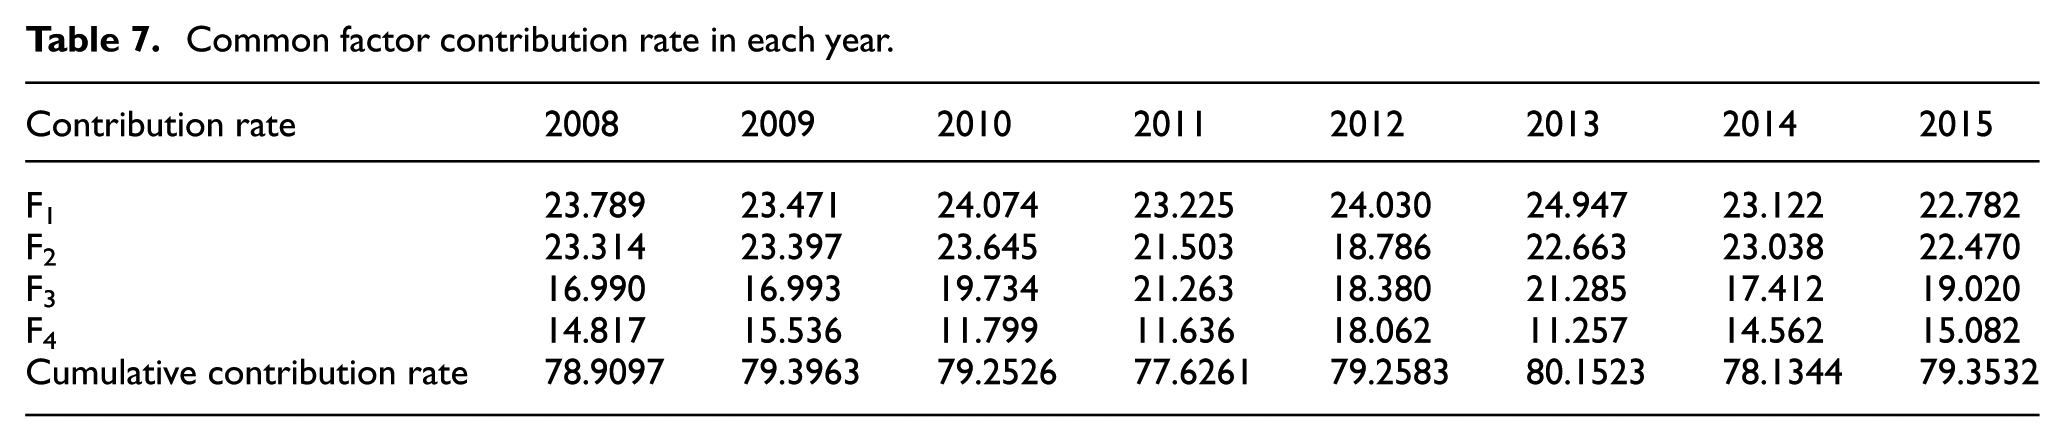
At the same time, the total variance explained could be estimated, and the common factor contribution for each year is shown in Table 7.
Common factor contribution rate in each year.
According to formula (3), the composite score of the common factors of panel data was calculated (taking the first factor of the sample data of China as an example)

The panel data comprehensive score of the provinces is calculated according to Formula (4) (taking the sample data of China as an example).

In the same way, the other public factors, score of each year, and the 8-year comprehensive score of other provinces can be calculated. The statistical analysis results are shown in Figures 4 and 5.

Comprehensive score in each year of provinces.

Common factors and comprehensive scores in provinces.
Result and discussion
Figure 4 shows that provinces show irregular fluctuation on the time axis, and significant changes occurred among years, thereby indicating that the rural built environment in China is in a period of rapid change and has not yet entered a mature and steady period. This finding is consistent with the actual situation of rural urbanization and new rural construction in China. The horizontal comparison of the overall level of the built environment in each province shows that the overall level of China’s rural built environment is in the middle level of provinces, and it is in line with the actual situation. Compared with other provinces, Chongqing, Fujian, and Sichuan have the highest level of rural built environment, whereas Ningxia, Guizhou, and Hunan are located in the latter three. This level is not the same as that of rural economic development in various provinces in China.38,39 The main reason may be that rural built environmental indicators in this research do not cover all indicators of rural economic development. Meanwhile, some provinces, such as Sichuan, have a well rural built environment order with a backward economic development, 39 indicating that these provinces have greater investment in rural built environment in the past 8 years. On the contrary, other provinces, such as Jiangsu and Guangdong, have a backward rural environment order with greater economy, 38 showing that the rural built environment is relatively mature and steady in such developed regions, and the subsequent input do not change significantly.
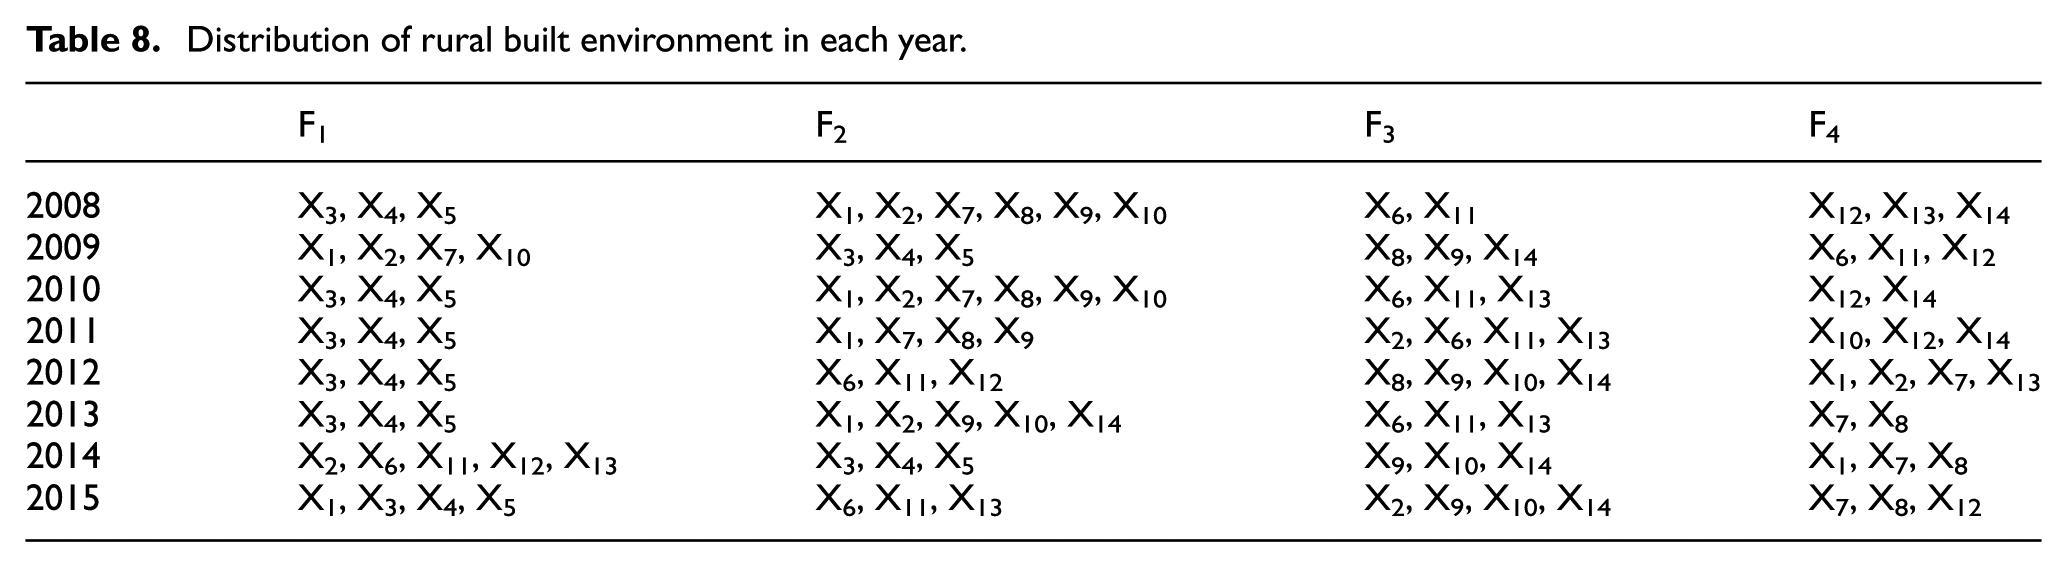
The comprehensive score of the common factors indicates that the score of the four extracted common factors from provinces is abnormally stable; thus, the selection and description of China’s rural built environment evaluation indexes is relatively steady in the perspective of statistics (shown in Figure 6). The comprehensive score of each factor is basically consistent with the final comprehensive score of each province, indicating that the evaluation results based on this index system are reliable. However, the distribution of common factors has no steady law in the case of the common factor scores in different years. The distribution of public factors in each year is shown in Table 8. The main reason for this phenomenon is still the statistical dynamic changes of China’s rural built environment. Provinces promote the rural construction with different levels and inputs under the background of vigorously developing the rural economy, leading to differences in provinces’ rural environment in different years. 40 The finding also fully shows that China’s rural areas are in a period of rapid development, and regular changes would not occur in a long period.
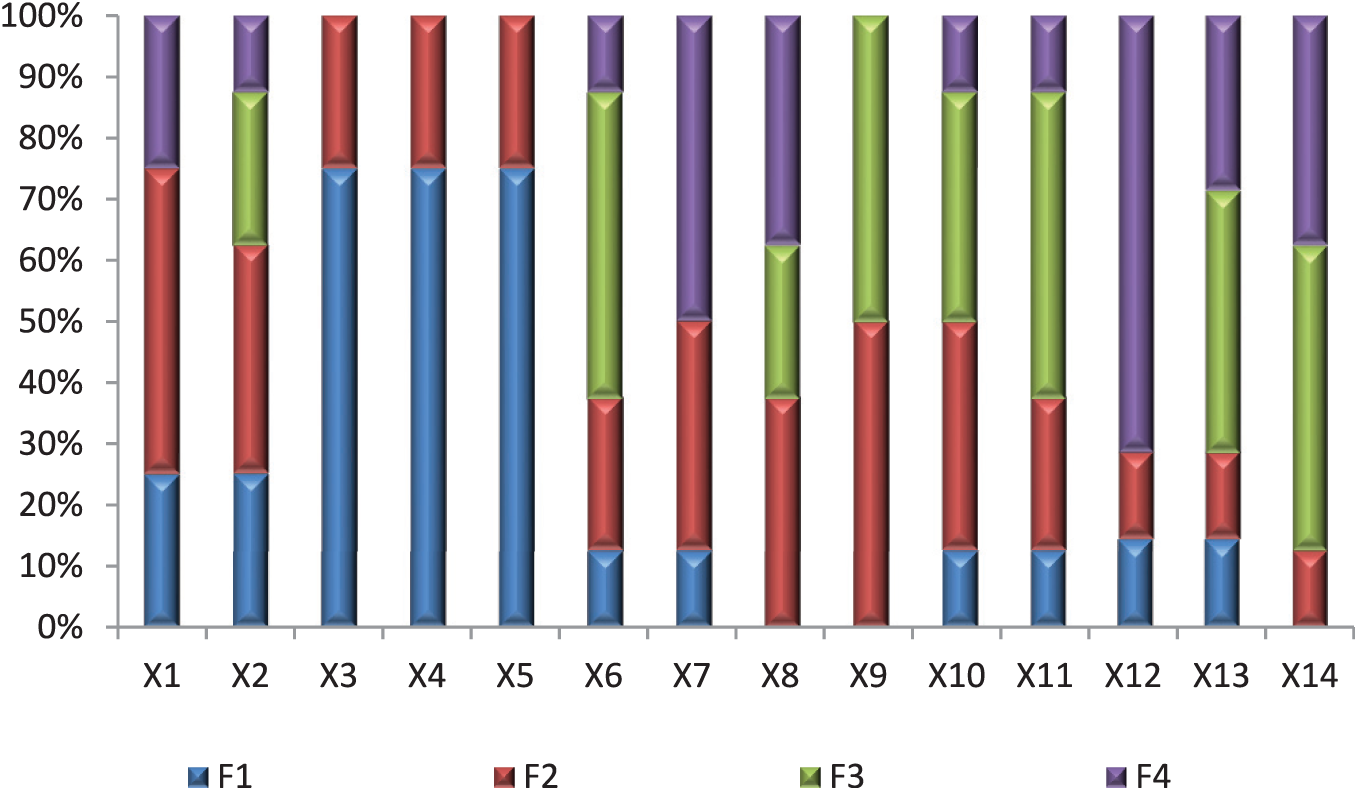
Common factor distribution.
Distribution of rural built environment in each year.
In the case of seemingly random distribution of factors, a relatively steady distribution of index was observed in common factors with a thorough statistics for the frequency of the environmental indicators to common factors. As shown in Figure 6, X1, X2, and X3, representing the hydropower station numbers of 10,000 people, rural installed capacity of 10,000 people, and rural power generation of 10,000 people, respectively, are relatively steady because of F1. These three indicators can be well explained as the rural energy built environment. The rural energy construction environment is concentrated in F1, and the cumulative contribution rate of variance have reach 23.67%, showing that China’s provinces have common input in the field of rural energy construction in the past 8 years. 41 The statistical data show that rural power generation is very consistent with rural household electricity consumption. The provinces’ investment in rural energy construction should satisfy the basic energy requirements of rural residents. With the improvement of rural residents’ living conditions, the increase in the household energy equipment and the continuous increase in the rural residents’ demand for energy become the internal driving forces of rural energy construction investment. At the same time, the installed capacity of rural hydropower station and power generation tend to be consistent, thereby fully showing that the energy construction investment is effective, the installed equipment operates effectively, and the investment production is reasonable under the impact of these internal driving forces. 41
The principle that the built environment index belongs to the public factor indicates that the frequency is absolutely the highest; thus, X1 (the beneficiary population per 10,000 rural people) and X2 (the population that knows sanitary toilet per 10,000 rural people) belong to F2. X1 and X2 could be regarded as rural ecological environment, and the average contribution rate of the variance of F2 is approximately 22.35%. The distribution of F2 is relatively steady, fully showing that the rural ecological environment of provinces has a relatively steady improvement in the past 8 years. The statistical data indicate that the rural water supply engineering in many provinces show a steady trend, no evident growth, with very small fluctuations accompanied by changes in the resident population of rural population, 42 indicating that the water supply project has been completed 43 and that it can satisfy the demand of rural residents in a period of time. However, the renovation of rural household toilets shows a steady and increasing trend, but the increase is small. It shows that the rural household latrine renovation project has been completed in a fairly large area, and the government will continue to invest in some parts, without renovation in the future. 43 According to the characteristics of wide distribution of China’s rural households, further renovation projects of household latrines will be in remote mountainous areas, and the regional difficulty and regional characteristics should be fully considered in these areas.
The built environment is attributable to a common factor; thus, X6 (rural township hospital number per 10,000 residents in rural), X9 (number of elderly adoption welfare institutions per 10,000 residents), X11 (rural township cultural station number per 10,000 residents), X13 (number of bicycle per 100 rural households), and X14 (the number of motorcycles per 100 households) belong to F3, which includes rural related institutions and transportation of rural residents. X7 (health personnel ratio per 10,000 residents) and X12 (rural primary school teacher-student ratio) belong to F4, which is the medical and education service ratio. The mean variance contribution rates of F3 and F4 are 18.88% and 14.09%, respectively. The distribution of these two factors was unsteady during the past 8 years; the indexes in the F3 and F4 of provinces showed irregular changes. With the construction of China’s rural urbanization and new rural areas, institutions cause merger, expansion, and relocation, and these situations occur differently in provinces. 44 Irregular changes in the number of institutions lead to irregular changes in the staff of the institutions, such as the number of medical staff, the number of rural teachers, and the number of students in rural primary schools. 45 With the continuous improvement of rural facilities and area differentiation in rural facilities, rural residents’ dependence on cars increased significantly in the past 8 years. However, the two indexes of vehicles are unsteady, and the variance contribution is insufficiently large because of regional differences.
X8 (number of beds in township hospitals per 10,000 rural residents) and X10 (adoption of elderly welfare institutions at the end of the year per 10,000 rural residents) cannot be extracted according to the principle that the built environment belongs to the highest absolute frequency of the public factor. With the development of rural urbanization and new rural construction, the number of institutions is in a dynamic and adjustive process, 44 and the optional nature of medical and elderly adoption services would be affected, whereas the demand for medical and elderly adoption services would have no influence. These two indicators represent the basic needs of life; we should pay attention to this type of resident needs in the next rural construction under the dynamic process.
Conclusion
This study analyzes the city built environment literature, summarizes the main micro-indicators reflected in the city built environment, and establishes a macro-indicator system for rural built environment comprehensive evaluation combined with the “China Statistical Yearbook,”“Chinese Rural Statistical Yearbook,”“China automobile market Statistical Yearbook,” and the statistical yearbook of the various provinces. According to the availability, continuity, and integrity of the data, descriptive analysis and multi-index panel data factor analysis were carried out to study China’s rural built environment. The following conclusions were obtained:
The built environment of China’s rural areas presents an upward trend on the time axis, and the fluctuation is insignificant among years, showing that the changes of China’s rural built environment are under the overall control.
The comprehensive score of the national rural built environment is in the middle level of the comprehensive score of the rural built environment in all provinces, and this finding is consistent with the objective law of statistics.
The rural built environment in provinces has irregular changes among years, and the comprehensive sorting fluctuates greatly. Thus, the rural areas in provinces are in dynamic development, and the development level and speed are different among years.
The common factor scores and the comprehensive score remained under abnormal consistency among provinces, indicating that factor analysis and factor extraction were steady in provinces and that the result of factor selection and factor analysis is reliable.
The overall distribution of common factors in each year is inconsistent, which indicates that the input and output of each province in different years are inconsistent, and the rural built environment in each province is in dynamic development with inconsistent level and speed.
The distribution of indicators in rural energy and ecological environment is relatively steady. This distribution is in line with the actual needs of rural residents for energy, thereby reflecting the effect of rural water supply and toilet renovation.
The distribution of the number of rural institutions and transport holdings show regularity, but they can be determined with the F3 and F4 according to the principle of the highest frequency. This finding is consistent with the phenomenon of merger, relocation, and residents’ dependence on cars in the process of rural urbanization and new rural construction.
The number of beds and the number of adoptions at the end of each year per capita could not be related to any common factor. One of the reasons is the dynamic change in institution number, and another reason is the steady demand of medical and geriatric adoption services. Therefore, this type of resident needs should be satisfied first in the next step of rural construction.
On one hand, this study attempts to fill the gap in the study of rural built environment, and on the other hand, it uses the simplest research methods for preliminary exploration and expands the indicators of China’s rural built environment. The overall conclusion shows that China’s rural built environment is in dynamic development, and it has a strong theoretical and social significance for the continuous study of China’s rural built environment.
Further study will focus on the influence of rural built environment on rural resident satisfaction and behavior. The research methods in this study are also applicable to other countries to investigate the present situation of the rural built environment, but appropriate adjustments should be made accordingly. The situation and indicators of the rural built environment vary from place to place. Thus, the applicability of the conclusions of this study in other countries still needs further discussion.
Footnotes
Acknowledgements
All authors contributed to the research presented in this article. C.C. and Y.A. had the original idea for the study; Y.W. analyzed the data; Y.A. drafted the manuscript, which was revised by C.C. and Y.W. All authors have read and approved the final manuscript.
Handling Editor: Gang Chen
Declaration of conflicting interests
The author(s) declared no potential conflicts of interest with respect to the research, authorship, and/or publication of this article.
Funding
The author(s) disclosed receipt of the following financial support for the research, authorship, and/or publication of this article: The authors appreciate the financial support from (JianQi 666) Promoting the Cooperation 24 between the Government of Sichuan Province and Social Capital (0050205502123); The Natural Science Key Project from Sichuan Provincial Department of Education (18ZA0048); The Fundamental Research Funds for the Central Universities (2012017yjsy215); The Fundamental Philosophy and Social Science Research Fund for Chengdu University of Technology (YJ2017-NS011); The Research on BIM Technology Resource Sharing Platform Construction and Cooperation Mechanism (CHJK{2017}119); and Development Research Center of Oil and Gas, Sichuan (CYQK-SKB17-04).