
Abstract
Traffic congestion index reflects the state of traffic flow. The detection and analysis on traffic congestion index can be used to estimate the operation status of roads, to plan and organize road traffic for traffic managers, and to make the reasonable decisions of travelers to travel. The traffic conditions of several evaluation indexes were analyzed. Based on the theory of fuzzy mathematics, some membership functions of the evaluating indexes were designed. Three calculation methods of traffic congestion index were proposed. Their calculation results were compared mutually. The conclusion revealed that using saturation calculated by the corresponding service level of traffic congestion index not well reflect the traffic situation, what’s more, travel speed is used to calculate the congestion index of the first method. Using comprehensive parameters can calculate the congestion index of the third method. Both them are roughly similar and in line with the actual traffic phenomenon.
Keywords
Introduction
To ease traffic congestion, identifying the state of road traffic should be considered first. The sequence steps targeted traffic facilities or the traffic management measures. Through the study of traffic congestion index, evaluation of road traffic condition can be more objective which contribute to the traffic planning and management, also is important to select path effectively and to reduce travel time for travelers. Traffic congestion index reflects the congestion state of possibility which can be sensed by travelers. It can be calculated using several traffic flow parameters based on fuzzy mathematics. 1
The state of road traffic congestion is a research hotspot in which many scholars have carried out extensive research. DL Shrank et al. 2 and MG Boarnet et al. 3 estimated several parameters of congestion index based on traffic survey according to different characteristics of the road sections and urban areas. Francois and Willis 4 tried to quantify the congestion and put forward a number of quantitative performance indicators. Liu et al. 5 studied Beijing traffic congestion index concept, calculation methods, and evaluation standards. Zhu 6 developed the city road traffic congestion evaluation index system. The real-time alleviation of traffic congestion index has been realized in Beijing. Mallinckrodt 7 proposed a simple model of regional average congestion delay which fit the Texas A&M Transportation Institute (TTI) delay data quite well.
In summary, the current domestic and international traffic congestion evaluation index can be divided into the following elements: crowded definition index, travel impact index, traffic flow parameters, service level indicators, and other indicators. Due to the microscopic level, overcrowding judgment index is the research foundation of all kinds of related parameters of crowded. As a result, most research is about the crowded judgment index, which is mainly used to determine the occurrence and severity of congestion. It can be indicated using travel time, delay rate, travel speed, and occupancy.
Some literatures studied on the reasons of congestion and tried to find the relative measures to solve traffic congestion. Arnott and Rowse 8 and Calthrop et al. 9 discussed some parking models and various combinations of road-pricing systems and parking charge systems to relieve congestion. Verhoef et al. 10 and Aftabuzzaman et al. 11 concluded that the optimal tolls for slow vehicles should be higher than fast drivers. Arnott and Lindsey 12 analyzed the model of road congestion subject to peak-load demand, and some economic implications of the structural approach were examined. Litman13,14 and Calfee and Winston 15 studied various demographic and economic trends that affect travel demand. Bigazzi and Figliozzi 16 found that congestion mitigation does not inevitably lead to reduced emissions and the net effect of mitigation depended on the balance of induced travel demand and increased vehicle efficiency. Liao et al. 17 established an index model of urban traffic network congestion based on historical traffic flow data and discussed the change of congestion index of urban traffic network in different times. S Jain et al. 18 established a model for prediction of travel time to determine the state of congestion on the segments using a congestion index. N Patel and A Mukherjee 19 proposed a new formula termed the Traffic Congestability Value (TCV) to quantify traffic congestion in the different spatial zones of a study area characterized.
Based on the basic knowledge of fuzzy mathematics, the congestion index is regarded as the possibility of traffic congestion on road, which is denoted by the membership degree. Through the analysis of several kinds of traffic running state evaluation index, the design of the membership functions of traffic congestion index of single index and integrated index will be evaluated based on the investigation of traffic congestion index.
Three calculation methods of traffic congestion index are compared regarding to Shugang Road, Dalian city in China. Results showed that the serious congestion existed during the morning rush hour, and it took travelers much delay. The running speed and combination method of congestion index is more objective and consistent with the actual road conditions. Evaluation results obtained using the hybrid index are more complicated, accurate, and practical than results using single index. The traffic congestion index using saturation has a big deviation to reflect the field traffic status because two different traffic statuses probably have a same saturation degree, which can be seen from the graph of traffic flow versus velocity. The advantage of using the fuzzy inference is that each criterion can be expressed directly in language, the input value can be the approximate value, and the evaluation result is better.
Parameters of road traffic congestion
Traffic congestion can be divided into road congestion and intersection congestion; in this article, main research is focused on road congestion, and the indicators involved are saturation degree, average speed, travel efficiency, low-speed proportion, total delay, average stopping number, and time length. Four main indicators are as follows.
Average travel speed
According to road traffic congestion, the average speed of vehicles can be divided into five levels. The larger speed level is, the more serious road congestion is. The detailed information of the traffic flow grade 20 is shown in Table 1.
Evaluation grade of traffic flow using average velocity (km/h).

Road saturation degree
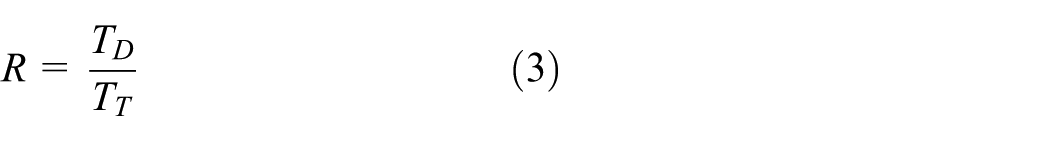
The road saturation degree is the ratio of the survey traffic volume to road capacity. It can reflect the relationship between transportation demand and transportation supply. And, it indicates the service level of road

where S is the road saturation degree; V is the field traffic volume on the road (veh/h); C is the field capacity on the road (veh/h). There is a certain corresponding relationship between the saturation degree and the service level.
Travel efficiency
The travel efficiency means the loss of speed caused by road congestion

where E is travel efficiency,
Low-speed proportion
Low-speed proportion is the proportion of low speeds to all vehicles’ speeds during total travel time
where R is low-speed proportion,
Calculation of traffic congestion index
Field survey
Shugang Road is an urban expressway, bi-directional, and four lanes, in Dalian, China. Shugang Road is an urban arterial road. It is an extension of the Shenyang–Dalian highway. Shugang Road is the urban expressway connecting Dalian Port and Xinan road. There is no traffic signal lamp on the 7.5-km-long road section, so we can observe stable vehicle flow. By surveying a section of Shugang Road from 7:00 to 19:00, two cameras were used to record license plate numbers of the entry lane in two road cross sections. The start time and end time can be recorded for the sections. So, the travel time of vehicles, the flow rate, and speed can be calculated.
The site of field survey was on the roadside of Shugang Road as Figure 1. Dalian traffic police detachment issued the permission for the location. The photographs were obtained with video camera toward the vehicles on the road. The study was not carried out on private land. Monitoring facilities were prohibited to install in intersections of Shugang Road. With the approval of the traffic police on duty on the Shugang Road, we use the bracket to mount camera, which was set on the roadside.

One site of field survey on the roadside of Shugang Road.
Congestion index based on the travel speed
This method is based on the average speed of vehicles, which can be used to evaluate the traffic congestion of the single road or the road network. Calculation steps are as follows:
It is supposed that the statistical period is divided into M days, each day is divided into N time intervals, and there are SR roads in the research area.
Two symbols are defined including
The speed of each road section can be determined according to the statistical data.

The traffic congestion index
where
The traffic congestion index

where

where qi is the proportion of flow rate of the ith day in the whole survey period.
The average velocity of Shugang Road during different time intervals can be calculated by video survey. Depending on the type of road, for Shugang dredging port road, the velocity of 50 km/h is chosen as the acceptable travel speed, and 10 km/h is chosen as the minimum travel speed.
Because of surveying the same jth road section at the same ith day, congestion index

The traffic congestion index during different time intervals is shown in Table 2.
Traffic congestion index based on travel speed.

Congestion index based on saturation degree
Average saturation degree and service level of urban roads can be referenced in China. The designed capacity is 1400 veh/h for the road which design speed is 60 km/h. The extent of congestion will increase when saturation degree enlarge. Saturation degree can be divided into six stages and road congestion index can be calculated in the range of 2–10. The membership function of the road congestion index C2 is designed using saturation degree x2. The evaluation function is as follows 6

According to the saturation degree, traffic parameters of 12 time intervals in a day are evaluated as Table 3.
Calculation values of congestion index based on saturation degree.

Congestion index based on comprehensive parameters
Congestion level can be evaluated using comprehensive parameters including travel efficiency, low-speed proportion, and saturation degree. All of them can be obtained by video survey. They are combined into the traffic congestion index by fuzzy inference.
Build membership functions
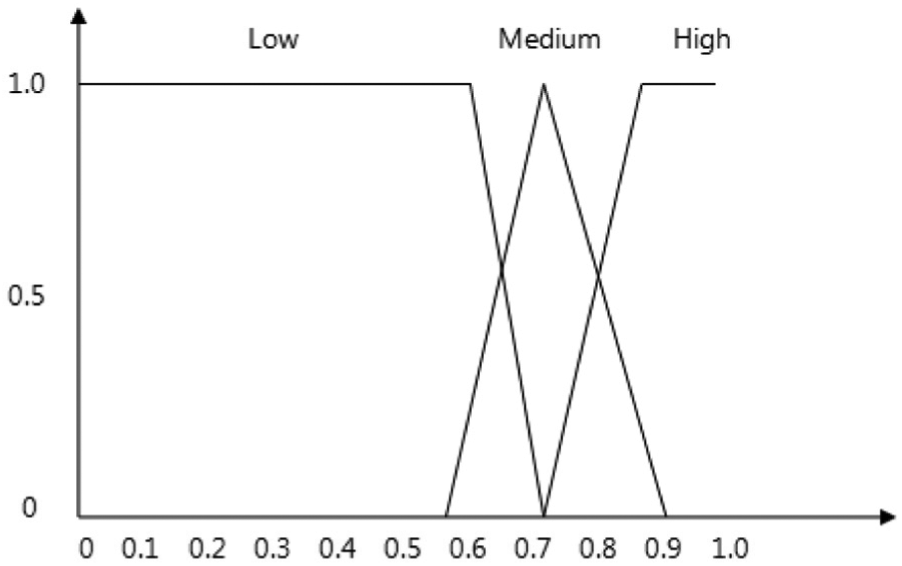
Low-speed proportion is divided into three levels including low, medium, and high levels. Low level means the jam continues a short time and traffic operation is ideal. However, the traffic flow is in congested state for a long time at high level. Figure 2 shows the ladder-type membership function for low-speed proportion. 1 The corresponding membership function of the low-speed proportion for the low level, medium level, and high level are as follows

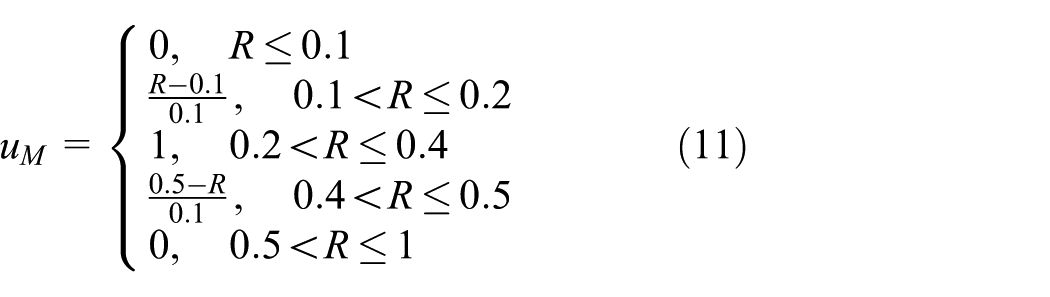

where R is the low-speed proportion,

Membership function graph of travel efficiency.
The travel efficiency is divided into six levels, respectively, with A, B, C, D, E, and F, from very good (A, close to 0) to very poor (F, close to 1), which can be distinguished from Figure 3. For example, when the low-velocity proportion is 0.67, its corresponding membership degree vector of A, B, C, D, E, and F are (0, 0, 0, 0, 0.3, 0.7).

The membership degree of low-velocity proportion.
In the same way, the membership function can also be built when saturation degree is divided into three levels as Figure 4.
The membership degree of saturation degree.
Calculate membership degree
Memberships of the travel efficiency, saturation degree, and low-speed proportion can be calculated with certain weights. Weights of low, medium, and high level to low-speed proportion are 1.0, 0.6, and 0.2, respectively. Weights of travel efficiency with A, B, C, D, E, and F level are, respectively, 0, 0.2, 0.4, 0.6, 0.8, and 1. Memberships of three parameters can be calculated in turn.
For example, traffic flow is 3246 veh/h (vehicles per hour) during 9:00 to 10:00. The saturation degree of 1.16 can be obtained by equation (1). Travel efficiency of 0.65 can be obtained by average velocity of 21.23 km/h using of equation (2). The designed speed of Shugang Road is 60 km/h, so low-speed proportion can be calculated using formula (3).
Because the measured speeds are all above 10 km/h, low-speed proportion is 0. The membership degree of the travel efficiency is 0.89, the membership degree of saturation degree is 1, and the membership degree of low-speed proportion is 1. The measured traffic data and the membership degrees of indexes are as Table 4.
The membership degree of every index.

Fuzzy inference of congestion index
Determine the level of each time period in the three indicators.
The process of fuzzy inference can be used to calculate the congestion value. The principle of maximum proximity degree 1 can be available to determine the final grade.
For a congestion-level determination method, if the travel efficiency state is A, low-speed rate state is “low,” saturation state for the “big,” the congestion level is “moderate,” specifically identified standards are shown as Table 5.
Fuzzy standard of congestion level.

“Blocked” denotes serious traffic jams which cause a great deal of delays; “Very” denotes very crowded; “Moderate” is in medium congestion; “Smooth” is in a free traffic flow. The crowed order is “Smooth,”“Moderate,”“Very” and “Blocked” from small to large.
Using travel efficiency, low-speed proportion, and saturation degree corresponding to membership, the road congestion level can be obtained by Table 5. The congestion level is divided into four subsets including smooth, moderate, very crowded, and blocked.
2. Determine the congestion state at each time period.
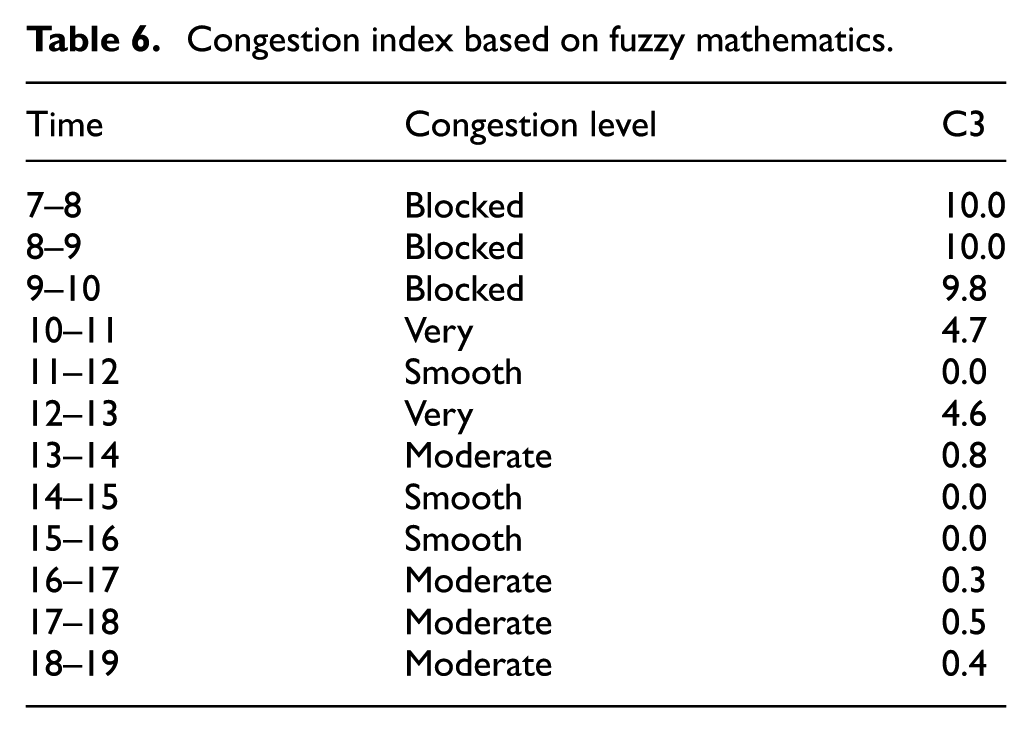
The congestion state at each time period can be determined from Table 5. For example, the level of low-speed proportion is “Low,” the level of the travel efficiency is “F,” and the level of saturation degree is “High” during 9:00 to 10:00. The congestion state is “Blocked” in the same time interval. The congestion states of Shugang Road from 7:00 a.m. to 7:00 p.m. are shown in Table 6.
Congestion index based on fuzzy mathematics.
3. Calculating congestion index C3.
Given the relative membership function of each congestion state, the X axis denotes traffic congestion index C3 between 0 and 10. The minimum value of three membership degrees is set as the comprehensive membership degree among travel efficiency, low-speed proportion, and saturation degree. So, the relative congestion index C3 can be derived as Figure 5.

The congestion index based on comprehensive parameters.
The calculation results of C3 for Shugang Road are shown in Table 6.
Compare and analysis
The results of three methods are compared as shown in Figure 6.

Three kinds of congestion index results.
From Figure 6, Shugang Road had serious traffic congestion from 7 o’clock to 10 o’clock. The jam had been greatly alleviated after the morning rush.
Results of C2 had a big deviation from other two methods. Evaluation values are larger than field values. Different traffic statuses on a road section probably have a same saturation degree, which can be seen from the two-phase parabola graph of traffic flow versus velocity. So, the traffic congestion index cannot well reflect the field traffic condition by saturation degree. Congestion index C1 and saturation parameter C3 are broadly similar. Both of them conform to field traffic situation on Shugang road.
The calculation method of traffic congestion index is simple by travel speed. Evaluation results of the congestion index C3 are more complicated and accurate, and are corresponding to practical survey. Using fuzzy inference is easy to express some rules by intuitive sentences. The evaluation effect is ideal despite of inputting approximate values.
Conclusion
Road congestion problems have been becoming more and more prominent and have brought great distress to the public. Traffic congestion index developed by the original intention is for road pass walkers provides the current status of the road, as far as possible to avoid congestion, and congestion loss is reduced to a minimum. In this article, the current situation of urban road traffic congestion in Dalian is analyzed, and the part of the characteristics of traffic congestion in Dalian is revealed. Through the analysis of several kinds of traffic state evaluation index, based on fuzzy mathematics, the membership degree function of traffic congestion index is proposed using analysis and evaluation of the single index and the composite index, at the same time, compared with each method.
The three methods are calculated based on the field data of the Shugang Road in Dalian City. According to the results, it can be seen that the crowding phenomenon existed, congestion was serious during the morning rush hour, the traffic flow running speed was slow, and it took travelers much delay. The traffic congestion index by saturation has a big deviation to reflect the field traffic status. Through the analysis and comparison of three methods, we can find the running speed and combination method of congestion index to be more objective and consistent with the actual road conditions.
Results obtained from C3 and C1 were similar to the field results. The calculation method of traffic congestion index by saturation is simple. It can be used as a result of rapid calculation of traffic congestion index. Evaluation results obtained using the hybrid index are more complicated, accurate, and practical than results using single index. Comprehensive index accords with the reality, errors of judgment state would not happen. But C2 is prone to errors of judgment because two different traffic statuses probably have a same saturation degree, which can be seen from the graph of traffic flow versus velocity. The advantage of using the fuzzy inference is that each criterion can be expressed directly in language, the input value can be the approximate value, and the evaluation result is better.
Footnotes
Handling Editor: Jose Antonio Tenreiro Machado
Declaration of conflicting interests
The author(s) declared no potential conflicts of interest with respect to the research, authorship, and/or publication of this article.
Funding
The author(s) received no financial support for the research, authorship, and/or publication of this article.