
Abstract
In view of the braking process for the megawatt wind turbine brakes, considering the geometric and motion characteristics of brake pads and brake discs, a displacement gradient circulation method is put forward in this article, to resolve the deviation of coupling results caused by the difference of friction effect along the radial/circumferential direction of brake disc, and the thermal–structural coupling analysis of friction pair during the braking process is carried out. A three-dimensional model of transient heat transfer for brake friction pair is built based on the Abaqus software. The heat flow density is loaded by the displacement gradient circulation method, which is used to calculate the frictional heat flow during the braking process. The analysis results show that along the circumferential direction of the brake disc the temperature distribution in the friction zone is non-uniform and the temperature starting from the contact position of the brake disc and the brake pad decreases along the counterclockwise direction. The thermal stress caused by the temperature field during the braking process is the main factor causing the brake disc/pad failure. The effectiveness of the method and the model is verified by the designed inertia braking experiments. The analytical method proposed in this article provides a reference for simulating the friction braking process of large-size disc brakes.
Keywords
Introduction
The wind turbine generators need parking brake in the cases of excessive wind speed, troubleshooting and daily maintenance. In order to ensure quick shutdown and operational safety during the maintenance, the mechanical braking is required and therefore the wind turbine brake is an essential device for wind turbine generator. When the brake is applied, the friction between the non-rotating element and the rotating element is used to prevent the rotation or the tendency to rotate, and finally to shutdown the system of wind turbine generator. In the process of braking, due to the uneven contact of the friction pair, the actual contact area is far less than the nominal contact area. And contact discontinuities causing uneven distribution of contact surface temperature lead to thermal deformation of the disc, which directly affects the contact state and contact stress, and further affects the input intensity of friction heat conversely. This coupling behaviour leads to the thermoelastic instability (TEI) 1 and then causes the brake vibration and noise. 2 At the same time, the thermal stress can easily cause heat fading of the friction material, generate initial cracks and intensify the surface scraping of the friction surface. 3 Thus, in the process of braking, the temperature field and stress field have great influences on the braking efficiency of wind turbine brake, and the coupling analysis of the two fields is an important part of the brake design and an important theoretical basis for friction material selection.
Extensive researches have been carried out on the mechanism of the braking process. The surface temperature model of the brake friction surface was proposed by Bolk 4 in the early stage; then Jaeger 5 developed Bolk’s theory, demonstrated and proposed the mathematical model of the rectangular mobile heat source on the semi-infinite surface. Since then, most researches have focused on the multiple heat sources as well as the influences of the interaction between heat sources on the friction surface temperature. Hua and Xiang 6 based on the study of energy dissipation during the braking process of disc brake established the finite element (FE) model of the transient temperature field analysis of brake disc and friction plate. Azarkhin and Barber 7 hypothesized that one of the contact bodies was adiabatic, combining the Fourier transform method and Green formula, and solved the transient thermal elastic problem based on Hertz contact. Zagrodzki 8 studied the stress field problem of the brake disc, in addition to the temperature field. The braking process was simplified into two-dimensional axisymmetric problem; assuming that the contact condition and heat flow transmission were independent of coordinates, the distribution of the temperature field and stress field of the brake disc was obtained. Shahzamanian et al. 9 presented the transient and contact analysis of functionally graded brake disc using ANSYS Parametric Design Language (APDL). The effect of the number of divisions was investigated, and the effect of contact stiffness in functionally graded brake disc was investigated for transient analysis. Wang 10 applied the cyclic iterative calculation method to load the heat flux density. This method can simulate the stress–strain distribution along the circumferential direction of the brake disc in a better way, but it did not consider the influence of the radial rotation speed difference of the brake disc during the actual braking process. Belhocine and Bouchetara 11 analysed the thermal behaviour of the full and ventilated brake discs of vehicles. The numerical simulation for the coupled transient thermal field and stress field was carried out by sequential thermal–structural coupling method based on ANSYS to evaluate the stress fields and deformations. Manjunath and Suresh 12 carried out the transient thermal and structural analyses of thermomechanical behaviour of the dry contact of the brake disc during the braking phase. The coupled thermal–structural analysis was used to determine the deformation and the von Mises stress established in the disc for both solid and ventilated discs with two different materials to enhance the performance of the rotor disc. Yevtushenko and Grzes 13 performed a numerical simulation of frictional heating in a disc brake of a typical passenger vehicle based on the equation of motion and the boundary value problem of heat conduction. The influences of temperature-dependent coefficient of friction on the sliding velocity, braking time, braking distance and thermomechanical wear were studied. And then they performed an experimental study of a single braking process based on actual dimensions of the sliding components of the railway braking system, operating parameters and properties of materials. The cast-iron brake disc combined with the pads made of the advanced organic composite material was examined. The properties of the friction material using the pulsed infrared (IR) thermography were determined. The numerical FE solution to the thermal problem of friction for the pad–disc braking system was obtained. The calculated changes in transient temperature fields of the pad and the disc during braking were presented. 14 Kennedy and Tian 15 were the first to study disc brakes using the numerical simulation method, but their numerical model was axisymmetric and could not effectively simulate the braking process. Zhu et al. 16 proposed a probabilistic framework for fatigue life prediction and reliability assessment of a high-pressure turbine (HPT) disc to incorporate the effects of load variations and mean stress. The most dangerous region of an HPT disc can be generally located through FE structural analysis. By interpolating the boundary conditions of elastic–plastic stress analysis, distributions of the stress strain response of the HPT disc can be obtained.
In this article, the coupling of temperature field and structure field in brake friction is considered in the practical braking condition of a megawatt wind turbine brake. A three-dimensional (3D) transient thermal–structural coupling model of the braking process is established by the Abaqus software. The heat load method of friction braking area is focused on, the displacement gradient circulation method is put forward, and the traditional coupling model in Cartesian coordinates is expressed in cylindrical coordinates, which simplifies the thermal load. And the analysis results reveal the transient distribution and change law of the temperature and equivalent stress of the brake disc/pad in the braking process. The proposed methods offer some insights to the simulation of the high-speed and heavy-load mechanism in the process of multi-physics coupling and the field effect non-uniform distribution.
Establishment of the coupling model of brake friction pair
Establishment of the heat conduction model
Large-megawatt wind turbine brakes produce a lot of friction heat at work, which generates the temperature distribution gradients in different directions in the brake disc/pad. The main heat transfer modes of the brake disc/pad in the disc brake is heat conduction and thermal convection, and there is a small amount of heat radiation generated from the high brake disc/pad temperature during the braking process. Due to the fact that the changes of friction coefficient and some physical parameters caused by the frictional heat have little effect on the temperature field and stress field distribution trend of the wind brake disc/pad based on the displacement gradient circulation method; in the establishment of the heat conduction model, the following assumptions are made:
The materials of brake disc/pad are considered as isotropic and the sliding friction coefficient is constant during the sliding process.
The materials in the braking process generate only linear elastic deformation and the impact of material wear is ignored.
The contact surface of the brake disc/pad plate is an ideal flat plane and the instantaneous temperature of each contact point pair on the contact surface is equal during the braking process.
During the braking process, all the friction energy is converted into heat, also the brake pad has uniform heat dissipation, and the brake disc shows non-uniform heat dissipation.
According to the actual braking condition of the large megawatt wind turbine brake, during the braking process, the main heat transfer mode of the inner material of the brake disc and brake pad is heat conduction; besides, the main heat transfer mode in the surface contact area is also heat conduction; the main heat transfer mode of the non-contact area of the brake disc is the thermal convection with the surrounding air; at the same time, a small amount of heat radiation can be found on the brake disc and brake pad.
According to Fourier’s law, the heat conduction law about the boundary of heat flux is obtained
where q is the heat flux, λ is the boundary thermal conductivity, ∂T/∂n is the temperature gradient in the direction normal to the boundary and the negative sign on the right side of the equation indicates that the direction of heat transfer is opposite to the direction of the temperature gradient.
The basic formula for convective heat transfer is the Newton cooling formula

where hc is the convective heat transfer coefficient and ΔT is the temperature difference between the fluid and the solid surface. Radiative heat transfer is based on the Stefan–Boltzmann law. The heat flux of radiation heat transfer can be calculated by

where ε is the emissivity, the value of which is less than 1, σ is the Stefen–Boltzmann constant, the value of which is σ = 5.67 × 10⁻⁸ W/(m2 k4), and T1 and T2 are the surface temperature and ambient temperature, respectively.
Calculation of thermal stress
From assumption (2), there is only linear strain in the object due to the thermal expansion, and the shear strain is zero. This strain caused by the material thermal deformation can be seen as the initial strain of the object. In the calculation of stress, the initial strain term is included and the relationship between thermal stress and heat flow density can be obtained

where
For the 3D model, the integrated brake pad temperature expression is derived by 17

where
Boundary conditions
According to the actual braking conditions, it can be considered that the brake pad does not move while the brake disc is rotating counterclockwise. Since the brake pressure acts on the top surface of the brake pad rather than the friction surface, it is assumed that the pressure acting on the top surface is uniform and the elastic deformation of the brake disc and the brake pad is considered. The brake pad is fixed to the brake linkage and the grooves on both sides of the brake pad can be assembled on the guide rail to slide up and down along the guide rail. Therefore, the fixed constraint in the directions of X and Y-axes are exerted on the brake pad, as shown in Figure 1.

Relative positional relationship of brake friction pair and displacement constraints.
The method of displacement gradient circulation of heat flux density
Analysis of working conditions about displacement gradient circulation method
The movement of the disc is different from that of the pad in the braking process of wind turbine brake where the brake pad is only in contact with the ring belt area swept by the surface of the braking disc. And the whole bottom surface of the pad is always in contact with the braking disc according to the assumptions. However, the non-contact area between the braking disc and the pad is much larger than the contact area at the same time. This is necessary to be considered when the method for thermal–structural coupling of the braking disc is analysed.
As shown in Figure 2, as the brake disc rotates anticlockwise in the braking process, the unit study area is defined as the contact area swept from Position 1, which is shown in Figure 2(a), to Position 2, which is shown in Figure 2(b), on the brake disc at any time. It can be seen that the unit study area includes a complete process of heat transfer between the disc and the pad, as shown in Figure 2(c). It can also be seen that the brake disc rotating one revolution is a complete cycle, according to the positional relationship between the study area and the contact area of the brake pad. Because the linear velocity of friction for the brake disc is equal to that of the pad in the position with the same radius, the circular linear unit, the radius of which is ri and the width of which is Δd in the study area, is selected as shown in Figure 2(d). For easy understanding, it is assumed that the linear elements of the brake pad slide into the unit study area at the initial linear speed as v, and do the uniformly decelerated and cyclic movement on the circular linear unit. That is to say, the rotational displacement is equivalent to the sliding displacement. Every cycle can be divided into five stages, as Stage 1 to Stage 5, based on the different positions of the brake pad relative to the unit study area of the brake disc, as shown in Figure 2(e). The displacement gradient cyclic loading method can be proposed, as the differences along the circumferential and radial directions of the brake disc are taken into account holistically.

Illustration of displacement gradient circulation method: (a) Position 1, (b) Position 2, (c) unit study area, (d) circular unit and (e) study stage.
The coupling equation deduction using the displacement gradient circulation method
The thermal radiation difference of the brake pad, due to its movement on the unit study area of the brake disc, is ignored. It needs to be discussed in stages because of the different ways of heat exchange in the above five stages.
Stage 1 is the pre-slide-in stage in which the unit study area of the brake disc is about to slide into the pad, but is not in contact with the pad yet. Thus, the heat exchange includes only the heat convection between the unit study area and air. At this stage, the angular velocity is w1 at time t1. The formula of heat flow loading is given by the proper change due to the size of the unit study area of the brake disc according to equation (2)

Stage 2 is the sliding-in stage in which the unit study area of the brake disc has started to slide into the pad, and it has been in contact with the pad partially. Thus, the heat exchange includes thermal conduction of the brake pad in the contact area and the heat convection with air in the non-contact area. The formula of heat flow loading of every part in Stage 2 is given by the proper change due to the size of the unit study area of the braking disc according to equations (1) and (6) from Stage 1

where A2–1 and A2–2 are the proportions of the contact area and non-contact area in Stage 2, respectively, and ∂T/∂τ is the temperature gradient of the contact surface between unit study area and brake pad. Figure 3 shows the equivalent movement at different stages. According to the geometric relation in Figure 3(a), the areas can be calculated as

Equivalent movement at different stages: (a) the stage for slide-in and (b) the stage for slide-out.
The total input heat flow in Stage 2 Q2 is the sum of heat transfer of the brake pad and the heat convection with the air, which is given as

The formula of total heat flow loading is given by combining equations (7)–(9) as

Stage 3 is the fully slid-in stage in which the unit study area of the braking disc has slid into the pad completely, and it has been in contact with the pad completely. At this stage, the heat exchange only includes thermal conduction of the brake pad in the contact area. And the formula of heat flow loading is

Stage 4 is the sliding-out stage in which the unit study area of the brake disc has started to slide out of the pad, and part of it becomes out of contact with the pad. Thus, the heat exchange includes the thermal conduction of the braking pad in the contact area and the heat convection of air in the non-contact area. Being similar to Stage 2, the formula of heat flow loading can be given as

where A4–1 and A4–2 are the proportions of the non-contact area and contact area in Stage 4, respectively. According to the geometric relation in Figure 3(b), the areas can be calculated as

The formula of total heat flow loading in Stage 4 Q4 is given as

Stage 5 is the fully slid-out stage in which the unit study area of the brake disc has slid out of the pad completely, and the condition of heat exchange is the same as Stage 1 as

The coupling equation of the displacement gradient circulation method can be obtained in the type of user-defined functions which can be invoked and calculated by Abaqus.
Case study of thermal–structural coupling based on displacement gradient circulation method
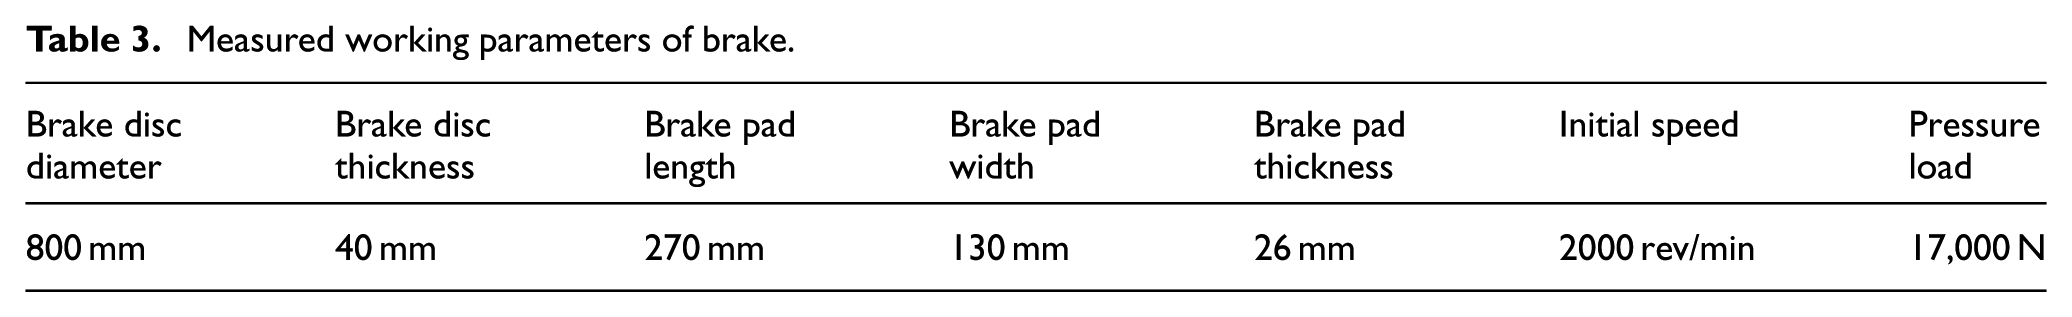
The structure of a certain model megawatt wind turbine brake is taken as an example. The material of the brake disc is high-thermal conductivity cast iron. According to the motion of the brake disc, the displacement gradient circulation method is used and, considering the changes of material parameters with temperature and the influence of heat dissipation, the simplified model of 3D transient FE for brake friction pair is built. The model is subjected to sequential thermal–structural coupling solution using Abaqus FE analysis software. The initial speed of the brake disc is 2000 rev/min and the brake pressure load is 17,000 N. The heat flux density function is compiled based on the displacement gradient circulation method. The brake load is applied on the top surface of the brake pad. The friction heat flow is applied to the friction zone on the bottom surface of the brake pad by loading function. The load steps for thermal analysis are set and the thermal elements generated in the temperature field are converted into the structural elements, so the friction can be loaded. Finally, the *.odb file generated by heat analysis is loaded into the structure analysis file of the brake pad as a bulk load. The time steps and the load time are controlled by global command flow. The material parameters required in the analysis are shown in Tables 1–3.
Material properties of brake pad.

Material properties of brake disc.

Measured working parameters of brake.
Characteristics of temperature field distribution of brake disc
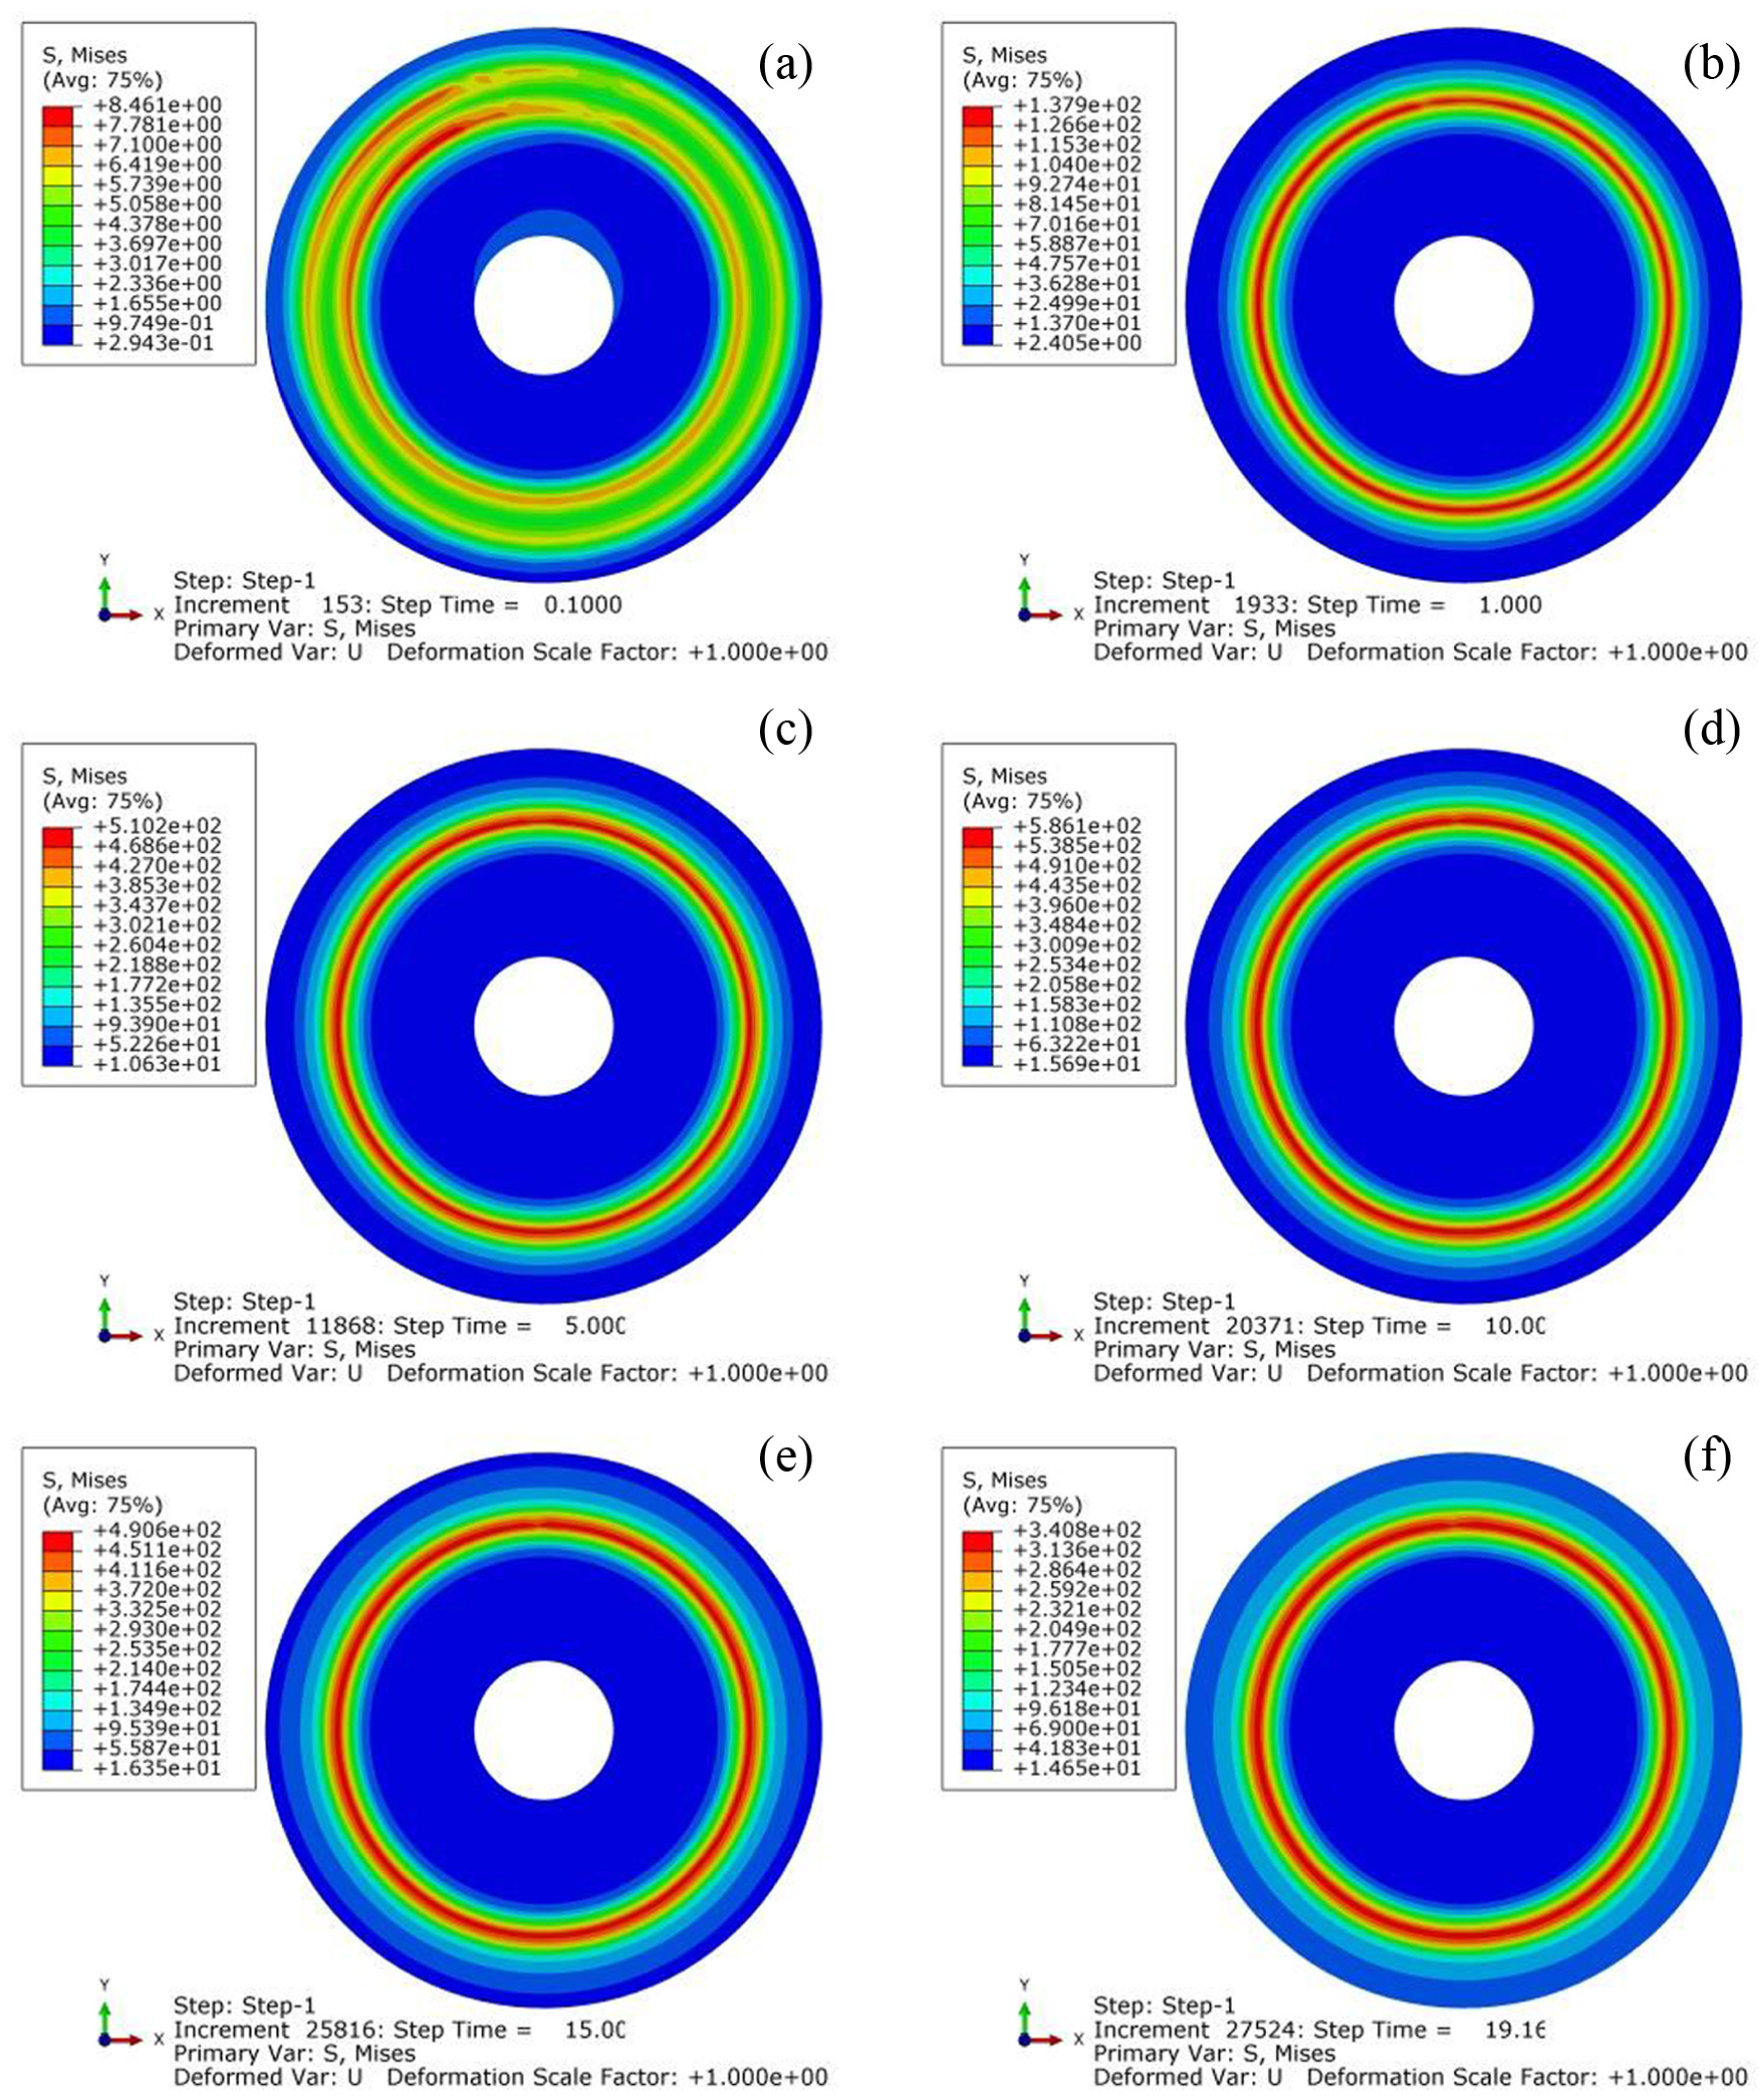
Figure 4 shows the distribution of the transient temperature field of the brake disc obtained by the displacement gradient circulation method at different times. The brake disc temperature increases initially and then decreases with the braking process going on. The temperature distribution of the brake disc is not uniform. The high-temperature region is concentrated in the friction zone and the non-friction region has almost no temperature rise. The difference between the maximum and the minimum temperature increases gradually. The maximum temperature is related to the size of the contact area of the brake disc/pad. At first, the location with a large size of contact area has high temperature and then the high-temperature zone is concentrated in the friction zone of the central ring (at the radius of brake disc of 265 mm). The temperature rise zone near the friction zone diffuses towards the centre of the disc with the braking process going on. It can be seen from Figure 4(a) that an annular temperature zone is produced in the friction zone of the brake disc. A significant non-uniform temperature distribution is observed along the circumferential direction of the brake disc.

The temperature field distribution at different braking times: (a) at 0.10 s, (b) at 1.00 s, (c) at 5.00 s, (d) at 10.00 s, (e) at 15.00 s and (f) at 19.16 s.
In order to quantitatively study the temperature distribution in the circumferential direction of the brake disc shown in Figure 4, 24 equal spacing nodes are taken along the circumference in the brake disc contact surface at the radius R1 = 265 mm along the clockwise direction. The radian–temperature curve at 0.1 s braking time is shown in Figure 5. The starting point is the node closest to the Y-axis on the left side of the Y-axis, and the end point is the node closest to the Y-axis on the right side of the Y-axis shown in Figure 2. The limit value of the temperature difference at this moment is not large, and the temperature decreases and fluctuates along the counterclockwise direction from the left end of the contact zone with brake pad (at 0.12π rad in Figure 5) to the right end of the contact zone (at 1.82π rad in Figure 5). In addition, the temperature on the left side of the contact area is slightly higher than that on the right side.

The temperature change curve along the circumferential direction of brake disc (0.1 s).
The friction heat generated during the braking process in large-megawatt wind brake acts on the friction zone of the brake disc and is conducted to other parts through heat conduction between the brake disc and brake pad, as well as thermal convection. At the start of the braking, there is a temperature difference between the contact area and the non-contact area of the brake disc, and in the contact area the temperature rises while in the non-contact area the temperature does not change. During the braking process, the brake pad is fixed and the brake disc rotates counterclockwise. The brake disc rotates about four turns at the time of 0.1 s, so there is a large temperature gradient of the whole contact surface at that time. This results in the non-uniform temperature distribution along the circumferential direction of the brake disc and further verifies the effectiveness of the displacement gradient circulation method. With the braking process going on, the role of heat conduction becomes significant. Therefore, the width of the annular temperature region in the friction zone of the brake disc is extended. As the size of the brake disc is large, the linear velocity of the brake disc at the edge is larger than that near the centre. Hence, the frictional heat flow generated at the outer end is larger than that generated at the inner end. However, at the outer end the heat dissipation condition is better than that at the inner end, and the heat convective transferred to the air at the outer end of the brake disc is more than that at the inner end. The combined effect of the two makes the high-temperature zone on the contact surface of the brake disc concentrated in the frictional contact area near the middle of the brake disc radius.
On the contact surface of the brake disc, along the Y-axis direction, the nodes at the radius values of R1 = 265 mm, R2 = 295 mm, R3 = 325 mm, R4 = 355 mm, as shown in Figure 2(b), are taken, respectively, to draw the node temperature curves as shown in Figure 6 where we can see that the radial temperature gradient of the brake disc is very large. The temperature of R2 and R3 is high, especially in the middle of the braking process, while the temperature of R1 and R4 is always low. The temperature trends of the nodes R2 and R3 show similar convex shape. In the first half of the braking process, the temperature of the node increases with zigzag fluctuations, after the turning point about 2/5th of the whole braking process; in the second half, the temperature of the node decreases with zigzag fluctuations, and the upward trend is higher than the downward trend. The fluctuation frequency decreases with the progress of the braking process, but the node temperature at R2 is always higher than that at R3. The former reaches the maximum temperature of 782.7°C at about 7 s, while the latter is lagging behind and reaches its maximum temperature of 425.9°C at about 9 s. The node temperature trends at R1 and R4 are similar. They are raised slowly with the braking process and tend to be modest before the end of the braking. The curves of R1 and R4 change more smoothly than the curves of R2 and R3, but the node temperature of R1 is always higher than that of R4.

The node temperature of the brake disc in the radial direction at different times.
It can be seen from Figure 6 that the brake disc contact surface undergoes a very complex heat exchange process during the braking process. The three kinds of heat exchange effects are also different at different times and different positions. When the nodes R2 and R3 slide into the contact area, they directly contact with the high-temperature area of the brake pad; in addition to the production of a large amount of frictional heat flow, there is part of heat flow into the nodes from the high-temperature zone through the form of heat conduction, so that the nodes are encountered with thermal shock, which results in a large temperature gradient. When the nodes R2 and R3 slide out of the contact area, the main heat exchange form is heat dissipation towards the air. Since the braking process is the deceleration movement of the brake disc, the heat flow input of each turn reduces and the heat flow output increases. At first, the heat flux input is greater than the output and the node temperature rises. Then the input and output of heat flow of each node reach equilibrium at about 7 and 9 s, respectively, and the node temperature reaches the maximum value. At last, the heat flow input is less than the heat flow output, and the node temperature starts to decrease. Because each node contacts with the brake disc periodically, in a contact period, the node temperature rises and decreases suddenly forming a zigzag fluctuation in the curve. With the reduction of rotating speed of the brake disc, the contact period increases and the fluctuations tend to be gentler.
The characteristics of stress distribution in brake disc
Using the heat–displacement coupling element of ABAQUS/Standard module, the temperature field analysis elements are converted into the structure field analysis element, so the structure field boundary conditions can be loaded. Then the friction load of the friction zone is simulated by defining the contact model of brake friction pair. Finally, the thermal analysis result *.odb file is taken into the structure field analysis as a body load.
Figure 7 shows the transient equivalent stress distribution of the brake disc at different times using displacement gradient circulation method. Combined with Figure 4, it is found that the equivalent stress distribution is similar to the temperature field distribution, the high stress area is mainly concentrated in the contact zone with the brake pad, and there is an annular equivalent zone in each contour figure. As the braking progresses, the difference of the maximum and the minimum stress, that is, the limit stress difference, increases gradually, and the high-value part of the contour has the trend to spread towards both sides along the radial direction of the brake disc. At 0.1 s, the equivalent stress diminishes along the counterclockwise direction starting from the contact position of the brake disc/pad, similar to the temperature field. But there is also a significant difference between stress field and temperature field distribution. Initially, the high-stress areas mainly act on the friction zone of the brake disc and the area near the centre on one side. There are also some stresses in the rest of the area, but the stress distribution is uniform. From the equivalent stress contour after 1 s, the stress distribution near the centre of the brake disc becomes as uniform as the other non-friction zones, but the stress is not zero.
The von Mises stress distribution at different braking times: (a) at 0.10 s, (b) at 1.00 s, (c) at 5.00 s, (d) at 10.00 s, (e) at 15.00 s and (f) at 19.16 s.
This is because the brake pressure initially applies on the contact surface; when the rotation of the brake disc is driven by the inner ring, the deceleration braking would make stress concentration near the centre, producing mechanical stress. Then the brake disc temperature rises producing thermal stress, and at the time of 0.1 s, because the temperature rise is not so large, the combined action of mechanical stress and thermal stress can be seen clearly. But after 0.1 s, with the temperature rising rapidly, the influence of thermal stress on the stress distribution of the brake disc becomes dominant gradually.
It is important to note that in the whole braking process the minimum stress value appears in the annular belt near the friction zone instead of the area near the centre of the brake disc; therefore, the stress difference near the position of the minimum radius in the friction zone is large, which is easy to cause a non-uniform deformation of the material, leading to the failure on the brake disc. Compared with the influence of mechanical stress on the stress distribution of the brake disc in the braking process, the influence of thermal stress generated from non-uniform temperature field is more significant; therefore, the analysis of thermal stress is the main focus to study the problems of high stress cracking and damage of the brake disc.
On the contact surface of the brake disc, along the Y-axis direction, the nodes of R1, R2, R3 and R4 whose locations are the same as above are taken, respectively, to draw the node equivalent stress time-varying curves as shown in Figure 8, from which it can be seen that the curves of nodes R1, R2, R3 and R4 are all the convex curves. There are also zigzag fluctuations in curves during the whole braking process, and the zigzag fluctuations in the second half of the braking process are extended especially near the end. The trends of the R2 and R3 curves are similar to those of temperature change of the corresponding nodes and the equivalent stress curves are smoother near the peak, while there are also some pulse fluctuations during the whole process of braking.

The nodes’ von Mises stress of the brake disc in the radial direction at different times.
And it should also be noted that the nodes R1 and R3, which are equally spaced either side of the node R2, have obvious differences in change trends corresponding to the node temperature trends. Compared with the node temperature in Figure 6, the equivalent stress of the node R1 is increased. And the trends of the curves R1 and R3 are similar. The maximum stress of the node R1 appears at around 11 s and that of the node R3 appears at around 9 s. At first, the stress curves of the two nodes are neck and neck, and after 10 s or so the stress value of the node R1 becomes more than that of the node R3 till the end. Combined with Figure 6, the radial equivalent stress distribution in the contact surface of the brake disc is more uniform than the temperature distribution.
From the trend similarity between the radial nodes’ stress and time-varying temperature on the contact surface, the thermal stress change is crucial to surface stress changes of the brake disc. The pulse fluctuation of the equivalent stress during the braking process is caused by the coupling effect of temperature field and structure field. Because stress is an instantaneous quantity, the stress variation of certain node on the brake disc surface would immediately cause the stress change of other associated nodes, producing a chain reaction. The stress of the node R2 increases quickly as shown in Figure 8. For the nodes R1 and R3, on top of the influence of thermal stress by themselves, they are also affected by the stress from the node R2. As the radius of R1 is smaller than that of R3, the node distribution of R1 is denser, which makes it more affected by stress transfer, so the stress value of the node R1 is greater than that of the node R3. In addition, the heat conduction inside the material needs the accumulation of time, which leads to the temperature gradient difference with time greater than the equivalent stress difference with time; therefore, the equivalent stress distribution is more uniform than the temperature distribution along the radial direction of the brake disc contact surface.
Experiment of inertial brake test
The braking experiment is carried out in a 1:1 inertial brake tester, as shown in Figure 9. The test machine can complete various types of disc brake tests and can be used for the basic braking performance tests with high speed and heavy load for the large-megawatt wind brake products. There are 20 different kinds of braking inertia for the test bench, the maximum inertia is 1000 kg m2 with the inertia differential of 50 kg m2, and the highest speed of the main motor is 2500 rev/min, which can meet the requirement of the brake test in the emergency working condition.

Wind turbine brake tester.
The sizes of the brake disc and brake pad as well as the installation position on the test machine are consistent with the FE analysis model; the experimental conditions are shown in Table 4 and the experiment is carried out according to the emergency braking conditions.
Test condition parameters.

Under the conditions shown in Table 4, the test data from the sensor are entered into the computer. The test results of the speed and temperature curves shown in Figure 10 are plotted based on the test data of the contact surface at the radius of 325 mm of the brake disc. As can be seen from Figure 10, the braking process is approximately uniformly decelerated and circumferential rotation, and at about 18.8 s the braking process is completed. The temperature change curve of the sampling point is approximately the convex curve and reaches its highest temperature of about 439°C at 2/5th of the braking process.

Test results from the inertia brake tester: (a) speed data and (b) temperature data.
Figure 11 shows the comparison between the test results and simulation results (R3 curve in Figure 6), which shows that the two curves have the similar temperature change trend overall. In Figure 11, the braking temperature has not changed at the beginning, and the temperature of the test curve increases gradually after about 1.0 s, while the temperature of the simulation curve increases after about 0.5 s. This might be because the temperature sensor requires a certain amount of response time to sense the temperature change. During the braking process, the temperature rise rate of the simulation result is basically the same as that of the test result. At 7.1 and 9.1 s, both the simulation and test curves reach their highest temperatures of about 439°C and 445°C, respectively, and the error of the time when the highest temperature appears is about 2 s; however, the values of the highest temperatures of both curves are very close. After the peak temperature, the two temperature curves begin to decrease, with the simulation results lagging behind the test results for about 2 s, which may be caused by the setting error in the thermal conductivity of the material during the simulation. It can also be seen from Figure 11 that there are zigzag fluctuations in both temperature curves during the braking process, which also proves the similarity between the simulation and test results.

Comparison of the test temperature and simulation temperature versus time.
As the temperature sensors are easily affected by the environment, operating conditions and other factors, besides, in the braking experiment, the material properties and loading conditions of the test workpiece are not strictly consistent with the simulation data, so the measured temperature curve is different from the simulated temperature curve at different braking times. Under the influence of the comprehensive experimental error, the temperature change trend of the simulation curve is basically consistent with that of the test curve indicating the effectiveness of the simulation model.
Conclusion
Based on the theory of FE method, this article has studied the thermal–structural coupling analysis of brake disc/pad during the braking process of the megawatt wind turbine brakes. By fully considering the geometry and motion of the brake disc in order to improve the thermal–structural coupling method, the displacement gradient circulation method is proposed for the brake disc to overcome the deviation of coupling results caused by the difference of the friction effect along the circumferential direction of the brake disc. The simplified model is analysed with thermal–structural coupling and the analysis results reveal the transient distribution and change law of the temperature and equivalent stress of the brake disc/pad in the braking process. Finally, the effectiveness of the method and the rationality of the model are verified by the inertial brake test. In this article, the thermal–structural coupling is analysed during the braking process of the brake friction pair. The law of temperature distribution, changes and distribution in coupling on thermal deformation for the disc/pad under high speed and heavy load conditions are revealed. The results provide solutions for making efficient large brakes. The following conclusions are obtained:
Through the transient FE analysis of the brake friction pair, the transient distribution and change law of the temperature and equivalent stress of the brake disc are obtained. Along the circumferential direction of the brake disc, the temperature decreases along the counterclockwise direction starting from the contact position of the brake disc/pad. This phenomenon shows that the displacement gradient circulation method can effectively simulate the distribution difference along the circumferential direction of the brake disc.
The temperature gradient in the radial direction of the brake disc is very large, the maximum temperature distributes close to the middle of the friction zone on the contact surface of the brake disc, and the temperature rise is small in the non-friction zone.
According to the analysis of the temperature field and stress field distributions of the brake disc, it can be found that the equivalent stress distribution of the contact surface is more uniform than that of the temperature. During the whole braking process, the stress difference near the position of the minimum radius in the friction zone is large, which is easy to cause non-uniform deformation of the material.
Footnotes
Handling Editor: Shun-Peng Zhu
Declaration of conflicting interests
The author(s) declared no potential conflicts of interest with respect to the research, authorship and/or publication of this article.
Funding
The author(s) disclosed receipt of the following financial support for the research, authorship and/or publication of this article: The research work was supported by the National Natural Science Foundation of China under Grant Nos 51475066 and 51675075 and the Natural Science Foundation of Liaoning Province under Grant No. 2015020114.