
Abstract
The occupants inside the fire site often only have a few minutes to evacuate, which is referred to as the golden evacuation time. In this study, total evacuation time was divided into response time, moving time, and waiting time. A regression model was adopted to incorporate three independent variables (floor area, number of exits, and per-floor occupant load) and determine their effect on a dependent variable, called as the evacuation time. Despite its widespread use in multiple domains, regression analysis has not been used to explore the evacuation time. The total evacuation time is to leave a fire site can successfully escape the fire. Here, the results indicated that the occupants left a fire site less than the total evacuation time. The total evacuation time calculation can also be applied to a fire protection system; this allows emergency personnel to update the total evacuation time in real time, while simultaneously informing occupants of the remaining available time to safely escape from a fire site. This study showed that regression analysis is a useful method for evacuation time calculation and can serve as an assessment tool in fire accident–related scientific research and accident investigation.
Introduction
During a fire accident, occupants inside a building who seek to evacuate demonstrate varying response times (RTs) from the moment they receive a warning to the point at which they decide to evacuate. Various complex factors can influence the evacuation of affected personnel in a disaster site, including occupants’ familiarity with evacuation routes, their abilities to operate evacuation facilities and fire protection apparatuses, personnel density in the space, and occupants’ psychological and physical statuses and behaviors. Evacuation time (ET) is affected by various factors. In addition to identifying gaps in behavioral prediction techniques, Kuligowski 1 reassessed existing evacuation simulation technology to propose a simulation model (the protective action decision model) that can estimate occupants’ behaviors during building fires. He also suggested that this model can serve as the basis for a conceptual model of occupants’ decision-making and actions during a fire accident. Because occupants at a fire site tend to demonstrate highly uncertain behavior, designing an evacuation scheme requires a simple quantification method, which can be used to resolve problems concerning such behavior. In addition, the results obtained through this method can be compared with the actual cases to verify the total evacuation time (TET) of all affected personnel. 2 RT is essential for the calculation of the TET because a fast RT enables a short TET and therefore a high survival rate.
This research suggests that fire monitoring systems must be used to reduce occupants’ RT during fire accidents. 3 For example, implementing a smart fire protection–oriented management platform can be used to detect fire accidents automatically and transmit a message about the fire to an alarm switchboard; the switchboard can then sound the fire alarm to indicate the location of the fire and inform the occupants of the evacuation direction.4,5 Such a platform is a valuable reference for managing the safety of environments inside buildings. In Li et al., 5 a fire spread model that can predict the available egress durations (AEDs) of all locations and integrate the length and AED of each evacuation path into a cohesive map was designed. Day et al. 6 reported that after the 2001 attacks on the World Trade Center (WTC) in the United States, occupants inside the buildings demonstrated RTs of 0–30 min. Specifically, they found that the average RTs of the occupants inside Buildings 1 and 2 were 4.3 and 5.3 min, respectively, yielding an integrated mean RT of 4.8 min. Their results also suggested that RT is affected by individual behavior.
Other academic research regarding and investigations into fire accidents have been conducted using full-scale fire site simulation experiments7,8 and simulation software.9–12 Because computer simulations can generate results approximating those of full-scale experiments and investigation reports and also require less resources and work, such simulations have become preferred for research. In the field of fire science, evacuation simulation and modeling comprise a quintessential topic,2,3 the results of which can be used to develop building design safety regulations. Previous studies have obtained highly representative results using the Fire Dynamics Simulator with Evacuation (FDS +Evac) tool to simulate fire accidents and evacuation 13 and by employing relevant theoretical models.14,15
According to the extant literature, regression analysis has not been employed for ET estimations; however, this method has been adopted in numerous academic studies and scientific analyses on various related topics. For example, Khaled et al. 16 used regression analysis to estimate the physical and geometric characteristics of fire propagation and to examine the spreading behaviors of forest fires for improving risk management. Barbero et al. 17 provided a simulation basis for predicting very large fire occurrences resulting from climate. Gatternig and Karl 18 examined several variables, such as bed ash concentration, particle size, fluidization velocity, and fuel ash composition, and predicted the maximum operable agglomeration-free temperature. With adequate data, regression analyses can be adopted to predict the ET, behaviors, and psychological characteristics of personnel involved in specific disasters or accidents. Chow 19 simulated ET in public access places and the waiting time at exits, identifying the waiting time at crowded areas as a key component of ET.
The evacuation data collected by Chow 19 were also applied herein. Specifically, this study compared ETs derived from regression analysis and case simulation to verify the accuracy and reliability of a regression model. The remainder of this article is arranged as follows: section “Statistical analysis method” addresses the definition of ET and calculations for regression analysis, section “Case study and simulation plan” presents an experimental design and discusses the simulation software, section “Limitations and calibration” compares the simulation and regression analysis results, section “Discussion” describes the advantages and limitations of the proposed model, and section “Conclusion and future work” presents the conclusion and suggestions for future research.
Statistical analysis method
Regression analysis is a statistical method that predicts and evaluates the relationships between independent and dependent variables. In such an analysis, independent variables can be measured or controlled, and dependent variables change according to the values of the independent variables. By inputting independent variables in a regression equation, researchers can determine the variation of dependent variables. Hence, regression analysis facilitates the estimation of dependent variables. In this study, floor area, number of exits, and per-floor occupant load serve as three independent variables of a regression model, and ET is set as the dependent variable. If the proposed regression model is verified to estimate ET accurately, it can be embedded in fire suppression systems to support evacuation. Because floor area and the number of evacuation exits are fixed and because per-floor occupant load can be calculated using an access control system, ET can be estimated through the fire suppression system that has received information about the current occupant load transmitted from the access control system.
Concepts of ET
Machado Tavares and Galea
20
defined various temporal stages and periods that are common in evacuation processes. For example, the available safe egress time (ASET) refers to the period of time from ignition (IG) to the point where a fire creates untenable conditions (UC) to human survival. The required safe egress time (RSET) refers to the period of time from IG to the successful evacuation of occupants (EVAC). Accordingly, the RSET must be smaller than the ASET for evacuation to be successful. Machado further defined the components of an evacuation process as follows: IG—Ignition (the point when a fire starts); DET—Detection (the point when the detection systems are activated; i.e. sprinklers); AL—Alarm (the point when the alarm is sounded); REC—Recognition (the point when occupants recognize that an emergency situation is taking place); RESP—Response (the point when occupants respond to the situation and begin escape movement); EVAC—Evacuation (the point when occupants start to evacuate); UC—Untenable conditions (the point when fire components, such as smoke, heat, toxic gases, narcotic gases, and irritant gases, kill the occupants). The pre-movement time is also known as pre-evacuation time.
On the basis of the aforementioned information, a TET scheme was created in this study, which was further classified into three parts: (1) the time from IG to occupants coming to the decision of evacuation (tp); (2) the time from the occupants’ initiation of evacuation to their arrival at evacuation exits (tm); and (3) the time the occupants spend waiting at the exits before they safely evacuate from the building (tw). The scheme is shown in Figure 1. The first period of time encompasses the IG, DET, AL, REC, and RESP components. Typically, the time from IG to AL is determined by the fire cause, decorative materials at the fire site, and the maintenance of the fire protection system. In addition, the occupants’ decisions and movements are subject to the influence of their behavioral and psychological characteristics. As mentioned, Day et al. 6 noted that the RT of occupants in the WTC attacks ranged from 0 to 30 min; in other words, substantial variation exists in occupants’ RTs. According to the court records of the case reviewed in this study, the corresponding RT of first-floor occupants (tp1) was set to 80 s and that of second-floor occupants (tp2) was set to 120 and 200 s. Subsequently, the total RT was calculated from these assumptions.

Time periods in the evacuation process.
Formula of regression analysis
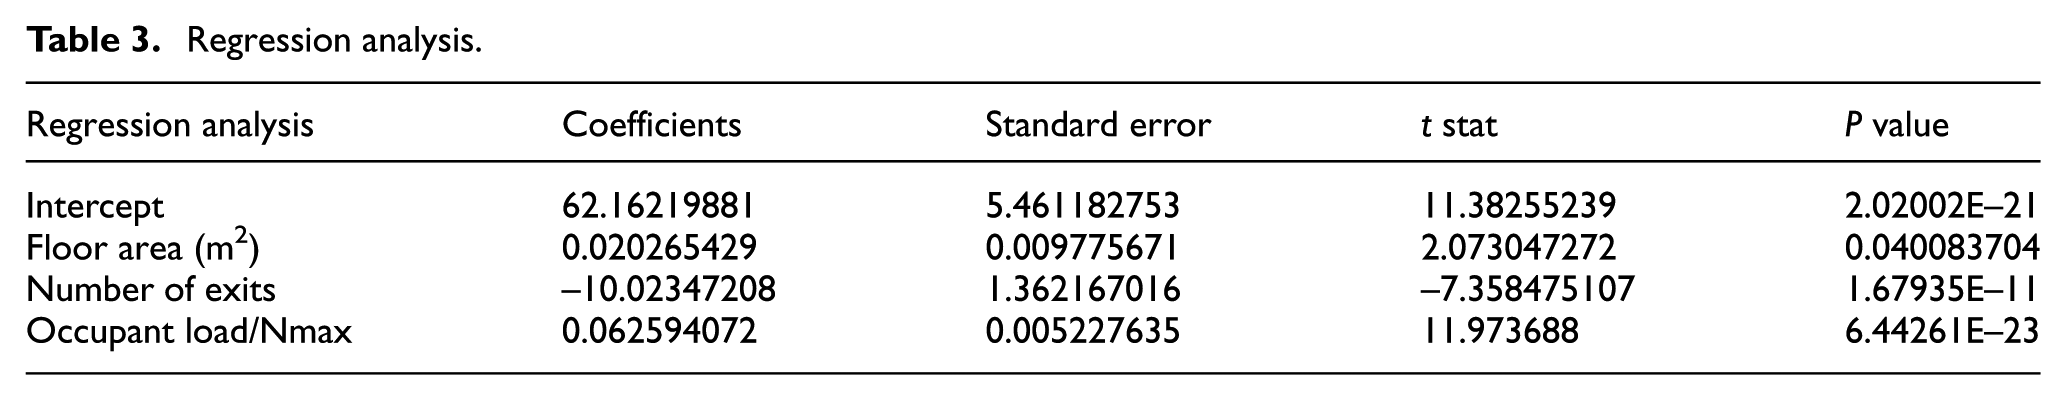
With reference to the experimental and simulation data obtained by Chow, 19 in this study floor area (Fa), number of evacuation exits (Ex), and per-floor occupant load (O load ) were selected as the x variables and the sum of the moving time (tm) and waiting time at the exit (t w ) as the y variables for the regression model. The procedure of creating the regression equation is as follows: (1) insert the data of Chow 19 into an Excel spreadsheet; (2) click on Tools of Data Analysis and select Regression; (3) position the cursor in the text box next to Input Range and use the mouse to select the columns containing the data (ET of Input Y Range. The floor area (Fa), number of evacuation exits (Ex), and per-floor occupant load (Oload) of Input X Range); (4) click OK. Excel will output a table, as shown in Figures 2–4. Equation (1) shows the regression equation for calculating moving time (tm) and waiting time at the exit (tw), called as ET. Subsequently, equations (2) and (3) are used to calculate the TET of the first-floor and second-floor occupants, respectively, according to the sum of their RT (tp1), moving time (tm), and waiting time at the exit (tw). TET refers to the time from IG to the time the last occupant of each floor exits the building. The results of regression analysis show that the adjusted R2 was determined to be 0.679 (Table 1). Furthermore, as revealed in Table 2, the F value obtained through the analysis of variance is 97.97 and the significance value approximates 0, indicating that statistical significance was achieved. The time difference between the sum of moving time and waiting time at the exit is critical when it exceeds 31.26 s and achieves significance. From Table 3, it is seen that all P values obtained in this analysis were <0.05, which indicates that all the independent variables were significant. The coefficient of intercept is 62.16 and is constant. The coefficient of floor area (Fa) is 0.020265, which means the floor area increasing ET. It has the positive but low impact. The coefficient of number of evacuation exits (Ex) is −10.02347, which means the number of evacuation exits reducing ET. It has the negative but high impact, compared with floor area and occupant load. The coefficient of per-floor occupant load (Oload) is 0.062594, which means the occupant load increasing ET. It has the positive but low impact. Therefore, the proposed regression model can be used to effectively estimate ET. The regression analysis data compared with Chow’s experimental data, 19 it can be seen that the difference between 31% and 40% are 19 items; the difference between 21% and 30% are 30 items; the difference between 11% and 20% are 28 items; the difference between 0% and 10% are 41 items, as shown in Figure 5. The 99 items could be within 30%, 118 items of total, so the accuracy could be accepted


Steps 1 and 2 of the regression procedure.

Steps 3 and 4 of the regression procedure.

Output of the regression procedure.
Regression statistics.

ANOVA results.

ANOVA: analysis of variance.
Regression analysis.

ET comparisons.
Experimental process
The experimental process involved testing an evaluation design model that comprised three modules: input, evaluation, and output. Input consisted of fire code, the simulation assessment model, the safety assessment model, and the evacuation assessment model. Evaluation was composed of the fire dynamic simulator and data analysis. Finally, the output comprised egress time, compliance, validation, and suggestions for improvement. The evacuation assessment model involved regression analysis, the results of which could be compared and verified using computer simulations (Figure 6). Combining the verification results with practical experience facilitated the calculation of ET and the development of a TET estimation equation.

Evacuation design model.
Case study and simulation plan
In this study, successful TET referred to the time required for occupants to move from the evacuated locations to a safe area, that is, the time for occupants in potentially dangerous locations to evacuate safely before being affected by the disaster. This study examined the most severe fire accident in Taiwan’s history. Court records indicate that this accident resulted in 64 deaths and 11 injuries. Within 2 min of the fire starting, seven people were trapped in the kitchen on the first floor and 57 people were trapped on the second floor. However, several guests on the second floor successfully broke the safety glass and escaped by jumping out of the window. This valuable information was used to verify the calculation results of the regression equation.
Case description
The fire occurred in a restaurant. The restaurant’s first-floor business area and the total floor area were 245 and 272 m2, respectively; the second-floor business area and the total floor area were 314 and 381 m2, respectively. Court records revealed several critical characteristics of this case. First, the restaurant used flammable materials to decorate its interior. In addition, the restaurant had established only one official evacuation exit, which was blocked by stoves and other kitchen equipment. Finally, no evacuation exit was established next to the safety glass on the second floor.
The fire began in the kitchen during dinner. Flames underneath a pan grew and spread to the plastic gas hose, which quickly ruptured and led to a substantial gas leak. The leaked gas was then ignited, producing a strong fire flow and burning the flammable decorative materials nearby. Soon after the fire started, restaurant staff directed the guests to evacuate when they realized that the fire was too strong to suppress. However, the only stairway that connected the first and second floors had been completely blocked by the by-then large fire; this obstructed the evacuation path of second-floor occupants. Moreover, the safety glass on the second floor was difficult to break. In the end, the fire injured and killed numerous victims.
Simulation condition
This study adopted the FDS (FDS 6.0 +Evac) as the simulation software. The FDS has been successfully utilized in large-scale fire reconstruction and simulation investigations, nuclear power plant risk assessments, and the training course of the Society of Fire Protection Engineers. In addition, the VTT Technical Research Center of Finland has integrated evacuation modules with the FDS to develop the FDS +Evac software, thereby enabling simultaneous simulation of fire development and occupant evacuation. Simulation results are displayed as animation using Smokeview.
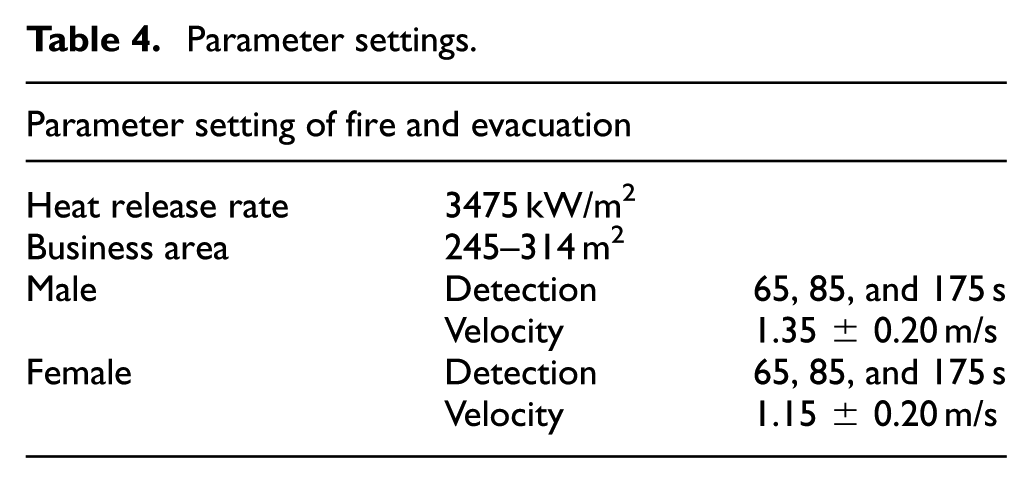
An increasing number of studies related to fire evacuation have adopted the FDS +Evac software to analyze evacuation schemes. In this study, the heat release rate of the fire source was measured at 3475 kW/m2. In addition, the occupants in the studied case included adult men and women, whose walking pace was 1.35 and 1.15 m/s, respectively, and the detection times set in the FDS +Evac were 65, 85, and 175 s (Table 4). According to court data, first-floor occupants began to evacuate approximately 60–120 s after the fire started, whereas second-floor occupants began to evacuate approximately 100 s after the fire began. All statistics, including the regression analysis results and simulation parameters, are verified in section “Limitations and calibration.”
Parameter settings.
Evacuation plan
According to court and news data, more than 100 guests and restaurant staff were dining and working in the restaurant on the evening when the fire accident occurred. The only evacuation exit on the first floor was the main entrance, and no evacuation exit was established on the second floor. Notably, a stairway from the second floor led to the third floor; however, this stairway was hidden behind decorative materials and the guests were unaware of its existence. When the fire started, restaurant staff on the first floor attempted to extinguish the fire without immediately evacuating the guests. First-floor guests continued to have dinner during this time and did not prepare to evacuate. After the staff realized that the fire was too strong that they would be unable to control it, they directed first-floor guests to quickly evacuate. Upon hearing the commotion on the first floor caused by the fire, guests on the second floor rushed to the stairway only to find that the fire had entirely blocked their path to the first floor. Second-floor occupants then attempted to break the tempered glass. Eventually, they were successful and a few people jumped from the second floor to the first floor to escape; all those who did not jump died in the fire.
According to these facts, the parameters of an evacuation plan, as proposed in this study, were set as follows: (1) each floor had a single emergency exit; (2) occupants were divided into those who knew and did not know the location of the emergency exits; (3) occupants were divided into adult men and adult women; (4) per-floor occupant load was assumed to be 50, 100, 150, and 200 people (because there were more than 100 guests in the restaurant, setting the maximum and minimum occupant loads made it easier to identify a successful evacuation scheme); (5) the proportion of men and women on each floor was 1:1; and (6) the detection times set in FDS were 65, 85, and 175 s (Table 5). Figures 7–10 depict the view of the building and interior layout, respectively.
Evacuation plan with an unknown number of exits.


Front view of the building.
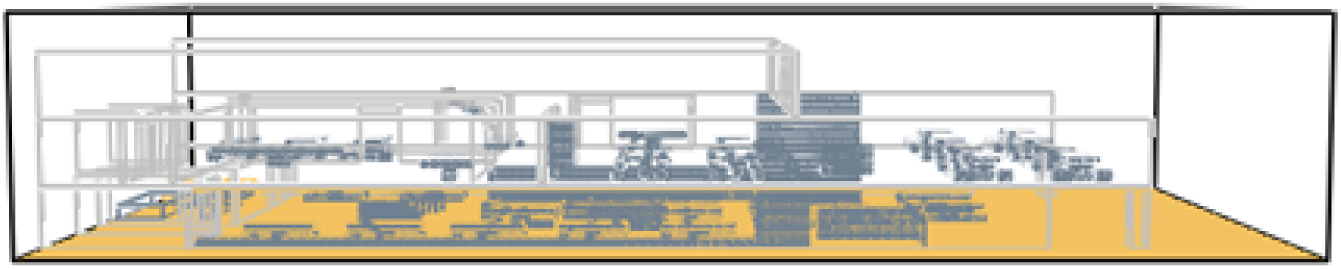
Side view of the building.

1F layout.
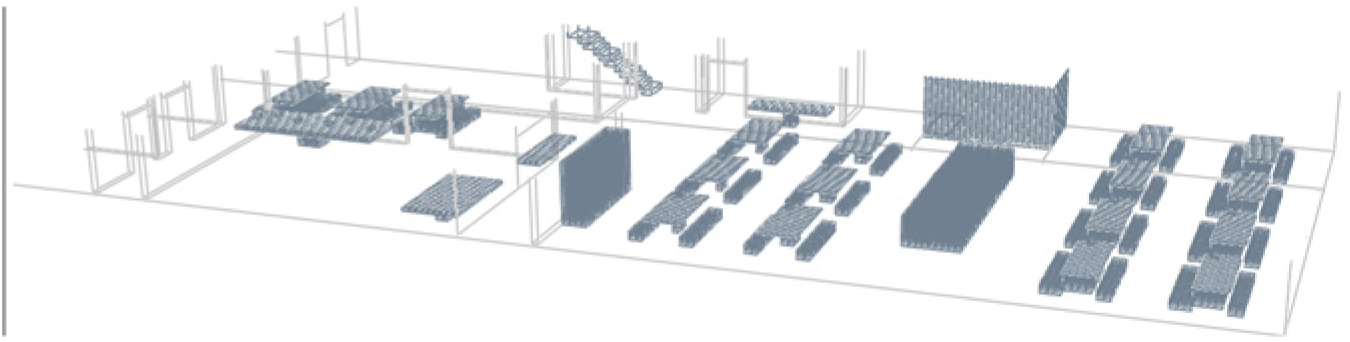
2F layout.
Verification
ET analysis
A fire accident scenario in which the floor area was 245 m2, a single exit existed, and the occupant load varied (i.e. 50, 100, 150, and 200) was adopted. The detection time referred to when people realized that there occurred a fire (in the computer simulation, the detection time spanned from the beginning of the simulation to people’s awareness). When the occupant load ranged from 50 to 150, the regression model yielded an ET of 60.0–66.5 s, whereas the computer simulation derived an ET of 65–66 s. When the occupant load was increased to 200, the regression model yielded an ET of 69.62 s, and the computer simulation calculated the ET as 100 s; therefore, 200 occupants cannot apply in the regression analysis, representing lower accuracy, as shown in Table 6.
Estimated ET and RT results (floor load: 50–150 occupants; floor area: 245 m2).
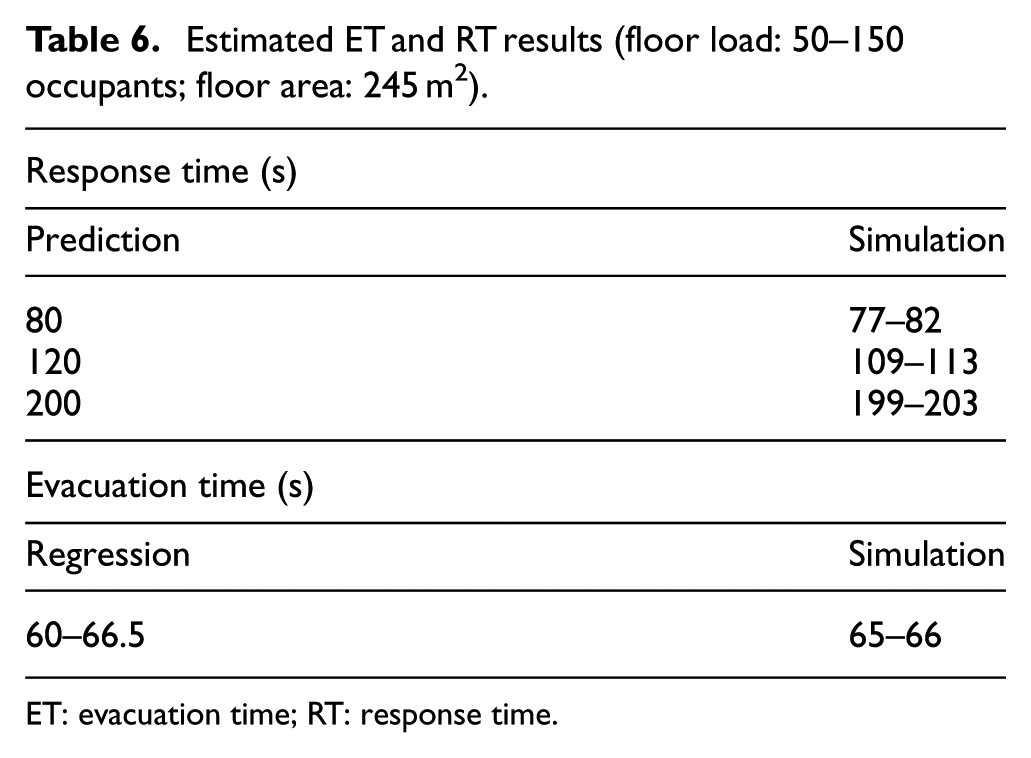
ET: evacuation time; RT: response time.
Next, a fire accident scenario in which the floor area was 314 m2, a single exit existed, and the occupant number varied (50, 100, 150, and 200) was applied. When the occupant load ranged from 50 to 150, the regression model yielded an ET of 61.6–67.9 s, whereas the computer simulation derived an ET of 59–68 s. When the occupant load was increased to 200, the regression model yielded an ET of 70.96 s and the ET calculated from the computer simulation was 102 s; therefore, 200 occupants cannot apply in the regression analysis, representing lower accuracy, as shown in Table 7.
Estimated ET and RT results (floor load: 50–150 occupants; floor area: 314 m2).

ET: evacuation time; RT: response time.
RT analysis
When the occupants were assumed to be unaware of the exit location, with the detection time set at 65 and 80 s of the predicted RT, the computer simulation yielded an RT that ranged from 77 to 82 s. However, when the detection time was set at 85 and 120 s of the predicted RT, the RT of the computer simulation was 109–113 s. When the detection time was set at 175 and 200 s of the predicted RT, the RT of the computer simulation was 199–203 s. These results are summarized in Table 6.
When the occupants were assumed to be aware of the exit location, with the detection time set at 65 and 80 s of the predicted RT, the computer simulation yielded an RT that ranged from 77 to 82 s. However, when the detection time was set at 85 and 120 s of the predicted RT, the RT of the computer simulation was 109–113 s. When the detection time was set at 175 and 200 s of the predicted RT, the computer simulation derived an RT of 199–203 s. An overview of these results is presented in Table 7.
TET analysis
As noted in section “Concepts of ET,” the predicted RT (tp) was set at 80, 120, and 200 s. The floor area was 245 and 314 m2. When the predicted RT was set at 80 and 120 s and ET of regression analysis was set at 60 and 67.9 s, the predicted TET ranged from 140 to 188 s under an occupant load of 50–150. Conversely, the computer simulation showed that the TET was 136–181 s. The time difference was to 4–7 s. The TET calculation will be calibrated in section “Limitations and calibration.” When the occupant load reached 200 or the predicted RT increased to 200 s, the TET verification failed. In this study, safe evacuation is achieved when no occupant death occurs within the predicted TET. The aforementioned results showed that when the detection time was set at 175 s, TET verification failed because the time of the first death among the occupants was smaller than the predicted TET. When the detection time was 85 s and the occupant load exceeded 150, the TET verification also failed.
Regarding the verification of the ET, the time estimated using the regression model ranged from 60 to 67.9 s and that derived from the computer simulation ranged from 59 to 68 s, which again indicates that the simulation and regression analysis results were consistent. For the verification of the RT, the predicted times were 80 and 120 s, whereas the RTs of computer-simulated times were 77–82 s and 109–113 s; this indicates that the predicted and simulated RTs were generally consistent (Tables 6 and 7). Therefore, the estimation of the TET (i.e. RT + ET) is discussed using the computer simulation results.
Limitations and calibration
According to the verification results, the regression analysis in this study exhibited the following limitations:
Floor area: 245–314 m2;
Per-floor occupant load: ≤150 occupants;
RT: 80–120 s.
The TET was defined in section “Formula of regression analysis” as the sum of the RT (tp), moving time (tm), and waiting time at the exit (tw). When the estimated RT was 80–120 s, the RTs obtained from the computer simulation were 77–82 s and 109–113 s; therefore, the estimated RT was corrected to 80–113 s. Moreover, the ET obtained from the regression analysis was 60–67.9 s, including 245 and 314 m2 floor area, and that obtained from the computer simulation was 65–66 s and 59–68 s; therefore, the predicted ET was corrected to 59–68 s. In this study, the earliest and last possible time to leave the fire site was set as the baseline times. In each experiment, the time of the first death among the occupants was compared with the baseline times to ensure that the baseline adequately functioned as a safety line to guarantee the safe evacuation of all occupants from the fire site.
Discussion
The discussion in section “Limitations and calibration” showed that the baseline times for evacuation are calculable. The predicted TET of restaurant occupants in the case study was determined to be 139, 148, 169, and 181 s under various parameter settings. Safe evacuation, as described in sections “When the detection time is 65 s” and “When the detection time is 85 s,” was therefore defined as an evacuation process completed between 139 and 181 s.
When the detection time is 65 s
When the location of the emergency exit was unknown, the TET of computer simulation for the fire site with 50, 100, 150, and 200 occupants was 142, 145, 148, and 182 s, respectively. No occupant died in these four simulations. Similarly, when the location of the emergency exit was known, the TET of computer simulation was 142, 145, 149, and 181 s, respectively; again, no occupant died in these four simulations.
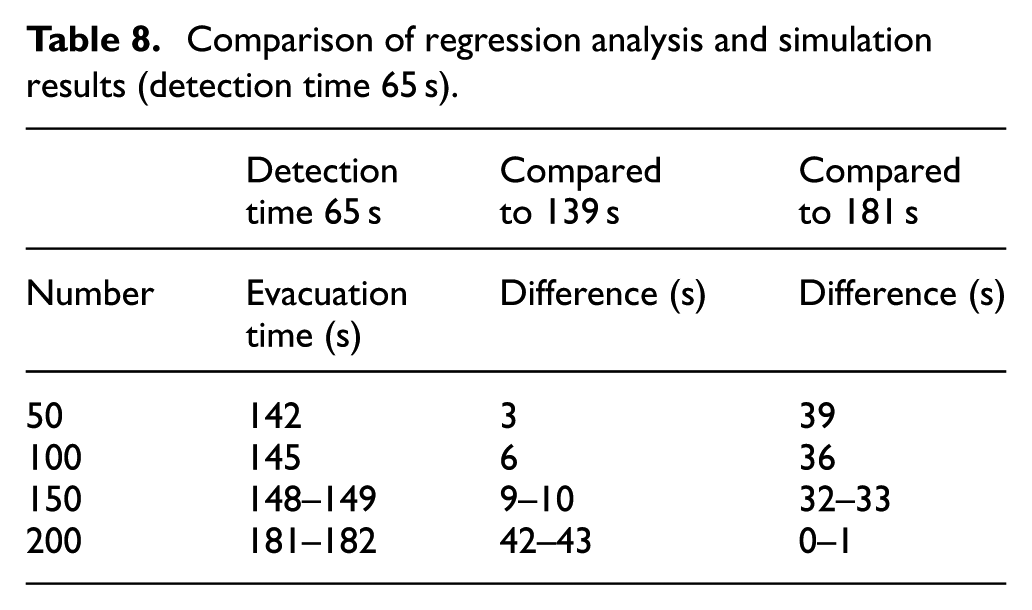
These results indicate that, in an area of 245–314 m2, knowing or not knowing the location of the emergency exit does not affect the TET of computer simulation, because the difference was 1–3 s. The TET of computer simulation was extended when the occupant number exceeded 150. For a fire site with ≤150 occupants, the predicted TET was 139 s after calibrating in section “Limitations and calibration,” the predicted RT was 80 s, and the predicted ET was 59 s. The difference was between 3 and 10 s, 2.1% and 7.1%. When the fire site had >150 occupants, the difference was between 42 and 43 s. The estimated TET was 181 s after calibrating in section “Limitations and calibration,” the estimated RT was 113 s, and the estimated ET was 68 s. The difference was between 0 and 43 s. In summary, under a detection time of 65 s with an occupant load of 0–200 people and the floor area under 314 m2, the TET can be extended to 181 s because no death occurs (Table 8).
Comparison of regression analysis and simulation results (detection time 65 s).
When the detection time is 85 s
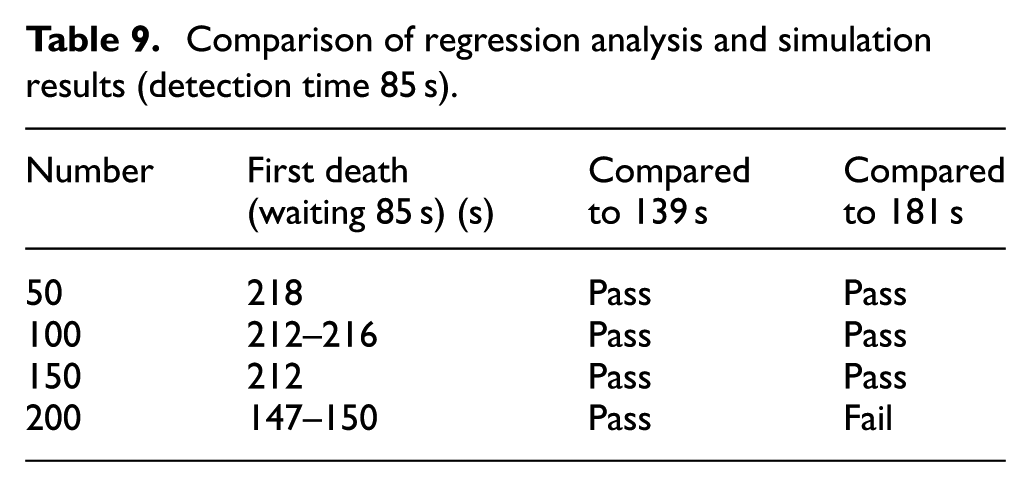
When the location of the emergency exit was unknown at the fire site with 50, 100, 150, and 200 occupants, the first death among the occupants occurred at 218, 216, 212, and 150 s, respectively. Similarly, when the location of the emergency exit was known at the fire site with 50, 100, 150, and 200 occupants, the first death among the occupants occurred at 218, 212, 212, and 147 s, respectively. These results indicate that, in an area of 245–314 m2, knowing or not knowing the location of the emergency exit does not affect the TET of computer simulation or the occurrence time of occupant’s death. However, occupant’s death occurred earlier when the occupant number exceeded 150. On the basis of the discussion in section “When the detection time is 65 s,” every occupant could leave safely when the predicted TET was 181 s and there were ≤150 occupants at the site. When the fire site had >150 occupants, the TET of computer simulation was between 147 and 150 s, but the predicted TET was between 183 and 184 s, 113 s of the predicted RT, and 70 (245 m2) and 71 s (314 m2) of the predicted ET; therefore, under a detection time of 85 s with an occupant load of 50–150 people, the estimated TET is 181 s; however, this is reduced to 139 s of estimated TET when the number of occupants exceeds to 150–200 (Table 9).
Comparison of regression analysis and simulation results (detection time 85 s).
When the detection time is 175 s
When the location of the emergency exit was unknown and the occupant load was 50, 100, 150, and 200, the first death among the occupants occurred at 192, 140, 136, and 152 s, respectively. Similarly, when the location of the emergency exit was known and the occupant load was 50, 100, 150, and 200, the first death among the occupants occurred at 190, 144, 140, and 150 s, respectively. These results again indicate that, in an area of 245–314 m2, knowing or not knowing the location of the emergency exit does not affect the TET of computer simulation or the occurrence time of occupant’s death. However, occupant’s death occurred earlier when the occupant number exceeded 50. On the basis of the discussion in section “When the detection time is 65 s,” every occupant could leave safely when the TET of computer simulation was between 190 and 192 s and there were ≤50 occupants at the site. When the fire site had 51–200 occupants, the TET of computer simulation was between 136 and 152 s. In summary, under a detection time of 175 s with an occupant load of ≤50 people, the estimated TET is 181 s; however, this is reduced to 140 s of the estimated TET when the number of occupants exceeds to 51–200 (Table 10).
Comparison of regression analysis and simulation results (detection time 175 s).

Conclusion and future work
Based on the comparisons of the simulation results and the regression analysis estimations of this case, this study identified the following common parameters for fire sites with floor areas of 245–314 m2:
With ≤65 s detection time and ≤200 occupants on a single floor, the estimated TET (tev) is less than 181 s, the estimated RT (tp) is less than 113 s, and the estimated ET (tm + tw) is less than 68 s.
With ≤85 s detection time and ≤150 occupants on a single floor, the result is the same as that obtained with 65 s detection time. With >150 occupants on a single floor, the estimated TET (tev) is less than 139 s, the estimated RT (tp) is less than 80 s, and the estimated ET (tm + tw) is less than 59 s.
With 175 s detection time and ≤50 occupants on a single floor, the estimated TET (tev) is less than 181 s, the estimated RT (tp) is less than 113 s, and the estimated ET (tm + tw) is less than 68 s. With 51–200 occupants on a single floor, the estimated TET (tev) is less than 139 s, the estimated RT (tp) is less than 80 s, and the estimated ET (tm + tw) is less than 59 s.
These parameters can be applied to fire protection systems. Current programmable logic controllers and industrial computers exhibit excellent calculation and control capacities, which enable the number of occupants on each floor in a building to be transmitted to the fire suppression system through access control, an infrared ray system, or a counting sensor. With this information, protection systems can automatically determine the current RT. In addition, both floor area and number of evacuation exits are fixed parameters. Therefore, when the occupant number on each floor of a building is known, the fire suppression system can calculate various components of the ET to obtain the TET. In cases of a fire accident, the fire suppression system then sends a message to the fire protection broadcasting system, which informs the occupants of the remaining RT and ET to enhance the survival rate. It could also be combined with route mapping inside building, such as Google map. The data can be sent to smartphone and the evacuees can read the data of escape route, RT, and ET by smartphone. Overall, this case verified that regression analysis can be effectively employed to estimate the TET from fire accidents. Applications of regression analysis in ET calculations warrant further research in the field of evacuation science.
Footnotes
Acknowledgements
We thank the Judicial Yuan Taiwan and related units for providing information that helped us successfully complete this paper.
Handling Editor: Yi Wang
Declaration of conflicting interests
The author(s) declared no potential conflicts of interest with respect to the research, authorship, and/or publication of this article.
Funding
The author(s) received no financial support for the research, authorship, and/or publication of this article.