
Abstract
Circular crossbore as a common geometric construction exists widely in the engineering components. Its fatigue life is heavily decreased by the crack failure around the intersecting line. So, the typical analysis model of crossbores with mode I crack is built, and the influence of four main parameters, such as thickness–diameter ratio Y, crossbores diameter ratio Q, crack length a, and axis ratio of elliptical crack face b/a, on fracture parameter KI is presented. The results show that the distribution of KI is mainly influenced by Q and b/a, and the influence of b/a is more obvious. The value of KI is mainly influenced by Y, Q, and a, while the influence of b/a is not evident. For elliptical crack face, the KImax (maximum value of KI) located at the short axis leads to higher crack growth rate. KImax is a crucial factor of fracture criterion, and the significance of factors on it is also analyzed here. A variance analysis of four factors is performed and their order is Y > Q > a > b/a. In addition, a calculation function of KImax is built based on 294 sets’ data and the error is analyzed by mean absolute percentage error with maximum error being less than 7.2%.
Introduction
Circular crossbore as a common geometric construction exists widely in the engineering components such as pipe connections, valves, and fluid ends of piston pump; 1 the maximum circumferential stress of which around the bore intersections can reach to 10 times that of the thick cylindrical vessel. Under the cyclic loads, crack failures usually appear at the intersecting line and consequently decrease the fatigue life of components.2–5
However, at present, most researches about the crossbores focus on the stress distribution and stress concentration factors (SCFs) without considering the influence of crack. Date back to 1979, the researches on SCF of circular crossbores and elliptic crossbores have been performed by Faupel and Harris. 6 The plate theory is applied to calculate the SCF of crossbores with the assumption that the stress distribution of cylindrical hole is similar to the plate when the side hole is very small. In the end, an approximate method is obtained to calculate the SCF of crossbores with small side hole. The SCFs of circular crossbores and elliptic crossbores were calculated, and the results show that the elliptic crossbores have lower SCF. The similar researches on elliptic crossbores have also been done by Badr. 7 In his study, a 1/8 symmetry finite element model was built to calculate the SCF. The results show that the maximum tensile stress appears at the middle point of intersecting line. In addition, he took a further step to find the influence of thickness–diameter ratio and crossbores ratio on the maximum SCF and provided a fitting equation to calculate the SCF. For the circular crossbore, similar results are obtained by Sorem et al. 2 and Watanabe et al. 8 Sorem et al. focus on the maximum stress, while Watanabe et al. on the SCF. Both of them concluded that the maximum value locates at the middle point. In the ASME Section VIII, Division 3, a calculation method of SCF was provided for the circular crossbore as well. But it is appropriate only when the side holes are perpendicular to the axis of the main hole, when their axes intersect and the side hole is far away from the ends of cylinder or blocks. 1 In the research of Ahmed Nabhan, 9 the holes, which are considered as a stress raiser, are established in the internal surface and external surface. The effects of the hole depth, which varied between 0.5 and 4.5 mm, and the hole diameter, which varied between 1 and 2.5 mm, on the generated stresses are presented, and also, the effect of the SCF is presented. The results show that the presence of holes on the cylinder surfaces tends to increase the circumferential stress. Furthermore, the circumferential stress increases with the increase in the hole diameter and depth. The stress concentrated at the hole root.
From the above literature review, it can be observed that the majority of researches on crossbores are limited to the stress distribution of crossbores without crack. And it is clear that the high stress area of crossbores is around the intersecting line. If the component is exposed to continuous load, the stress concentration in a localized zone may not produce detrimental effects. Once the situations such as cyclic load, low temperature, and corrosion environment are introduced, the high stress area is easily turned into the failure area because of the crack propagation.
Once the crack appeared, the conception of stress is no longer applicable because of the stress singularity at the crack tip. Stress intensity factor (SIF) as a key conception of linear elastic fracture mechanics is proposed to describe the stress field of crack tip.10,11 Usually, numerical analysis is taken into account for the assessments of SIF in pressure vessels, but most of which are about cylindrical. To name a few, the analysis on interactions between surface cracks and an embedded elliptical crack in a pressurized cylinder is carried out by Chai and Zhang. 12 In the research of Livieri et al., 13 a closed-form expression of the SIF for embedded elliptical cracks in cylindrical and spherical pressure vessels with inner pressure is presented. Qian14,15 estimated the stress field of an embedded flaws in pipe by two parameters KI-T. In his research, T means the T-stress, which is the second term in the classical Williams’ solution 16 for the crack-tip stress field. Although these and other studies provide insights into the SIF calculation of pressurized cylinders, whether the pipes are thick or thin, unfortunately the researches on crack problems of crossbores are scarce. If a proper fatigue life prediction of crossbores is to be solved, then the calculation of SIF included in this article is necessary. The author have calculated the SIF of crack at the intersecting line of fracturing pumphead, and the results show that the mode-I fracture is the main failure for the crossbore structure. 3 Therefore, the research in this article is mainly on the mode-I crack.
The outline of this article is as follows. In section “Analysis model,” the analysis model is built, and the value ranges of parameters are presented. Then, a brief description of KI and nominal stress σ0 (as detailed in the next sections) is presented in section “Distribution of SIF (KI) along the crack.” The main results of this work are presented in section “Influences of parameters on KI,” where the influences of different parameters on KI and σ0 are performed and discussed. The trends of KI and σ0 are compared, showing that the redefinition of nominal stress provides a better description of the KI. Considering the importance of KImax in the prediction on fatigue life, an analysis on KImax is conducted in section “Calculation of KImax.” In the end, some conclusions are summarized in section “Conclusion.”
Analysis model
Model parameters
Parameters of crossbore
As shown in Figure 1, an example of the intersection of two bores in a rectangular block is presented. The dimensions are defined by five parameters: W1 × W1 × W2, D1, D2. Referring the definition of crossbore in ASME, the four crucial conceptions are defined as follows:
Main hole: Hole with bigger diameter, D1;
Side hole: Hole with smaller diameter, D2;
Thickness–diameter ratio Y: Ratio of main hole diameter D1 to W1, Y = W1/D1;
Crossbore diameter ratio Q: Ratio of side hole diameter D2 to main hole diameter D1, Q = D2/D1.

Crossbore structure.
Due to the symmetry of structure and loads, the 1/8 symmetric model is built, as shown in Figure 2. Based on the existing results on crossbores, crack is most likely to appear around the middle point of intersecting line, where the crack face is built.
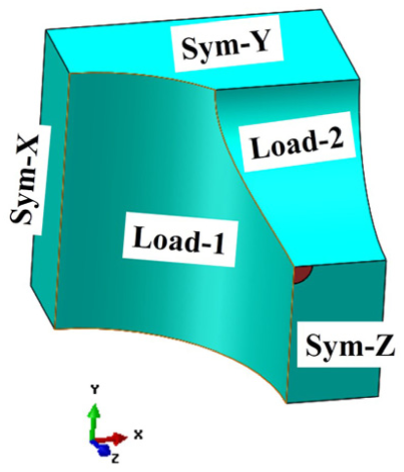
Boundary conditions.
Parameters of crack face
In general, elliptical cracks are considered as recharacterization of actual cracks.13,17 So, the elliptical crack is built in this study. The crack face locates in the radial–longitudinal plane with center at the middle point. A sectional view of the crossbores is shown in Figure 3(a), and the blue ellipse is where the crack face locates. In this case, four parameters are introduced to describe the characteristics of crack face, which are Tw, a, b, and μ. Their concrete definitions are as follows:
Tw: Effective thickness, the thickness of main hole, Tw = W1(Y −1)/2Y, mm;
a: Long-axis length of elliptical crack face, mm;
b: Short-axis length of elliptical crack face, mm;
μ: Ratio of a to Tw, μ = a/Tw. The change of a is realized by altering μ.
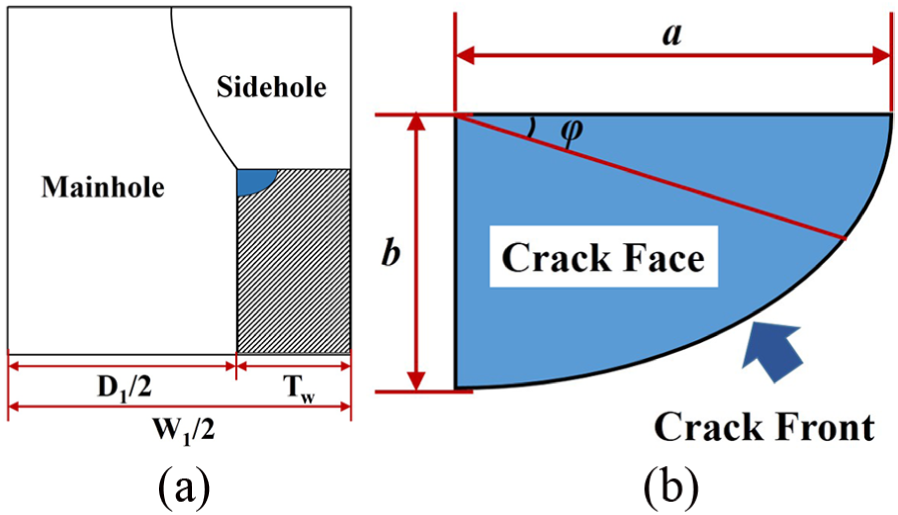
Parameters of crack face: (a) sectional view of crossbores and (b) crack face.
As shown in Figure 3(b), the shape of crack face is described in detail. Where the parameter φ is the angle used to define the location of point in the crack front. When φ = 0°, the point is the intersection of crack front and side hole chamber. When φ = 90°, it is the intersection of crack front and main hole chamber. So, when φ ranges from 0° to 90°, every point in the crack front can be described.
Main parameters and values
Combining the parameters of crossbores and crack face, the default values and value ranges of parameters are determined and shown in Table 1.
Meaning and values of main parameters.

Boundary conditions
Based on the parameters shown in Table 1, the model is built as shown in Figure 2. The three symmetrical faces are Sym-X, Sym-Y, and Sym-Z, on which the symmetrical loads are exposed. The inner surfaces of main hole and side hole are exposed to uniform pressure p. The specific descriptions of loads and boundary conditions are detailed in Table 2.
Main loads and boundary conditions.

U1, U2, and U3 represent the movement in X, Y, and Z directions, respectively; UR1, UR2, and UR3 represent the rotation on X, Y, and Z axes, respectively.
When calculating SIF by finite element method, one-fourth node element is always adopted to solve the stress singularity at the crack tip. Meanwhile, the hexahedron elements are added outside to improve the calculation accuracy.18,19 The finite element model of crossbores with a crack at the intersecting line is shown in Figure 4. Specifically, the structure of crossbores is shown in Figure 4(a), and the crossbore model with meshes is shown in Figure 4(b). Figure 4(c) shows the local meshes around the crack tip. Figure 4(d) shows a one-fourth node element of crack tip.

Analysis model of crossbores with crack: (a) crossbores, (b) finite element model, (c) elements around crack tip, and (d) 1/4 node element of crack tip.
Verification of analyzed model and boundary conditions
Before the analysis of SIF, one important step should be carried out to verify the reasonability and reliability of symmetrical model and boundary conditions in this article. At present, analyses on crossbores with crack are scarce to get some effective references. Considering that the analyzed models on crossbores with crack and without crack have the same symmetrical boundaries and loading conditions, the model can be verified by comparing the results of researches on crossbores without crack.
According to the researches of Sorem et al., 2 the maximum tensile stress σp, max, which is normalized by K′ = σp, max/p, is the most crucial factor of crossbore failure. Retaining the other parameters as default values as shown in Table 1, the models with different Q (0.1, 0.3, 0.5, 0.7, 0.9, 1) are built. Comparing the K′ calculated by Sorem (K′(Sorem)) and in this article (K′(FEM)), the results are shown in Table 3.
Verification of model and boundary conditions.

As shown in Table 3, the results based on the model in this article agree well with those of Sorem, and the errors are less than 4%. The comparisons demonstrate that the 1/8 symmetrical model and boundary conditions adopted in this article are reasonable and reliable.
Distribution of SIF (KI) along the crack front
The analyzed models of crossbores with and without crack are built based on the default values of parameters shown in Table 1. The Mises stress distribution is shown in Figure 5.

Mises stress distribution of crossbores with and without crack: (a) Mises stress distribution of crossbores with crack and (b) Mises stress distribution of crossbores without crack.
As shown in Figure 5, stress distribution of the two different models is similar. In both the models, higher stresses are around the two chambers and lower stresses are around the outer walls. The stress concentration caused by the crack is localized and effects in a vicinal area. So, from an overall perspective, the deformation of crossbores can still be considered as being in the elastic stage. In addition, applying the SIF to describe the stress field of crack based on the linear elastic fracture mechanics is reasonable.
As mentioned before, the mode-I crack is the focus of this article; the value of SIF can be expressed as KI. For an elliptical crack, the KI can be expressed as follows 20

where E(k) is the ellipse integral of the second kind and can be expressed as
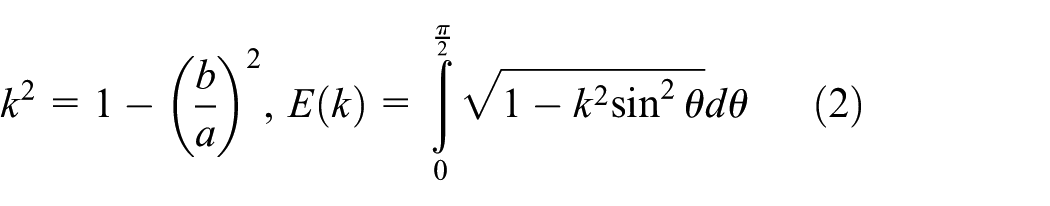
where σ0 is the nominal stress (MPa) and α is the shape coefficient, which is influenced by the geometrical shape, crack shape, and loading conditions. It can be a constant or a function of the above factors. For example, for a plate under ideal loading condition, α = 1. When the shape of crack is circle, namely, b/a = 1, equation (1) can be transformed into

where E(k) is the constant (π/2). Usually, σ0 is regarded as the pressure p acting on the inner surface in the research of pressure vessel. In this case, p is incapable to describe the relationship between σ0 and KI well. 11 For the crossbores, the stress field around the crack tip is also influenced by the stress distribution decided by the structure itself. As Figure 5 shows, the overall stress distributions of crossbores with and without crack are similar with each other. Therefore, the nominal stress σ0 is redefined as the circumferential stress of uncracked crossbores at the same position where the crack located in the cracked crossbores. The KI and redefined σ0 are normalized as follows

So, equation (3) can be transformed into

where α′ is the shape coefficient and has no concrete meaning. As equation (5) shows, Knor and σnor are supposed to have the similar change rules. The crack front (φ = 0°–90°) as shown in Figure 2, starting from the side hole chamber (φ = 0°) and ends at the main hole chamber (φ = 90°), is divided into 30 similar pieces by 31 points. Calculating and normalizing the SIF (KI) and nominal stress (σ0) of every point along the crack front, the change trends are shown in Figure 6.
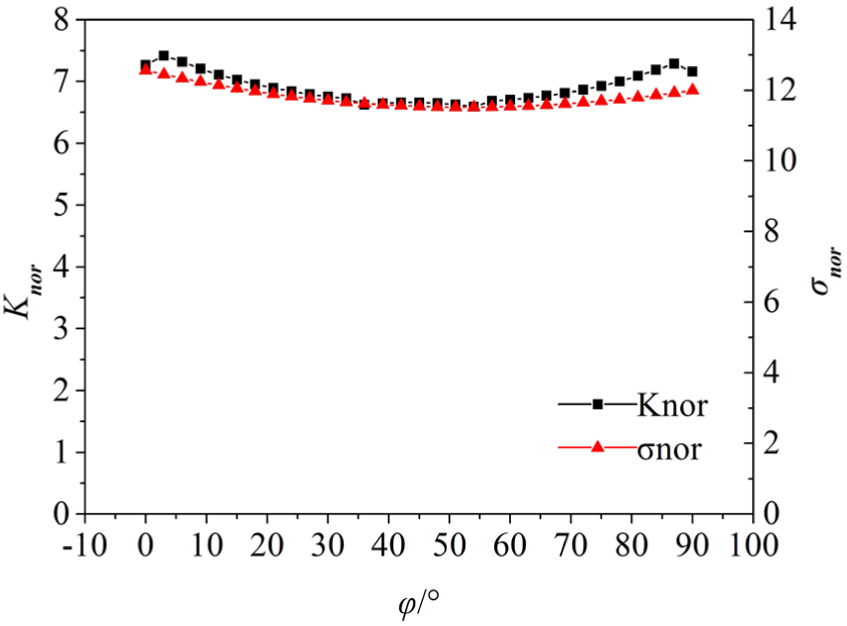
Change trends of KI and σ0 along crack front.
It can be observed from Figure 6 that σ0 and KI have the same trends, which are approximate parabola. Both have the maximum values at the inner surface of two chambers where the pressure is applied directly and the crack is most likely produced. 21 Because of the different diameters of two chambers, the distribution of σ0 and KI is not symmetrical on the point φ = 45°. The maximum values are closer to the side hole. The accordance of σ0 and KI exactly demonstrates the description of equation (5) and shows that the redefinition of nominal stress is more reasonable.
We observe the area, φ = 0°∼2° and φ = 88°∼90°, where very close to the chambers KI appears a turning point. One reason is that the rapid change in curvature of the crack front affects the calculating accuracy of numerical discretization. The other reason that hinders estimations on KI close to the chambers is that the tangential train varies very steeply in this area and the computation of KI through the interaction integral involves a plain strain extraction field. 22 Anyway, as Figure 6 shows, the effect is so localized that reasonably good results can still be obtained when φ ranges from 3° to 87°.
Influences of parameters on KI
In what follows, studies on the influences of parameters (Y, Q, a, and (b/a)) on KI are presented. During the research on influence of one specific parameter, just that parameter varies and all the other parameters remain unchanged.
Influence of Q on KI
Retaining the dimensions of block unchanged W1 = W2 = 120 mm, crack length a = b = 0.1Tw unchanged, thickness–diameter ratio of main hole Y = 1.5 unchanged, just the value of Q is changed. Then, the analysis models with Q valuing 0.1, 0.2, 0.4, 0.6, 0.8, and 1 are built, of which the KI and σ0 are obtained by numerical calculations. Normalizing KI and σ0 through equation (4), the trends are shown in Figure 7.

Influences of Q on KI and σ0 when Y = 1.5, a = 0.1Tw, and b/a = 1.
As Figure 7 shows, the increase in Q decreases the wall thickness of side hole and then consequently leads to a significant increase of σ0 and KI. In addition, their growth rate increases with Q as well. Especially, when Q is more than 0.8, even a slight increase in Q will bring a significant increase in KI and dramatically reduce the working life of components. Excepting the magnitude of σ0 and KI, Q also affects the distribution of σ0 and KI along the crack front. When Q ≥ 0.2, the distribution trends of σ0 and KI along the crack front are approximate parabola. When Q < 0.2, the diameter of side hole is far less than that of main hole. In this case, the nominal stress σ0 of side hole is bigger than that of main hole due to the stress concentration of pore. Due to the effect of nominal stress, the minimum value of parabola shifts to the main hole and decreases.
Influence of Y on KI
Y as a crucial parameter affecting the strength of pressure vessels is always a focus of researchers. Similar to the previous section, when a = b = 0.1Tw, Q = 0.6 unchanged and just the value of Y is changed. The KI and σ0 are calculated and normalized when Y is 1.5, 1.75, 2, 2.5, 3.5, and 5. The trends are shown in Figure 8. No matter how the Y changes, the distributions of KI and σ0 are approximate parabola all the time. But the change in Y has great influence on the magnitude of KI and σ0. As the Y decreases, the wall thickness decreases. Under the same pressure, KI and σ0 increase obviously and the crack failure occurs. Meanwhile, as Y decreases, the growth rate of KI increases. Especially, when Y < 1.75, even a slight increase in Y results in a remarkable change in KI. Therefore, in the design of high-pressure vessels with crossbore structure, the value of Y is supposed to be bigger than 1.75 for the purpose of security and reliability.

Influences of Y on KI and σ0 when Q = 0.6, a = 0.1Tw, and b/a = 1.
Influence of a on KI
As shown in equation (3), crack length is a key factor of KI. As crack length a grows, KI increases, and consequently, the failure of components occurs. Retaining Y = 1.5, Q = 0.6, and b/a = 1 unchanged results in the crack length values a = b = 0.05Tw, 0.1Tw, 0.2Tw, 0.3Tw, 0.4Tw, and 0.5Tw. The KI and σ0 of crack front are calculated. Considering that the crack length is no longer the same in this section, the influence of a on KI cannot be obtained if the KI and σ0 are still normalized by equation (4). Hence, a = 1 mm is introduced into equation (4) to normalize the KI and σ0 as follows

when b = a, substituting equation (6) into equation (3), we can obtain

Here,
So, equation (7) can be expressed as follows

It can be inferred from equation (8) that the Knor and

Influences of a on KI and σ0 when Y = 1.5, Q = 0.6, and b/a = 1.
Similar to the factor Y, while a changes, both the distributions of KI and σ0 are approximate parabola. Only the magnitudes of KI and σ0 are influenced by the change of a. It can be observed in Figure 9 that the differences in KI along the crack front are minor when a = 0.05Tw. As a increases, all the values of KI along the crack front increase. But the magnitudes close to two chamber surfaces increase more quickly, which leads to the major differences in KI along the crack front. Hence, at the preliminary stage of crack growth, the crack length is so short that every point in the crack front has the similar crack growth rate. But as the crack length grows, the points close to the chamber surfaces grow faster. Hence, the failures of crossbores more often occurred at the chamber surfaces. As illustrated in Figure 9, KI and σ0 are in accordance with each other when a ≤ 0.3Tw. But as a increases, the differences between KI and σ0 increase as well, especially around the middle point of crack front.
Influence of (b/a) on KI
During the research on influence of Y, Q, and a on KI, the quarter-circle crack face (a = b) is adopted to eliminate the influence of crack shape. However, in practice, the elliptical crack face is the main crack shape appearing in all kinds of components. So, in this context, the influences of elliptical crack face with different (b/a) on KI are considered. Retaining Y = 1.5 and Q = 0.6 unchanged, the long axis of crack face a = 0.3Tw is unchanged. The variation of (b/a) is realized by altering the length of short axis b. The values of KI and σ0 along the crack front are calculated when b/a is 1/4, 1/3, 2/5, 1/2, 2/3, and 1.
Based on the research on influence of Q on KI, it is recognized that the KI of points close to the side hole is bigger. So, we consider that the long axis of elliptical crack face probably locates at the side hole surface. According to equation (1), the KI and σ0 can be normalized as follows

Here,
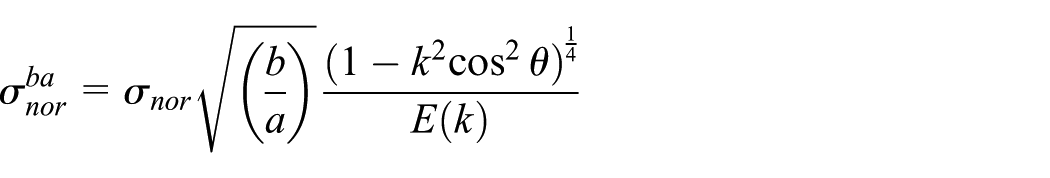
substituting

It can be recognized that the Knor and

Influences of (b/a) on KI and σ0 when Y = 1.5, Q = 0.6, and a = 0.3Tw.
As Figure 10 shows, the trends of Knor and
Calculation of KImax
It is known to us that the fracture failure of a component always begins from the place where the KImax is. Based on the linear elastic facture mechanics, the fracture criteria of a component can be built as follows 23

where KImax is the maximum KI of the crack front and KIc is the fracture toughness obtained by the standard experiment. Once the KImax reaches the KIc, the crack propagates rapidly and consequently leads to the failure of the component. So, the calculation of KImax is important to the evaluation and prediction of fatigue life.
Based on the former research in this article, it can be observed that for a crossbore, the KImax always locates at the two chamber surfaces, where φ is 0° and 90°, respectively. So, the KImax can be expressed as follows

Substituting equation (1) into equation (12), the KImax can be expressed as

where (ασ0)(φ = 0) and (ασ0)(φ = 90) represent the product of shape coefficient and nominal stress, respectively, when φ = 0° and φ = 90°, which can be expressed as σm(φ = 0) and σm(φ = 90).
To clarify the significance of factors on KImax, a scheme of orthogonal test is designed as shown in Table 4, which is transformed from a standard orthogonal table L49(78) by drawing up the level of factors. A variance analysis is performed and the results are shown in Table 5. It is observed that the influence of (b/a) on KImax is not significant, and the significances of structure parameters (Y and Q) are higher than those of crack length, which are in accordance with the single-factor analysis in section “Distribution of SIF (KI) along the crack.”
Scheme of orthogonal test.

Table of variance analysis.

Note: The symbol “**” means the influence of the factor is Highly Significant.
In addition, a data fitting analysis is performed to obtain the calculation of (KI)(φ = 0) and (KI)(φ = 90). The model of KI is suggested to be a function of Y, Q, μ, and (b/a). Given that 49 sets of data in Table 4 are not enough to obtain an accurate model about four factors, more data are needed. As the results show, factor Y has the highest significance on KImax, so the model of KI is fitted for different Y values. For each Y value, an orthogonal table on the other parameters (Q, μ, and (b/a)) including 49 sets of data is designed. In this way, 6 × 49 = 249 sets of data are obtained and used for the data fitting.
Considering that the term E(k) is constant along the crack front and can be calculated by equation (2), the key to determining the value of KImax lies in the calculation of σm. It is supposed to be expressed as

where σΦΦmax is the maximum circumferential stress of crossbore without crack and can be expressed as

where p is the stress acting in the crossbore inner surfaces. The parameters A, B, and C are expressed as

In equation (14), Ta, Tb, Tc, and Td are the function of μ and (b/a), which are expressed as follows

The model coefficients (ai, bi, ci, and di) for each value of the Y when φ = 0° and 90° are listed in Tables 6 and 7, respectively. Substituting the value of σm into equation (13), the KI can be calculated. An error analysis on the predicted values of KI was also conducted. The error estimator used for this analysis is the mean absolute percentage error (MAPE).

Coefficients of models when φ = 0.

MAPE: mean absolute percentage error.
Coefficients of models when φ = 90.

MAPE: mean absolute percentage error.
where KI is the original value and
When the values of KI for φ = 0° and 90° are determined, substituting them into equation (12), the KImax can be obtained.
Conclusion
In this article, the models of crossbores with crack and without crack are built to research the influences of parameters on SIFs KI. In addition, to describe well the relationship between KI and stress distribution of uncracked crossbores, the circumferential stress of uncracked crossbores is defined as the nominal stress σ0. Based on the redefinition, the calculation equation of KI is built. It can describe not only the relationship between KI and crack parameters but also the relationship between KI and stress decided by the structure characteristics of crossbores.
The present results show that the stress distribution of KI is mainly affected by Q and (b/a), especially by (b/a). When b/a = 1, the maximum KI locates at the side hole internal surface, which is decided by the influence of Q. When b/a ≠ 1, the maximum value locates where the short axis of crack face is, which is decided by the influence of (b/a). Namely, for an elliptical crack face, during the propagation process, it probably develops into similar circle shape for the higher growth rate of short axis.
Instead, the magnitude of KI is mainly affected by Y, Q, and a and the influence of (b/a) is unapparent. Moreover, the influences of structure parameters Y and Q are more obvious than those of crack length a. Concretely, the KI is in inverse proportion to Y and is in direct proportion to Q and a. The decrease in Y and the increase in Q and a are inclined to improve the risk of crack failure of components.
An analysis on KImax is performed, and the results show that the structure parameters (Y and Q) have higher influence on the KImax, while the influence of (b/a) is not evident. In addition, a calculation equation of KImax is obtained and the reliability of this model is measured by MAPEs.
Footnotes
Handling Editor: Michal Kuciej
Declaration of conflicting interests
The author(s) declared no potential conflicts of interest with respect to the research, authorship, and/or publication of this article.
Funding
The author(s) disclosed receipt of the following financial support for the research, authorship, and/or publication of this article: The financial support for this work is provided by National Natural Science Foundation of China (No. 51674040), State Key Science and Technology Projects (No.2016ZX05038-001-LH002) and Hubei Province Natural Science Foundation (2016CFC740).