
Abstract
To reduce personnel and equipment risks related to centrifugal pumps in nuclear power plants, safety integrity level for centrifugal pumps must be evaluated. The safety integrity level evaluation methods in the IEC 61508 standard depend on statistical historical failure-dependent data and static threshold. However, for centrifugal pumps in nuclear power plants, the statistical historical failure-dependent data are insufficient, and the static threshold is not easily determined, especially under dynamically changing operation conditions. To overcome the aforementioned problems, this article proposes a safety integrity level evaluation method for centrifugal pumps based on the performance degradation data. This method constructs a Wiener degradation model to describe the degradation process of centrifugal pumps. The degradation trajectories in the upcoming cycles are predicted using a particle filter algorithm. The degradation trajectories with high credibility are selected based on reputation index. The failure time of each selected degradation trajectory is judged using catastrophe theory. The safety integrity levels are defined by performance degradation threshold on demand. Experiments are performed using the simulation data and the component cooling water pump condition-monitoring data set. By comparing to the risk matrix analysis recommended in the IEC 61508 standard, the proposed method is more reasonable and obeys the rule of the bathtub-shaped curve.
Keywords
Introduction
Centrifugal pumps are widely used in nuclear power plants (NPPs). Many of them are located in the nuclear island, which is an irradiation environment. During maintenance operations, maintenance personnel must take necessary radiation precautions to reduce the risk of radiation-related injuries. Maintenance personnel must pay various degrees of attention to minimize risks related to maintenance procedures for centrifugal pumps.
Many factors contribute to the risk incident associated with centrifugal pumps in NPPs. These factors include false alarms in fault detection systems, late remaining useful life (RUL) evaluation results in prognostic systems, unexpected scenarios, and abnormal operating conditions. Prognostic and health management (PHM) 1 focuses on health assessment, fault diagnosis,2,3 RUL estimation, 4 and risk analysis. 5 A formidable challenge in PHM 6 is evaluating the safety level of mechanical equipment. One method for quantifying safety level is safety integrity level (SIL) evaluation. The SIL evaluation of centrifugal pumps attempts to mitigate safety issues facing maintenance personnel and equipment in NPPs.
Standard methods for SIL evaluation7,8 are based on the IEC 61508 standard. 9 These standard methods depend on a static threshold and historical statistical failure-dependent data. The static threshold is fixed from the initial service through many types of maintenance procedures, and it cannot be adapted to different operating conditions. However, the statistical historical failure-dependent data of centrifugal pumps in NPPs are insufficient. The SIL evaluation method in the IEC 61508 standard is not effective for centrifugal pumps in NPPs.
From normal degradation to the failure of centrifugal pumps, this process traverses a sequence of different performance degradation states. The performance degradation process is inextricably linked to the functional safety status. An alternative data-driven method for SIL evaluation is based on the performance degradation data. The degradation trajectory and thresholds are the key points for the data-driven SIL evaluation. The degradation trajectory is intimately associated with fault degradation. 10 This article proposes an adaptive threshold for SIL evaluation. The SIL evaluation threshold is adapted for the different types and operating conditions.
The main contributions of this work are summarized as follows:
This article proposes an SIL evaluation method based on performance degradation data. This method differs from the SIL evaluation methods in the IEC 61508 standard, which is reliant on statistical failure-dependent data.
The SIL is defined by the adaptive threshold performance degradation threshold on demand (PDTD), which can be adjusted to the actual operating situation. The PDTD determination process is discussed in detail. To obtain the PDTD, the reputation index is used for the first time to select the most likely degradation trajectories. Degradation catastrophe theory is used for the first time to determine the catastrophe failure time.
Promising results from verification experiments on simulation data and the component cooling water pump condition-monitoring data set. The experiments demonstrate the effectiveness of the proposed method. By comparing to the risk matrix analysis recommended in the IEC 61508 standard, our method is found to be more reasonable and obeys the rule of the bathtub-shaped curve.
The remainder of this article is organized as follows. In section “Related work,” related work and some problems associated with the SIL evaluation are reviewed. Section “The proposed SIL evaluation method” describes the proposed SIL evaluation method in detail. Section “Experiments” presents the experimental results. Finally, the conclusions are established in section “Conclusion.”
Related work
In this section, we first review some related works on SIL evaluation and then we review some related works associated with the adaptive threshold.
The IEC 61508 standard is well developed for the SIL evaluation of machinery. The main research directions in this field include designing, developing, determining, and verifying a control system.11,12 The SIL evaluation process is a combination of the probability of failure per hour (PFH), the severity of injury, the exposure time to the hazard, the possibility of avoiding the hazard, and the occurrence probability. The SIL evaluation method merges the concepts of fault analysis and failure probability in reliability engineering. The following methods have successfully been used in failure probability analysis: Monte Carlo method, Markov chains, 13 reliability block diagrams,14,15 proportional hazard models, and so on. In the literature, E Piesik et al. 16 considered the sensitivity and uncertainty of probabilistic results for determining and verifying the SIL of control and protection systems. GY Kim et al. 17 proposed a procedure for assessing the hardware safety integrity of a boiler control system using the HAZOP (hazard and operability study). To our knowledge, most SIL evaluation procedures are in accordance with the IEC 61508 standard.
In this study, we attempt to extend the application of the SIL evaluation method for centrifugal pumps in NPPs. However, the SIL evaluation method in the IEC 61508 standard cannot be directly applied to centrifugal pumps for the following reasons:
First, the SIL is defined by the probability of dangerous failure per hour on demand (PDFHD). The PDFHD is a type of static criterion. A static criterion cannot be adjusted to the operating conditions or the rated power.
Second, the failure probability is an important prerequisite for calculating the dangerous failure per hour probability. However, in most cases, the failure-dependent data of centrifugal pumps are insufficient, especially for new products.
To overcome the aforementioned problems, we propose an SIL evaluation method for centrifugal pumps based on the performance degradation data.
The performance degradation process is represented using performance degradation trajectories. Current research on predicting degradation trajectories primarily focuses on data-driven methods. There are three types of data-driven methods 18 for the degradation data analysis: linear regression, degradation path, and stochastic process. The most sophisticated method is the stochastic process. Stochastic degradation processes 19 can provide a flexible way to describe the failure mechanism.
Unfortunately, due to the lack of an accurate performance degradation state prediction, the catastrophic failure time for each stochastic degradation process is highly uncertain. Generally, the probability of catastrophic failure is a function of the performance degradation level and stress. 20 The classical degradation–threshold–shock model proposed by A Lehmann 21 shows great flexibility and can provide the failure time based on the degradation processes when the product operates in a dynamic environment. 22 NC Caballé et al. 23 developed a condition-based maintenance degradation threshold–shock model with multiple degradation processes. Currently, all alternative degradation–shock models require a priori statistical failure information.
Many factors lead the SIL evaluation threshold into a state of uncertainty, including the load, operating environment, maintenance level, safety requirements, and other specific conditions. Thus, we need to propose an adaptive threshold for SIL evaluation according to the actual situation. The adaptive threshold refers to dynamically adjusting the threshold according to the actual situation, providing a reference for accurate evaluation.
To the best of our knowledge, the standard adaptive threshold is determined from the state probability distribution of historical monitoring data. A threshold on demand with an adaptive ability for SIL evaluation has not been studied in the IEC 61508 standard or in other papers.
The proposed SIL evaluation method
The flow chart of the proposed SIL evaluation method based on the performance degradation data is shown in Figure 1.

Flow chart of the proposed SIL evaluation.
The SIL evaluation procedure described in detail as follows:
Raw vibration monitoring data acquisition. According to the ASME OM-S/G-2004, standards and guidelines for the operation and maintenance of NPPs, detailed sensor locations, and measured parameters are recommended for centrifugal pump. The raw vibration data are obtained from the vibration sensors that are located in each bearing housing and pump shaft of the centrifugal pump. The vibration monitoring directions are horizontal, vertical, and axial. The selection of the parameter being measured is velocity, acceleration, or displacement. Raw vibration data are gathered at fixed intervals. The specified interval is every 1 week or 24 h. The vibration monitoring data may be generated from different sensors or by a single sensor equipped with multiple physical sensors.
Extract degradation features. The centrifugal pump will deteriorate over a period of time in normal use. One method for characterizing the degradation status is to generate a degradation trajectory by combining degradation features. The degradation features have good prediction performance that can be extracted from the vibration monitoring data with monitoring cycles from the initial monitoring cycle 1 to the current monitoring cycle tp.
Construct a Wiener degradation model. The Wiener degradation model is used for describing the degradation process of a centrifugal pump. In our case, the sample size of the degradation trajectories is one. All of the Wiener degradation model parameters are estimated using the particle Metropolis–Hastings (PMH) algorithm. We can also use the maximum likelihood estimation (MLE) algorithm to estimate the mean and variance of the degradation rate in the Wiener degradation model. The other unknown model parameters are estimated using the PMH algorithm. The Wiener degradation model and model parameter estimation algorithm will be discussed first in the following section.
All the possible degradation trajectories in the upcoming cycles are predicted using a particle filter algorithm. After obtaining the Wiener degradation model parameters, the sampling importance re-sampling particle filter algorithm (SIR-PF) algorithm is used to predict the degradation trajectories in the upcoming cycles.
Degradation trajectories with high monotonicity and credibility are selected based on reputation index. The second following section will describe the degradation trajectory selection in detail.
Failure times of the selected degradation trajectories are determined. The performance degradation process of centrifugal pump contains catastrophic failure, gradual failure, or the coexistence of both failures. The gradual failure time occurs in the designed functional life value and is easily determined. The catastrophic failure times of the specific degradation trajectories are determined using cusp catastrophe theory. The detailed failure time determination method will be discussed in the third section.
Determination of the PDTD. The PDTD refers to the critical minimum or maximum value of the degradation trajectory parameter.
The SILs are defined by the PDTDs. The relationship between the SILs and PDTDs is defined in Table 1. The proposed PDTD determination process will be discussed in detail in the final section.
Relationship between SILs and PDTDs.

SIL: safety integrity level; PDTD: performance degradation threshold on demand.
The key points of the proposed SIL evaluation method are to obtain the PDTDs and the degradation trajectories X. The goal of this article is to investigate how to obtain them.
In the next section, the degradation trajectory prediction method will be introduced. The Wiener degradation model and the model parameter estimation algorithm will be discussed first.
Degradation trajectory prediction
Brownian motion (BM) 24 with a nonlinear drift is used for modeling the degradation process of a centrifugal pump. Let xt denote the stochastic degradation process and x0 denote the initial degradation value. The performance degradation process is driven by a standard BM B(t), t ≥ 0. The Wiener process 25 with drift is given by the following equation

where Λ(t) is the timescale transformation, given by τ = Λ(t) = tα, Λ(0) = 0, where α is any real number; μ is the degradation rate; and σ is the diffusion coefficient, characterizing the degradation process dynamics and uncertainty, σB(τ) = N(0, σ2τ).
For a discrete time point tk, k = 1, 2, 3, …, the discrete time state equation is described by the following equation

where xk is the performance degradation feature value,

The Wiener degradation state equation (2) will be nonlinear if it does not apply the timescale transformation.
The measurement values are subject to drift, which is caused by the measurement instruments or environmental factors. The discrete measurement values are given by the following equation

where yk is the measurement value,
The equations (2) and (4) have three sources of variability:
Inherent performance degradation xk with time-varying uncertainty;
An uncertain drift term μk;
An uncertain measurement value yk.
Previous research has suggested that the Wiener degradation model parameters should be estimated using the MLE algorithm. 26 However, the estimation accuracy of the model parameters is related to the sample size of the degradation trajectories. In our case, when the sample size of the degradation trajectories is one, the MLE algorithm is not used to estimate all the model parameters. The log-likelihood function of the timescale transformation coefficient α, the diffusion coefficient σ, and the measurement noise variance R are non-convergent when using the MLE algorithm in our case.
We can use the MLE algorithm to estimate the mean μ and variance η of the degradation rate in the Wiener degradation model. The other unknown model parameters are estimated using the PMH algorithm.
27
In addition, all the unknown model parameters can also be estimated using the PMH algorithm, and such a case will be described in the following. The latent performance degradation state xk and
The Wiener degradation state equations (2) and (4) can also be represented using a stochastic description


where

The energy function is considered to obey the following simple recursion

The energy function is evaluated recursively as follows. Start from

where the terms
Then, the PMH algorithm is used for inferring the marginal likelihood of the unknown parameters θ. It is preferable to use the approach in the same class for both model parameter estimation and state prediction. 28
After obtaining the Wiener degradation model parameters, the SIR-PF algorithm 29 is used to predict the degradation trajectories in the upcoming cycles.
The following section describes the degradation trajectory selection and the failure time judgment in detail.
Degradation trajectory selection criteria
Reputation is used to select the highly credible degradation trajectories. The degradation trajectories are denoted by

where the reputation REi is any value in [0, 1] and γ is a reputation parameter, also known as the Dirichlet distribution
31
parameter, γ > 0. At the initial cycle, when there is no prior knowledge or evidence, each degradation trajectory has a reputation of REi = 0.5 from replacing T = 0. With xi,t = 0, the bad degradation trajectory has the final reputation where
After the degradation trajectories with high monotonicity and credibility are selected based on the reputation index, the failure time of each degradation trajectory is judged.
Failure time determination
The performance degradation process of centrifugal pumps contains catastrophic failure, gradual failure, or the coexistence of both failures. The gradual failure time occurs in the designed functional life value and is easily determined. However, the catastrophic failure time determination is not easy. In our method, cusp catastrophe theory is used to judge the catastrophic failure time of each degradation trajectory.
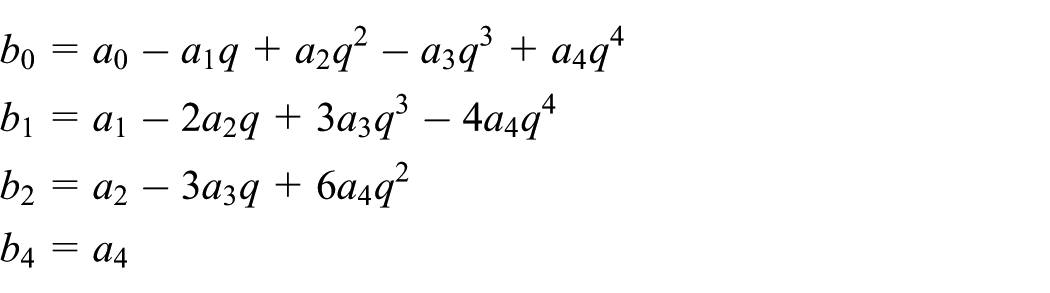
Each of the degradation trajectories can be written in the form of a power series, as given by the following equation

where xi is the degradation trajectory vector, i is the label of the degradation trajectory, t is a variable indicating the cycles, and aij are the fitting parameters, j = 0, 1, …, 4, to be calculated using the least-squares fitting algorithm.
Equation (11) can be transformed into the cusp catastrophe model using the diffeomorphism transformation, which is described as follows. Let

Then, the following equation is obtained

where
Again, let

Then, the potential function is obtained using the following equation
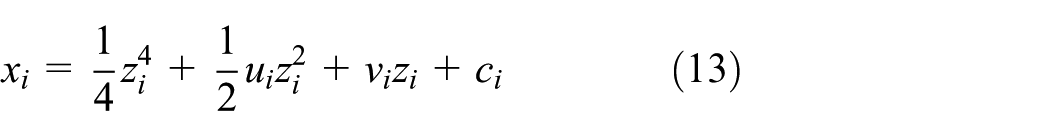
where

where ci is a constant term that can be neglected in the analysis and zi is the coordinate transformation of the cycle t. The cusp catastrophe model has a degradation state variable xi and two control factors ui and vi in three-dimensional phase space. The catastrophe manifold is calculated using the first derivative of the potential function. The calculation is performed using the following equation

The singular set is calculated by the second derivative of the potential function. The calculation is performed using the following equation
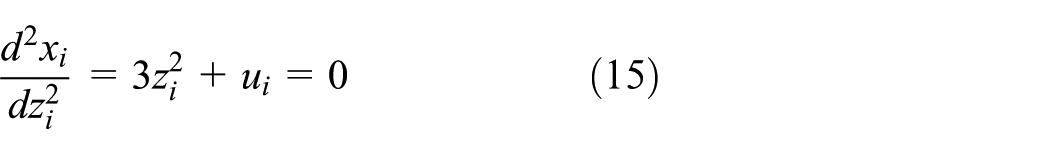
A bifurcation set is used to investigate the catastrophic region of the performance degradation state variable. It is solved using the catastrophe manifold equation (14) and the singular set equation (15) simultaneously. The bifurcation sets are given by the following equation

For each degradation trajectory in the upcoming cycles,
In the next section, the proposed PDTD determination process will be discussed in detail.
Determination of PDTD
The process of determining the PDTD is described as follows: first, the performance degradation values are extracted from historical monitoring data and used to estimate the Wiener degradation model parameters. Based on the Wiener degradation state equation (2), the possible degradation trajectories in the upcoming cycles are predicted using the SIR-PF algorithm. Then, the degradation trajectories above the reputation value are selected, and the catastrophic failure times of the degradation trajectories are determined.
Second, the cumulative probability distribution of the pseudo-threshold sample (PTS) is obtained. Figure 2 shows the relationship between the degradation trajectories and the PTS. In this figure, all possible degradation trajectories in the prediction cycles are indicated by dotted lines. The solid line represents one of the most likely degradation trajectories. The performance degradation feature values at the cross points of the degradation trajectories X and designed functional life threshold Tend are denoted by the PTS. The PTS at cycle Tend is defined as
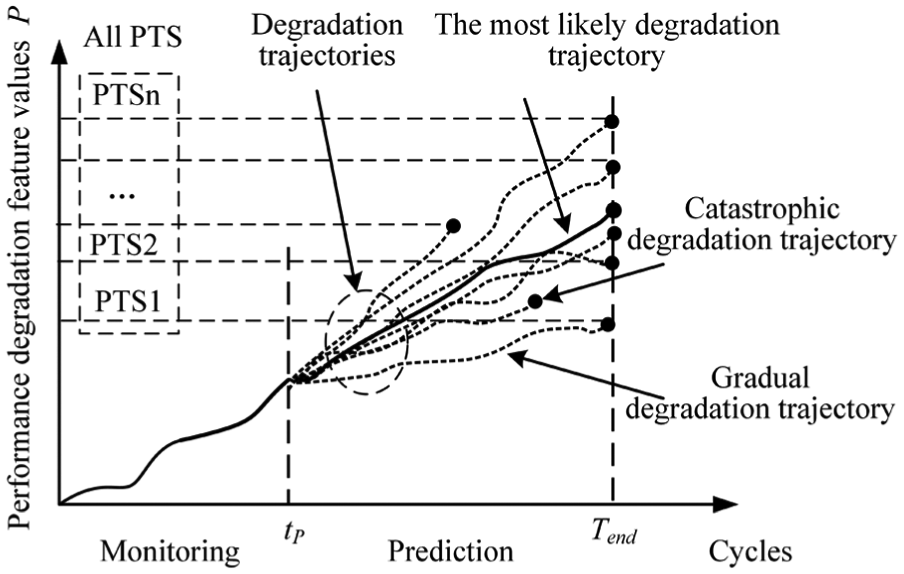
Relationship between degradation trajectories and PTS.
The designed functional life threshold Tend is determined by the number of faults n and design life Td of a centrifugal pump, Tend = Td/n, where n = 1, 2, or 3 is allowed.
One factor of particular concern is the coexistence of both catastrophic failure and gradual failure. For the catastrophic degradation trajectory, the catastrophic failure time is less than the designed functional life threshold Tend. In this situation, the performance degradation feature values at the catastrophic failure time are chosen as the PTS.
Finally, the PDTD is obtained from the percentage of the cumulative probability distribution that the PTS is following. The PDTD is equal to the performance degradation feature value, which corresponds to the probability of failure per hour on demand (PFHD). Figure 3 shows the relationship between PDTDs and PFHDs.
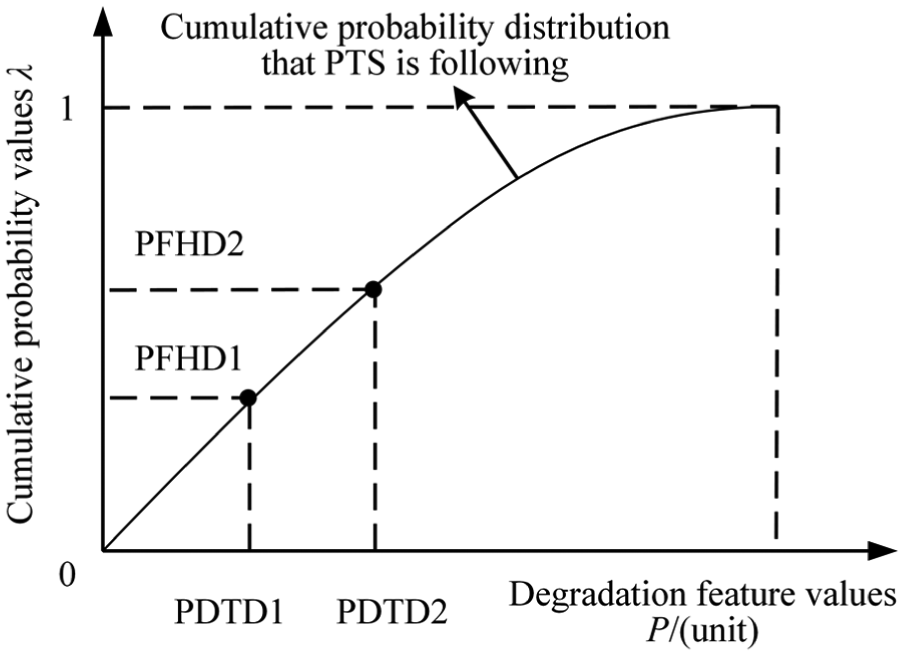
Relationship between PDTDs and PFHDs.
The PFHD is calculated using the following equation

where S is the severity of injury, F is the exposure time to the hazard, and C is the possibility of avoiding the hazard. The PFHD is directly dependent on the risk parameters S, F, and C. The PDFHD is shorthand for the probability of dangerous failure per hour on demand in the IEC 61508 standard.
According to the IEC 61508, the relationship between the SILs and PDFHDs is shown in Table 2, where SIL1 is the lowest and SIL3 is the highest. Note that the probability of dangerous failure per day on demand (PDFDD) (per day) is equal to the PDFHD (per hour) × 24 h.
Relationship between the SILs and PDFHDs in the IEC 61508 standard.

SIL: safety integrity level; PDFHD: probability of dangerous failure per hour on demand; PDFDD: probability of dangerous failure per day on demand.
Experiments that correspond to different data sources and different purposes are described in detail in the next section.
Experiments
In this section, two experiments are performed and the experimental results are presented.
Two aspects must be considered for the SIL evaluation. The first is the failure probability of the centrifugal pump and the second is the risk caused by a failure. It is assumed that the severity of an injury is 1, the exposure time to the hazard is 1, and the possibility of avoiding the hazard is 0. It is important to note that these parameters are determined subjectively.
Simulation experiment
One purpose of the simulation experiment is to verify the model parameter estimation algorithm. Another purpose is to illustrate the feasibility of the PDTD calculation process.
According to the ASME OM-S/G-2004, standards and guidelines for the operation and maintenance of NPPs, the vibration velocity is recommended as the monitoring parameter for centrifugal pumps. As the accepted criteria of the vibration velocity peak value, the alarm threshold is 8 mm/s and the maximum allowable threshold is 17 mm/s. In this experiment, the vibration velocity peak values are simulated. The parameters of the Wiener degradation model are set as follows: the timescale transformation coefficient Λ(t) = tα, α = 1, degradation rate μ ∼ N(0.1, 0.032), diffusion coefficient σ = 0.03, noise variance R = 0.03, and sampling interval △t = tk − tk − 1 = 1. The simulated data include N = 150 data points, and the sample size of the degradation trajectories is m = 1. The first 100 cycles are used to identify the unknown model parameters, and the remaining cycles are predicted.
Figure 4 shows the simulated vibration velocity peak values under different cycles, in units of mm/s. The predicted values are obtained using the Wiener degradation model. The model parameters are estimated using the MLE + PMH algorithm. The MLE + PMH algorithm refers to the case wherein the MLE algorithm is used to estimate the mean μ and variance η of the degradation rate, and the remaining unknown parameters are estimated using the PMH algorithm. This result shows that the Wiener degradation model can effectively describe the degradation process. Table 3 presents a comparison of the degradation model parameter estimation results using different algorithms. The average prediction error using the MLE + PMH algorithm is 0.203 mm/s. This experiment also verified that when the sample size of the degradation trajectories is only one, the log-likelihood function of α, σ, and R in the MLE algorithm is non-convergent. This result shows the effectiveness of the MLE + PMH algorithm.

Curve of simulated performance degradation feature values under different cycles.
Comparison of the degradation model parameter estimation results obtained using various algorithms.

MLE: maximum likelihood estimation; PMH: particle Metropolis–Hastings.
After obtaining the model parameters using the MLE + PMH algorithm, the degradation trajectories in the upcoming cycles are predicted using the SIR-PF algorithm. Some trajectories with a reputation of less than 0.5 are rejected. The catastrophic termination time of the degradation trajectory is determined using degradation catastrophe theory. The corresponding performance degradation values at the termination time are regarded as the PTS.
Figure 5 shows the pseudo-threshold probability density distribution curve for the 100-day cycle. The PDTDs are 8.53 and 11.88 mm/s.

Curve of the failure probability density obtained by the PTS for the 100-day cycle.
Table 4 shows the SILs and their respective PDTDs. After obtaining the Wiener degradation model parameters, the SIR-PF algorithm is used to predict the degradation trajectories in the upcoming cycles. Figure 6 shows the SILs defined by PDTD1 and PDTD2. The figure shows the most likely degradation trajectory after the 100-day cycle and is the mean values of many degradation trajectories predicted using the SIR-PF algorithm. Note that the SIL evaluation effect is not analyzed in the simulation experiment.
SILs and their respective PDTDs for the simulation experiment.

SIL: safety integrity level; PDTD: performance degradation threshold on demand.

Effect of SIL evaluation after the 100-day cycle.
Figure 7 shows the changing curves of the PDTD1 and PDTD2 starting from the 100-day cycle, and they are obtained by gradually increasing the degradation feature point. Both the PDTD1 and PDTD2 fluctuate in a fixed range during the short period of [100, 112] days. The PDTD1 and PDTD2 fluctuate in a wider range after 112 days.

Changing curves of PDTD1 and PDTD2 under different cycles.
Verification experiment of the component cooling water pump
The purpose of this experiment is to verify the feasibility of the PDTD determination process. The same data set is also used to verify the proposed SIL evaluation method, which is described in detail in the next section.
This experiment is performed using data obtained from the component cooling water pump (a type of centrifugal pump) condition-monitoring data set of an NPP in China. The motor has a rated power of 580 kW. The rated rotation speed is 1480 r/min. The vibration is measured using an ENDEVCO 2273AM20 accelerometer. According to ASME OM-S/G-2004, the arrangements of the accelerometers are as follows: horizontal direction H, vertical direction V, and axial direction A of the pump housing. The data provided by the accelerometers are stored every 24 h, and the time span is 1.5 years.
The degradation features are extracted using the standard deviation of an inverse hyperbolic cosine, 32 defined as σ (acosh), which was verified in the IEEE PHM 2012 data challenge. Note that the degradation features in the vertical channel V are highly monotonic compared to the other channels.
The degradation feature values in the vertical channel V are shown in Figure 8. To reduce the variability in the degradation features and filter unwanted noise, a smoothing process is performed to capture important trends. The smoothing operation is considered to be local by the LOESS (locally weighted scatterplot smoothing) filter. 32

Curve of performance degradation features of the component cooling water pump.
Data from the first 160 days are used to identify the Wiener degradation model parameters. Let α = 1, and the estimated model parameters are μ = 0.007, η = 0.098, σ = 0.164, and R = 0.154. The average error between the measured values and the predicted values is 0.59 m/s2. This is a point-by-point prediction. The errors will be very large if it is long-point prediction.
After obtaining the Wiener degradation model parameters, the degradation trajectories of the remaining cycles are predicted using the SIR-PF algorithm. Predicted trajectories that have a reputation of less than 0.5 are rejected.
Figure 9 shows the pseudo-threshold probability density distribution curve for the 160 days. For PFHD1 = 0.024 per day and PFHD2 = 0.24 per day, PDTD1 = 0.767 m/s2 and PDTD2 = 1.568 m/s2, respectively.

Curve of failure probability density obtained by the PTS for the 160-day cycle.
Figure 10 shows the effect of the SIL evaluation. The figure shows the most likely degradation trajectory after the 160-day cycle, which represents the composite of many degradation trajectories predicted using the SIR-PF algorithm. Note that the error in the degradation trajectory prediction using the SIR-PF algorithm is significant in contrast to the true degradation feature values in the cycle of [160, 220] days. The Wiener degradation state equation parameter estimation error results from the three sources of uncertainty in equation (2). The sample size of the degradation trajectories is too small. Another reason is the dynamics of the actual situation on longer days.

Effect of SIL evaluation after the 160-day cycle.
The SILs are defined using the PDTDs, as shown in Table 5.
SILs and their respective PDTDs for the component cooling water pump.

SIL: safety integrity level; PDTD: performance degradation threshold on demand.
Figure 11 shows the curves of the PDTD1 and PDTD2. The variation trends of the PDTD1 and PDTD2 monotonically increase with the cycles but increase within a small range in the future weeks. There is a fixed range fluctuating during the short period of [160, 172] days, and a wider range fluctuating is entered after 172 days.

Curves of the PDTD1 and PDTD2 under different cycles.
Comparison of SIL evaluation
The component cooling water pump condition-monitoring data set is used to verify the effectiveness of the PDTD for SIL evaluation. The comparison methods are as follows:
M1: risk matrix analysis recommended in the IEC 61508 standard. A risk matrix is a semi-quantitative assessment tool commonly utilized for risk analysis and evaluation. The risk matrix is also a mapping of probability and consequence to risk. To build the risk matrix, the following steps need to be taken: identification of the different hazards that endanger the equipment, determination of the risk level for each hazard by finding its likelihood of occurrence, and taking into account the hazards consequences. A risk assessment has to be undertaken to determine the SIL, typically, using risk matrices. The risk matrix parameters 9 in the IEC 61508 standard are as follows: the frequency and duration are from 1 day to 2 weeks, Fr = 4; the probability of a hazard event is rarely, Pr = 2; avoidance is possible Av = 3; and the severity is Se = 3. Then, we can obtain the class: CI = Fr + Pr + Av = 9. The SIL assignment class is SIL1 level.
M2: Monte Carlo method. The Monte Carlo method relies on repeated random sampling to obtain degradation trajectory model parameters. For each degeneration trajectory path that meets its predefined threshold, a degradation soft failure is detected. The failure probability is the cumulative probability distribution of the soft failures. First, a general path model (GPM) for only one degradation trajectory is obtained by exponential curve fitting. Second, the GPM model parameters are sampled using a Monte Carlo simulation. In the experiment, the threshold for calculating the failure probability is set to 2. Third, the probability of a dangerous failure is calculated, and the functional SILs are evaluated according to the PDFHDs shown in Table 2.
M3: the proposed method in this article. Data from the first 160 days are available. Assume that designed functional life threshold Tend of the component cooling water pump is 300 days. The goal is to evaluate the SILs of the component cooling water pump after 160 days.
The comparison of the SIL evaluation results is shown in Table 6. Note that it is meaningless to evaluate the SIL before 160 days.
SIL evaluation results with different methods in the 160-day cycle (units of days).

SIL: safety integrity level.
The bathtub curve is typically used to illustrate the three key periods of centrifugal pump failure. The bathtub curve consists of three periods: an infant mortality period, a relatively constant failure period, and finally a notable growth in the later wear period. The infant mortality period occurs in the early operation period. Because of unknown material defect, manufacturing defects, or other reasons, the failure rate is very high at the beginning and then gradually decreases to a steady state. However, the only information available is past failure times of similar components used under similar conditions. Due to the failure-dependent data of component cooling water pump is insufficient, the SIL evaluation method based on performance degradation data is invalid in the early operation period.
In the constant failure period, as the component cooling water pump operates, it begins to degrade and consume its available life. This life consumption may be a function of system stresses, and the failure distribution should be updated to account for the system’s operational stress levels. The failure rate is caused by unexpected overloads, and so on. The SIL is at a moderate level.
In the later wear period, the degradation of the component cooling water pump becomes apparent. This may be caused by fatigue, abrasion, radiation, and so on. The failure rate increases rapidly. If it continues to operate, the increasing maintenance scope, times, or frequency can create significant danger to maintenance personnel. The SIL is at the lowest level.
In our method, two aspects must be considered for the SIL evaluation. The first is the failure probability and the second is the risk caused by a failure. If we suppose that the danger caused by a failure is known, the desired SILs’ evaluation result should obey a bathtub-shaped curve.
As shown in Figure 12, the curve change trends of the SIL based on the M2 and M3 present a bathtub-shaped curve. It is rare to have sufficient short-term or long-term failure data to obtain a calibrated bathtub curve. In the later periods [209, 300] days, the result is SIL1, which is the lowest level. This result corresponds to the failure probability rapidly increasing. The M2 has a shortcoming in that the selected threshold for calculating the failure probability is uncertain because of the expert assessment subjectivity. The M3 is more reasonable than the other methods.

SIL evaluation results and the possible failure bathtub curve. Note that the cycles from 0 to 160 days are the past. It is meaningless to evaluate the SIL before 160 days.
Parameter analysis
In our method, the SIL evaluation results are primarily affected by the degradation trajectory and PDTDs. After obtaining the Wiener degradation model parameters, the SIR-PF algorithm is used to predict the degradation trajectories in the upcoming cycles. The SIR-PF algorithm implementation relies on the Wiener degradation state equation (2). In the Wiener degradation state equation (2), the diffusion coefficient σ and degradation rate μk are uncertain. This uncertainty influences the effects of the SIR-PF algorithm. A detailed study of the Wiener degradation state equation (2) parameter estimation is not the focus of this article. In a real-world trial, the prediction accuracy of the degradation trajectory is restricted in terms of the hidden degradation information of the centrifugal pump.
The threshold PDTD is another important factor in SIL evaluation. The PDTD is primarily affected by selected highly monotonic degradation trajectories and their failure times. The reputation index is used to select the highly monotonic degradation trajectories. Cusp catastrophe theory is used to determine the failure time.
To obtain the desirable PDTDs for more effective SIL evaluation, the reputation parameter γ is the only parameter that needs to be controlled within a range. We must analyze the reputation parameter γ and its influence on the PDTDs.
For the simulation experiment, Figure 13 shows the PDTDs versus the reputation parameter γ for the 100-day cycle. The PDTD1 and PDTD2 are not affected by the reputation parameter γ∈[0, 0.3]. The range γ∈[0, 0.7] is thus usable. When γ∈(0.7, 1], no degradation trajectories satisfy the reputation requirements.

PDTDs versus the reputation parameter in the simulation experiment for the 100-day cycle.
For the experiment on the component cooling water pump, Figure 14 shows the PDTDs versus the reputation parameter γ for the 160-day cycle. The PDTD1 and PDTD2 are not affected by the parameter γ∈[0, 0.5], which is the usable range. When γ∈(0.5, 1], no degradation trajectories satisfy the reputation requirements.
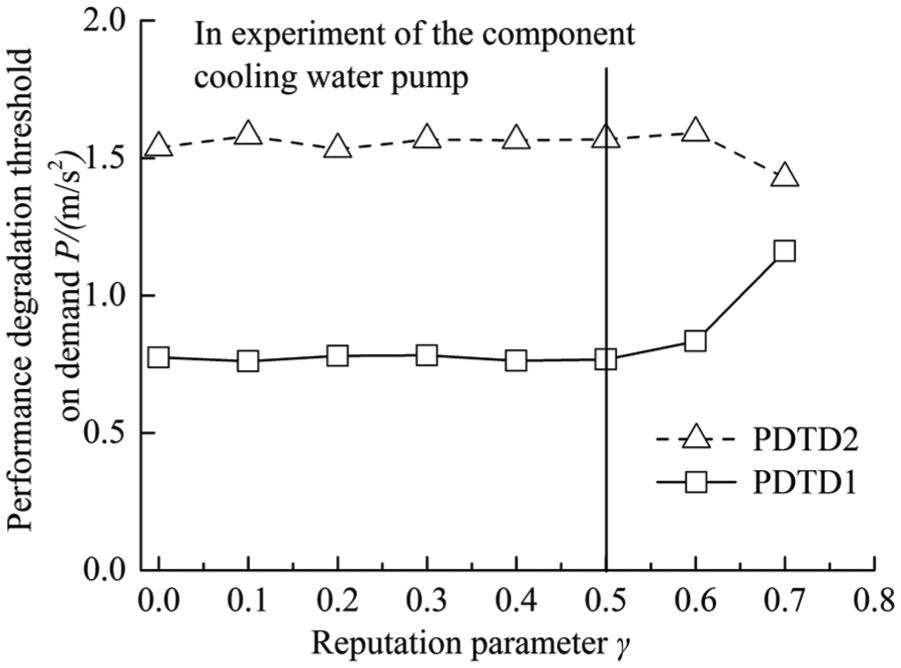
PDTDs versus the reputation parameter in the verification experiment of the component cooling water pump for the 160-day cycle.
Conclusion
Functional safety evaluation is a formidable challenge in PHM. The SIL evaluation methods in the IEC 61508 standard are inappropriate for the centrifugal pumps in NPPs because their historical statistical failure-dependent data are insufficient in most cases. This article proposed an SIL evaluation method based on the performance degradation data. The key features of this method concern obtaining the thresholds and degradation trajectories. This work proposed an adaptive performance degradation threshold, called the PDTD. The SILs are defined by the PDTDs. The Wiener degradation state equation is used to describe the degradation state of the centrifugal pump. The degradation trajectories are predicted by the SIR-PF algorithm for future cycles. After selecting the highly monotonic degradation trajectories and obtaining their catastrophic failure time, the PDTD determination process is described in detail. In our case, the sample size of the degradation trajectories is one. The Wiener degradation model parameters were estimated using the PMH algorithm.
Experiments are performed using the simulation data and the component cooling water pump condition-monitoring data set. The results demonstrate that the proposed PDTD for SIL evaluation is effective. This article also analyzes the range of the reputation parameter, which needs to be less than 0.5. By comparing to the risk matrix analysis recommended in the IEC 61508 standard, our method is found to be more reasonable and produces a result that obeys a bathtub-shaped curve.
Footnotes
Handling Editor: Dong Wang
Declaration of conflicting interests
The author(s) declared no potential conflicts of interest with respect to the research, authorship, and/or publication of this article.
Funding
The author(s) disclosed receipt of the following financial support for the research, authorship, and/or publication of this article: The research work described in this paper was supported by the Natural Science Foundation of China under grant no. 61472216.