
Abstract
This article proposes a pressure control algorithm without a pressure sensor for a four-wheel-drive unit. To develop the control algorithm, dynamic models of the four-wheel-drive unit were obtained, including the motor, pump, and clutch. For feedback control, a first-order adaptive transfer function of the modified motor speed was proposed to fulfill the transient response characteristics, and the motor input voltage generated the demanded pressure at steady state in the feedforward control. The coefficient
Introduction
Recently, interest in four-wheel drive (4WD) has increased as the demand for sports utility vehicles has increased. The number of vehicles equipped with 4WD has been increasing, even in the passenger car market, due to the need to improve tractive performance and safety. When two-wheel drive (2WD) vehicles are driven on icy roads, the maximum traction force of the vehicle is limited due to the small friction coefficient of the road. However, if 2WD is changed to 4WD, the maximum traction force can be increased via torque control in the 4WD unit.
In an electronically controlled 4WD unit, active torque control can be implemented via clamping force control of the clutch plates. To control the clutch clamping force, a DC motor actuator has been used to push the clutch plates directly,1,2 or hydraulic pressure control was implemented using a solenoid valve.3,4 In addition, mechanical pressure feedback was proposed using a piston pump and a centrifugal valve. 5 Hydraulic pressure sensors have generally been used to control the clutch clamping force in electro-hydraulic 4WD units. 6
If the clutch pressure is controlled without a pressure sensor, the additional cost of the pressure sensor can be saved, and the reliability of the 4WD unit can be improved by avoiding potential failure of the pressure sensor. Many studies have focused on pressure prediction without a pressure sensor. These studies employed pressure estimation of the brake piston using the on–off signal of the hydraulic valve7–9 as well as estimation of the pump flow rate and pressure using the pump performance curve.8,10 Pressure was calculated using structured recurrent neural network for a hydraulic actuator system 11 and was estimated using state variables of a frequency converter and pump performance curves for a variable speed drive. 12 However, the pressure offset between the actual pressure and the estimated pressure is a significant drawback. In addition, pressure estimation in the clutch piston in a dual clutch transmission was proposed using a proportional–integral (PI) observer. 13 This observer was also used to estimate the clutch piston pressure in an automatic transmission.14–16 However, a pressure sensor and a pressure control valve were used in these works.
In hydraulic control system, when the temperature increases, the oil viscosity decreases and leakage increases. When the pressure sensor is used, the effect of the oil leakage on the pressure can be compensated by pump speed control. For pressure prediction without a pressure sensor, the effect of temperature should be considered. However, few works have been reported on the pressure estimation by considering the temperature.
In this study, a pressure control algorithm without a pressure sensor is proposed for a 4WD unit considering temperature. For feedforward control, a motor input voltage that can generate the demanded pressure at a steady state was identified. Meanwhile, the feedback control satisfied the pressure response of the transient state. The performance of the pressure control algorithm proposed in this study was evaluated through experiments at various operating temperatures.
Mathematical model of the 4WD unit
Figure 1 shows the hydraulic circuit of the 4WD unit investigated in this study. The 4WD unit is an electro-hydraulic type unit, consisting of a DC motor, an oil pump, and a clutch piston. A bond graph model of the 4WD unit is shown in Figure 2.

Hydraulic circuit of the 4WD unit.

Bond graph model of the 4WD unit.
Motor
A DC motor was used to drive the oil pump. The state equation of the DC motor can be obtained from the bond graph model in Figure 2


where
Pump and hydraulic circuit
A gerotor pump was used in the proposed 4WD hydraulic system. The pump pressure and flow rate were determined based on the mechanical and volumetric efficiency. The mechanical and volumetric efficiency of the pump were obtained from the experiments, and the pump efficiency maps used in this study are shown in Figure 3.

Pump efficiency map for a temperature of 30° C: (a) mechanical efficiency and (b) volumetric efficiency.
The relationship between the motor torque,

where
The relationship between the motor angular speed,

where
The flow equation from the pump to the clutch can be represented as

where
From the bond graph model in Figure 2, the flow equation of the hydraulic circuit is represented as

where
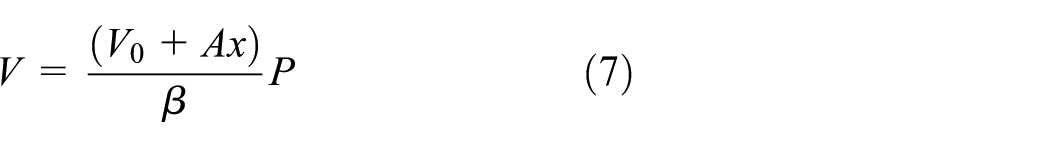
where
Substituting equation (7) into equation (6) gives

Substituting equations (4) and (5) into equation (8) gives
Clutch
The clutch clamping force is initiated when the clutch plates come into contact, and the point where this happens is called the “kissing point.” Before the kissing point, the piston displacement is determined by the piston inertial force, return spring force, and pressure force as follows

After the kissing point, the piston and clutch plate move together, and the reaction force by the clutch plate stiffness needs to be considered as

where
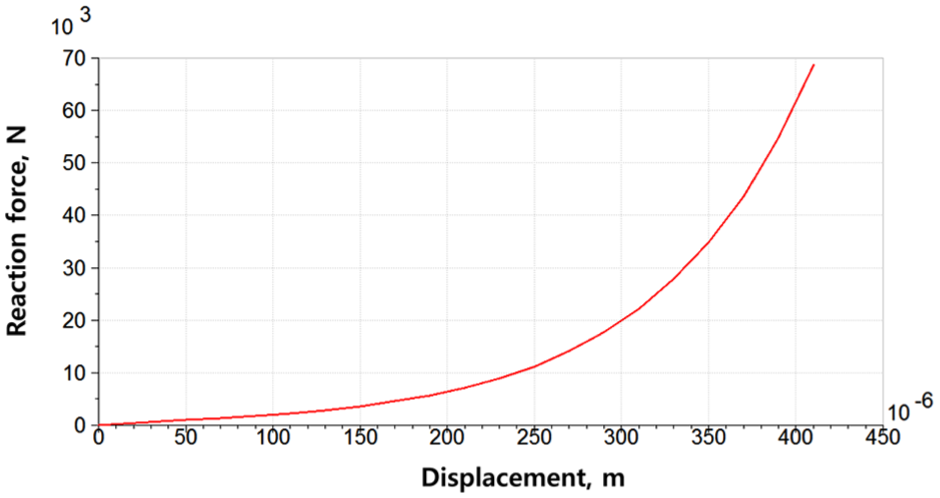
Clutch plate displacement versus reaction force.
Development of a pressure control algorithm without a pressure sensor
The proposed pressure control algorithm without a pressure sensor is composed of feedforward and feedback controls.
Feedforward control
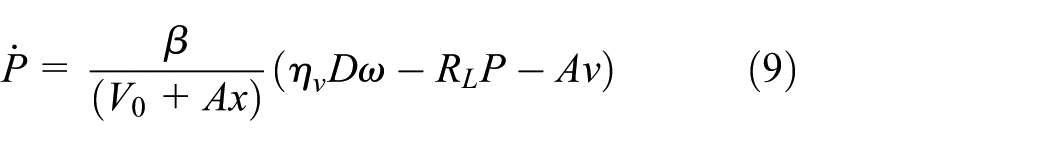
When the clutch pressure is maintained constant at a steady state, equation (9) holds

where subscripts ss and dmd denote the steady state and demanded, respectively. From equation (12), the motor speed,
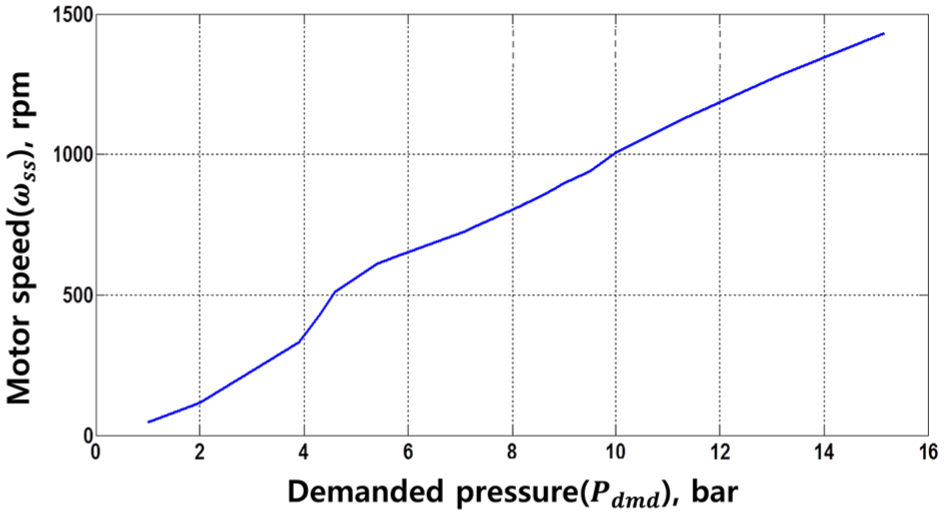
Demanded pressure versus motor speed at steady state.
Feedforward voltage can be calculated from the steady-state equation of the 4WD unit as follows. Neglecting the derivative terms, equation (2) becomes

where
From equation (3), the demanded motor torque to supply the demanded clutch pressure is obtained as
where

From equations (1) and (15), the feedforward voltage can be obtained as follows

where
Performance of the feedforward control was investigated by simulation. For the simulation, a co-simulator that consists of a 4WD unit model was developed using AMESim and a control algorithm based on MATLAB/Simulink. Figure 6 shows the simulation results for a stepwise input of the demanded pressure. The simulation results showed that the actual clutch pressure follows the demanded pressure at a steady state. The clutch pressure begins to increase when the clutch piston reaches the kissing point. In addition, the time to reach the kissing point increases as the demanded pressure decreases, and the rising time to the target pressure becomes faster as the demanded pressure increases. This is because the motor driving voltage (i.e. the motor speed) decreases as the demanded pressure decreases, which requires more time to build up the pressure. From the simulation results in Figure 6, it is apparent that the rising time to the demanded pressure is about 500–600 ms, which is much longer than the design specification of 200 ms.

Feedforward co-simulation results for step input.
Feedback control
Using the feedforward input voltage,
When the clutch plates come into contact, deformation occurs due to the clutch plate stiffness. Since this deformation is very small, the corresponding piston acceleration can be neglected after the clutch plates come into contact. Neglecting the acceleration term in equation (11) gives
Differentiating equation (17) gives the following relationship

From equations (9) and (18), the clutch pressure P can be represented as

A Laplace transformation of equation (19) gives the transfer function for

It is seen from equation (20) that the system pressure is represented as a first-order transfer function of the motor speed. To obtain the pressure, the coefficients
Therefore, in this study, instead of using the exact transfer function of equation (20), we propose a new concept of modified motor speed which can imitate the pressure response characteristics using adaptive transfer function as

where
Experimental results are shown in Figure 7 for the stepwise input of the motor voltage from 1.5 to 5.2 V when the demanded pressure changes from 1 to 14 bar. The motor speed,

Experimental results of the 4WD unit for various
Experimental results are shown in Figure 8 for the stepwise input of the motor voltage from 2.5 to 5.2 V. The target pressure is the same as the previous experiment in Figure 7, but the pressure difference,

Experimental results of the 4WD unit for various
Since
An

3D map of
Similar experiments were performed to construct an
α-map considering the temperature
When the temperature increases, the oil viscosity decreases and leakage increases, which causes a decrease in the volumetric efficiency. In this case, the pump (motor) speed should increase to supply the demanded pressure, and the speed should decrease when the temperature decreases. Since the α map was constructed for the temperature 30° C, the effect of the temperature change on the modified motor speed needs to be considered both in steady state and in a transient state.
Steady state
The
In this study, a motor speed/demanded pressure map was constructed from the experiments using equations (4) and (12) for the temperature range −20° C to 90° C (Figure 10). For instance, when the pressure increased from 1 to 10 bar

Pressure versus motor speed at steady state for temperatures of −20° C, 30° C, 60° C, and 90° C.
To capture the effect of temperature on the motor speed difference,

The weight factor,
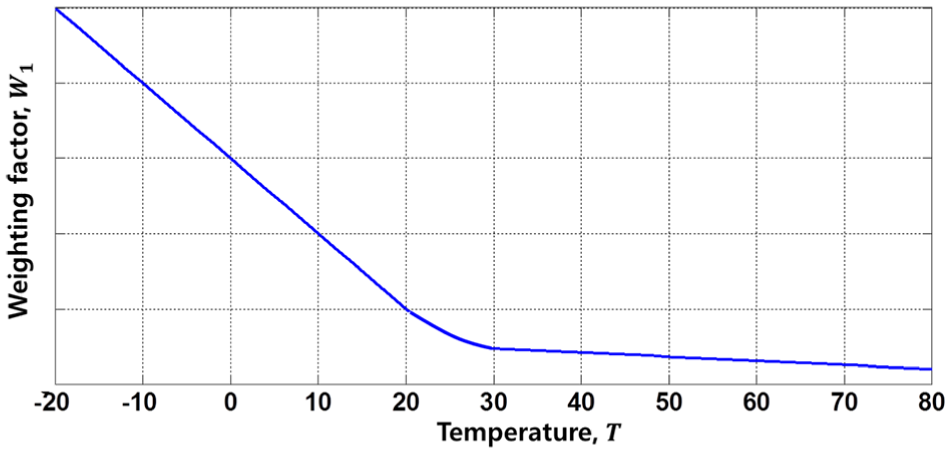
Weight factor,
Transient state
Since the oil viscosity varies depending on the temperature, it affects the transient response of the pressure. To capture this effect, the value of

where
The weight factor
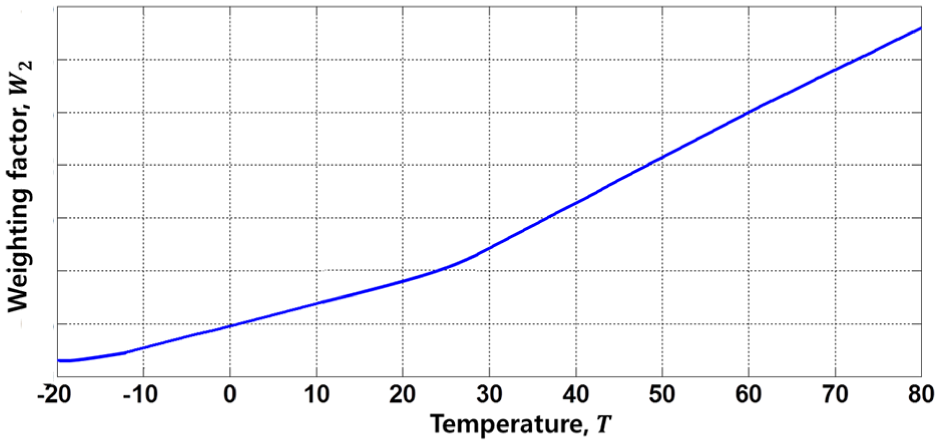
Weight factor,
Block diagram of pressure control without a pressure sensor
Figure 13 shows a block diagram of the pressure control developed in this study. In the feedforward loop, the motor speed required to supply the demanded pressure at steady state is calculated for the given demanded pressure and temperature. In addition, the feedforward voltage

Block diagram of the pressure control algorithm.
In the feedback loop,
Evaluation of the pressure control algorithm using a test bench
Test bench
To evaluate the performance of the pressure control algorithm proposed in this study, experiments were performed for hydraulic oil temperatures of 30° C, 90° C, and −20° C. A test bench is shown in Figure 14. The 4WD unit was installed inside the temperature chamber. The temperature inside the chamber was maintained at the demanded value by the temperature control panel. The motor speed was measured by the encoder.

Test bench.
Evaluation of the pressure control algorithm at 30° C
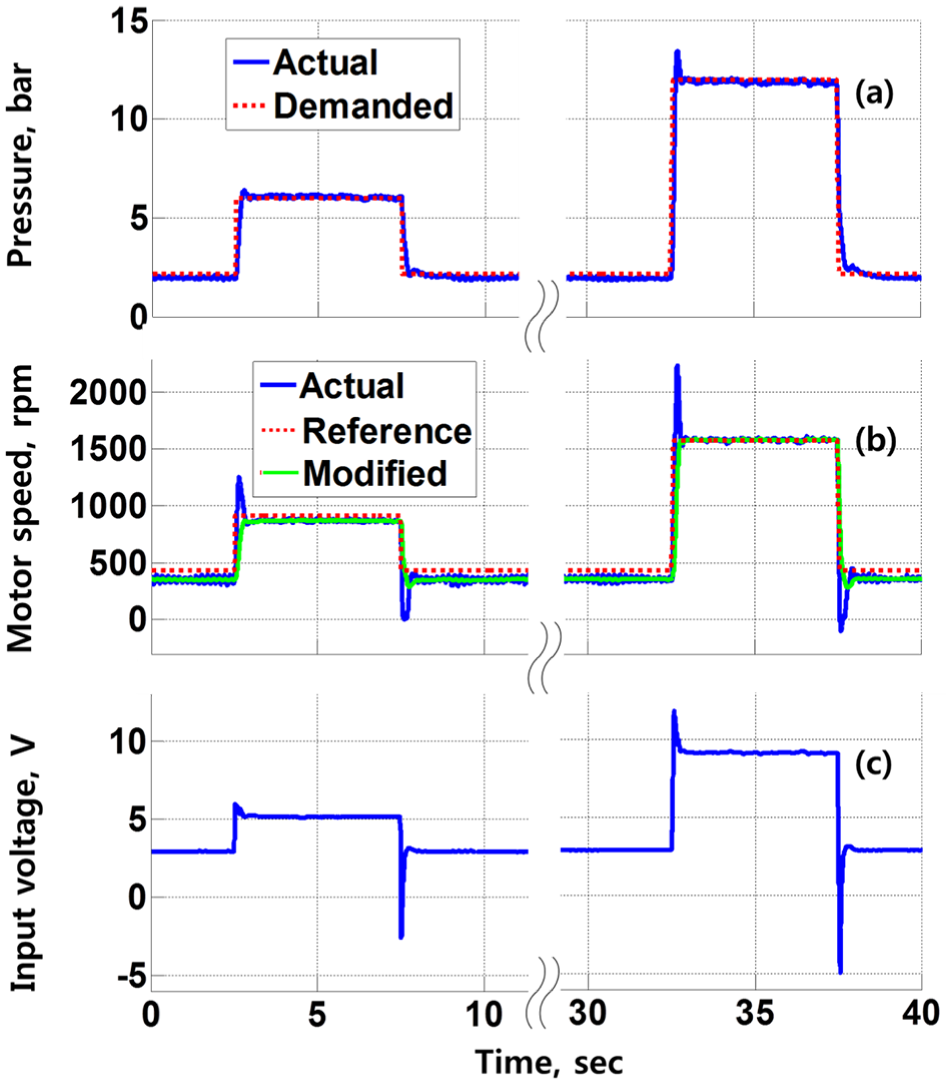
Test results for the stepwise input are shown at a temperature of 30° C in Figure 15. In response to a stepwise change in the demanded pressure, the input voltage (c) showed an overshoot and undershoot before reaching the demanded pressure. The actual motor speed (b) also showed an overshoot and undershoot to supply the hydraulic oil flow required to generate the stepwise pressure. The modified motor speed (b) showed a stepwise shape following the demanded pressure. The actual pressure (a) followed the demanded pressure closely and showed a much smaller overshoot and undershoot compared with the actual motor speed. The average pressure error at a steady state and the rising time were 3.63% and 174 ms for the test in Figure 15, respectively, which are within the design specifications of 5% and 200 ms. The small oscillation of the actual pressure at steady state is due to the fluctuating motor speed. Equation (12) indicates that the pressure response is determined by the oil flow rate, which varies depending on the motor speed and leakage. Since the oil leakage at 30° C is relatively small, the relatively large variation in the motor speed causes a pressure fluctuation.

Performance of the pressure control algorithm for a stepwise input at 30° C.
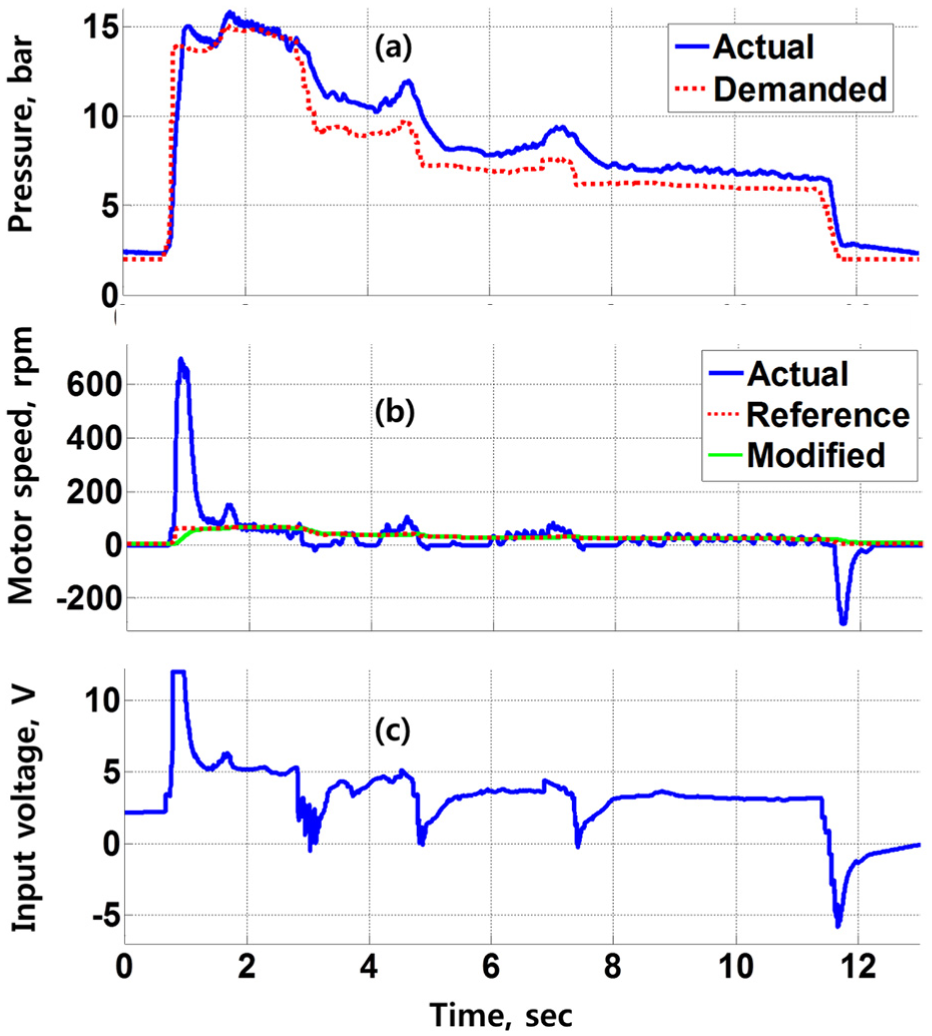
The vehicle launching test results are shown in Figure 16 at a temperature of 30° C. The pressure measured from the vehicle launching test was applied as the demanded pressure. As shown, the actual pressure closely followed the demanded pressure. When the demanded pressure changed in a stepwise manner at the starting point, the actual motor speed and input voltage showed an overshoot before reaching the demanded pressure. It is also noted that the modified motor speed showed a shape similar to the demanded pressure.

Performance of the pressure control algorithm for launching at 30° C.
Evaluation of the pressure control algorithm at 90° C
Test results are shown for a temperature of 90° C in Figure 17. As shown, the actual pressure (a) closely followed the demanded pressure to ensure a stepwise change in the demanded pressure. The input voltage at 90° C is higher than that at 30° C. Accordingly, the actual motor speed was higher than that at 30° C. This is because the leakage in the hydraulic system increased as the volumetric efficiency decreased at high temperature. We also noted that the amplitude of the pressure fluctuation at steady state was reduced compared with that at 30° C since the motor speed variation was reduced at high temperature. The modified motor speed (b) showed a stepwise pressure shape following the demanded pressure. The average pressure error at steady state and the rising time were 2.46% and 159 ms for the test in Figure 17, respectively, which are within the design specifications.
Performance of the pressure control algorithm for a stepwise input at 90° C.
Test results for vehicle launching are shown at a temperature of 90° C in Figure 18. As shown, the actual pressure closely followed the demanded pressure. When the demanded pressure changed in a stepwise manner at the starting point, the actual motor speed and input voltage showed an overshoot before reaching the demanded pressure. The modified motor speed showed a shape similar to the demanded pressure.

Performance of the pressure control algorithm for launching at 90° C.
Evaluation of the pressure control algorithm at −20° C
Test results at a temperature of −20° C are shown in Figure 19. The actual pressure (a) followed the demanded pressure with some differences. As shown, the pressure difference increased as the demanded pressure decreased. We also noted that the motor speed was very small (at about 23 r/min) for the demanded pressure of 6 bar. This is because a small amount of oil flow is enough to generate the demanded pressure since the leakage is very small at extremely low temperatures (equation (12)). The average pressure error at steady state and the rising time were 9.17% and 130 ms, respectively, for the test shown in Figure 19. When the temperature decreased, the oil viscosity increased and the leakage decreased. Therefore, the demanded pressure was generated by a relatively low motor speed, and it is difficult to obtain an accurate pressure since the pressure changes significantly based on small variations in the motor speed (oil flow rate).

Performance of the pressure control algorithm for a stepwise input at −20° C.
The test results for vehicle launching are shown in Figure 20 at a temperature of −20° C. The actual pressure followed the demanded pressure, but there is a relatively large pressure error due to difficulties in pressure control at low speed.
Performance of the pressure control algorithm for launching at −20° C.
From the test results in Figures 15–20, it was found that the pressure control algorithm proposed in this study showed a good tracking performance at normal operating temperatures with an acceptable steady-state error and transient rising time. Compared to the pressure prediction method in the previous works, the pressure control algorithm can predict the actual pressure for a wide range of the operating temperature with an average error of 3.63% at 30° C and 2.46% at 90° C even if the pressure error increased to 9.17% at extremely low temperature. In contrast, few works have been done with detail description on how to consider the effect of temperature.
Conclusion
A pressure control algorithm without a pressure sensor was proposed for a 4WD unit. To develop the control algorithm, dynamic models of the 4WD unit were obtained, including the motor, pump, and clutch. In the pump model, the mechanical and volumetric efficiency were considered.
For feedforward control, the motor input voltage generated the demanded pressure at steady state. To fulfill the transient response characteristics such as pressure rising time, a first-order adaptive transfer function of the modified motor speed was proposed in order to match the response of the motor speed with the response of the pressure, which was implemented for feedback control. Experiments showed that the modified motor speed can closely simulate the transient pressure response. The coefficient
We expect that the pressure control algorithm developed in this study can be used for a 4WD unit without a pressure sensor and can assure a robust system in the case of pressure sensor failure in existing pressure feedback systems.
Footnotes
Handling Editor: Elsa de Sa Caetano
Declaration of conflicting interests
The author(s) declared no potential conflicts of interest with respect to the research, authorship, and/or publication of this article.
Funding
The author(s) received no financial support for the research, authorship, and/or publication of this article.