
Abstract
The dynamic behavior of coastal structures under wave impact closely depends on the temporal and spatial variations of the impact load. The dynamic analyses and design of a coastal structure succeeds if the design load history for the wave impact is available. Since these types of data are very difficult to find, it is more proper to use a method based on static analysis. For this purpose, the ratio of the maximum value of the dynamic response to that found by static analysis is presented as a factor of multiplication and is called “dynamic magnification factor.” The dynamic magnification factors from waves breaking directly on vertical coastal plates with built-in edges are calculated for different thicknesses and aspect ratios. The governing equation of the problem is solved by finite element method in which a mesh dependency study is carried out for each plate to find the most appropriate mesh density. From the present computational results, it is suggested that the bending moments from the static analysis of plates can be modified by a factor of 1.15 to obtain the equivalent dynamic bending moments for the plate dimensions in the range of 0.8 ≤ a/b ≤ 3 and the wave condition considered in the study.
Introduction
The requirements for the constructions of ports and terminals for the receipt of ships and transferring cargos have been increased with the growth of world trade. Such coastal structures are generally protected from waves and high water levels by vertical breakwaters and seawalls. Therefore, the determination of dynamic forces caused by wave breaking on the structure is very important especially for design of seawalls, vertical faced breakwaters, and piers. The experimental data of model and prototype tests on the interaction of coastal structures and waves show that high-magnitude impact (shock) pressures are formed when waves break directly on seawalls which are vertical faced.1–12 From the past investigations,13–15 the spatial distribution of impact pressures on the wave–structure interface has become quite well known. There are various dynamic analysis on the spatial and temporal distribution of wave loading on structures using some numerical models;16–21 however, especially in engineering practice, it is more convenient to follow a method which is based on static analyses.
Using the information obtained from experiments performed on breaking wave impact pressures, the analysis of the response characteristics of a vertical caisson plate of a composite breakwater of prototype scale was studied theoretically by Kirkgoz and Mengi22,23 in which a dynamic magnification factor (DMF) representing the ratio of dynamic and static responses was proposed for a simplified dynamic design procedure of such plates. The past experimental results showed that impact pressures with high-magnitude and very short durations affect the histories of the wall deflection in minor level, and greater wall deflections are produced by the low impact pressures with relatively longer durations. 24 This experimental observation was verified by the results of dynamic analyses carried out by Tanrikulu et al., 25 in which the experimental wave impact pressures obtained by Kirkgoz 24 was used and the computed vertical wall deflection histories were compared with the measurements, and they concluded that vertical plate of a coastal structure which is exposed to breaking wave impact can be successfully analyzed by employing the classical theory of plates if the spatial and temporal variations of impact pressure values are available. Using the experimental impact pressure histories of Kirkgoz, 24 the static and dynamic analyses of the vertical test plate were carried out by Kirkgoz et al. 26 They found that when pmax/γH0 ≤ 18 (pmax is the maximum impact pressure on the plate, γ is unit fluid weight, and H0 is deep-water wave height), the maximum static and dynamic wall deflections are agreeably correlated to each other, and the DMF has a range of variation between 0.85 and 1.25 for the wall deflection and span moments.
The design of a coastal plate based on dynamic analysis is not very easy in engineering practice. Therefore, an equivalent design procedure based on the methods of static analysis of the plate is more convenient to follow, using the variation of impact pressures spatially, instead of applying the methods of dynamic analysis directly. In this regard, as a convenient alternative method, the equivalent dynamic analysis of plates used in coastal structures merits further attention for different structural conditions. In this study, using the experimental impact pressure histories from breaking waves, the dynamic behaviors of vertical plates having different dimensions with built-in boundaries were analyzed. Using the spatial distribution of impact pressures, the static analyses of the same plates were also carried out and the DMFs of the plates for deflections and bending moments were investigated.
Experimental data
The experimental data for the impact pressures from waves breaking directly on a vertical wall used in this study were collected by Kirkgoz. 24 In the experiments, a 10-mm-thick vertical steel plate having 2.00 × 0.57 m dimensions in horizontal and vertical directions was established on a beach with a slope of 1/10 (Figure 1). The details of the experimental setup are given in the mentioned study. 24 Using a U-shaped beam, the upper edge of the plate was strengthened horizontally, while the vertical edges of the plate are free. The lower edge of the plate and the two ends of the beam are assumed to be simply supported (“Hinge” in Figure 1). Ten pressure transducers were framed on the center line of the plate at 30 mm intervals with a start point at 37 mm above the bottom of the plate to measure the spatial distribution of impact pressure histories (Figure 1). A displacement transducer that is fixed to the point 187 mm above the lower edge and 40 mm to the left of center line was used to measure the deflection histories of the wall. The plate is referred to a right-handed Cartesian coordinate system (x, y, z) in which the origin is located at the bottom left corner (Figure 2).

Experimental setup for vertical plate exposed to breaking wave impact.

Computational mesh of the plate for finite element analysis.
Regular waves having a period of 2 s, H0 = 0.277 m, and deep-water wave steepness H0/L0 = 0.044 were used in the experiments (L0 is the deep-water wave length). The still-water depth at the wall was 0.160 m (“d” in Figure 1). The histories of impact pressure from the 10 transducers were stored at the same time with 25 µs sampling rate for a duration of 102.4 ms, at every impact of 90 waves totally. Figure 3 gives the concurrent vertical pressure distribution at the moment of the highest impact pressure on the plate and the history of the impact force on the plate together with some pressure history examples from the 10 transducers.
Governing equations and numerical solution
The dynamic behavior of the vertical plate exposed to wave impact was formulated using the classical theory of elastic plates. 27 The plate is referred to a right-handed Cartesian coordinate system (x, y, z). The origin is located at the bottom left corner. The (x, y) plane coincides with the mid-plane of the plate (Figure 2). z is in the direction of the force due to the impact pressure p(x, y, t) in which t is time. Figure 3(a) gives the example distributions of pressure in time and space determined experimentally.

(a) Impact pressure histories from the 10 transducers. The values on the vertical axis (i.e. 1, 2, 3,…, 10) represent the transducer numbers. (b) Impact force history on the plate, and (c) simultaneous vertical impact pressure distribution on the plate at the time when Transducer #5 is at its maximum.
The transverse displacement, w, of the plate in z-direction is governed by the following dynamic equation

in which


where Mx and My are the bending moments per unit length which act on the edges of the plate element parallel to the y- and x-axes, respectively.
For the present case, the vertical and horizontal edges of the plate are built-in for which the boundary conditions are


in which a and b are the width and height of the plate, respectively.
The plate is assumed to start its motion from the rest position. Accordingly, the transverse displacement and velocity of the plate at the initial time t = 0 should vanish, which yields

Plate deflection, w, can be found by solving equation (1), using the boundary and initial conditions defined by equations (4)–(6). The bending moments Mx and My can be determined from equations (2) and (3) using the values of w.
The spatial integration in equation (1) was performed using finite element method. Figure 2 shows an example computational mesh employed in this analysis. The mesh spacing in y-direction was so adjusted that the location of each transducer coincided with a nodal point in the mesh. The histories of wall deflection and bending moment were calculated using the histories of impact pressures obtained from the simultaneous recordings of ten transducers. The vertical distribution of impact pressure between the measurement points was assumed to be linear, and it was uniform in horizontal direction. The impact pressures along the bottom edge of the plate were taken equal to the pressure values measured by the nearest transducer (i.e. the transducer 1 in Figure 2). The solution of equation (1) was performed using the software called SAP2000® numerically. 28
DMF
The static analyses of the plate for w, Mx, and My were also performed using the simultaneous vertical impact pressure distributions (an example is given in Figure 3(c)). The theoretical results of the dynamic analyses of the plate are related to the ones obtained from the static analyses using the DMF which was given as a practically usable design tool for the dynamic analysis and the design of coastal plates using the results of static analysis. 22 The DMFs (R) for w, Mx, and My are defined as

It is stated in Clough and Penzien 29 that the maximum response produced in an undamped single-degree-of-freedom structure by impulsive loading is dependent only on the ratio of the impulse duration to the natural period of the structure, t1/T1, and the maximum value of dynamic response ratio (i.e. the DMF) as a function of t1/T1 for various forms of impulsive loads was plotted. As given in Figure 3(b), the history of the impact force resembles a triangular impulsive load with duration of t1. In this study, the variations of the DMFs Rw, RMx, and RMy defined by equation (7) were examined as a function of t1/T1 where T1 is the first natural period of the plate.
Numerical results
The static and dynamic analyses of the vertical steel plates of different aspect ratios and thicknesses, all having built-in boundaries, were carried out using the experimental wave impact pressures. The height of the plate was kept the same for all the cases as b = 0.57 m, which was identical with the height of the test plate. Four different widths a = 0.5, 1, 2, and 4 m were used for the analyses. The corresponding aspect ratios of the plates are a/b = 0.88, 1.75, 3.51, and 7.02. Three different plate thicknesses of h = 10, 15, and 20 mm were used for each of the plates. The material properties of the plate are ρ = 7800 kg/m3, E = 2.1 × 10¹¹ N/m2, and ν = 0.3. The histories of w, Mx, and My at node A, and My at node B, and Mx at node C in Figure 2 were computed with 50 µs intervals using the experimental pressure distributions from the impacts of 90 regular waves. The numerical results for the same quantities were also obtained from the static analyses.
Effect of mesh size
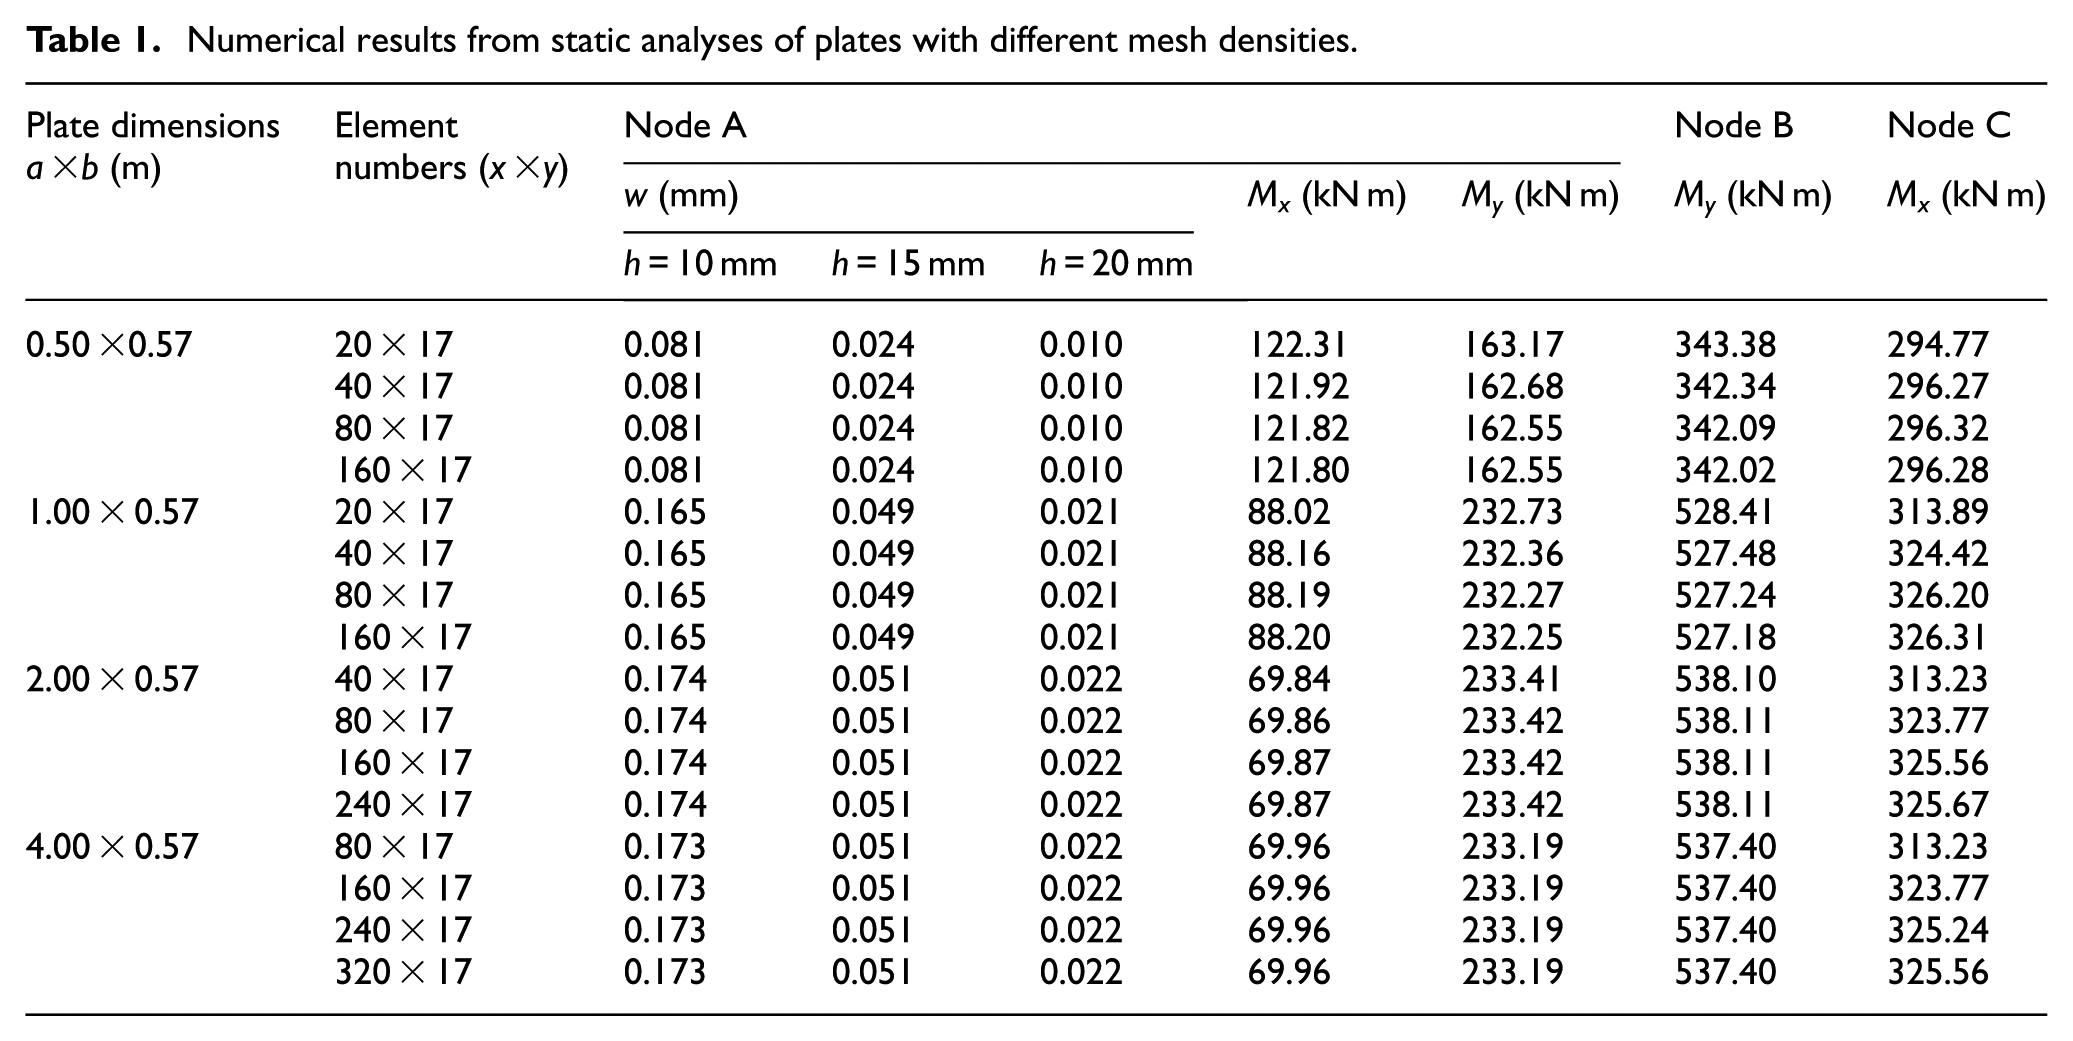
Rectangular mesh system used for the solution domain is shown in Figure 2. In order to see the effect of mesh size on the computational results, static analyses of the plates were carried out using different mesh densities. The results for the wall deflection and bending moments of the plates are given in Table 1. The bending moments do not change with plate thickness. As can be seen from the table, the change in the moment values is less than 1%, when the element numbers in x-direction are more than or equal to 40, 40, 80, and 160 for the plates having dimensions of a = 0.5, 1, 2, and 4 m, respectively. Having determined the appropriate mesh structure for each case, the corresponding numerical results of the dynamic and static analyses were used to determine the DMFs.
Numerical results from static analyses of plates with different mesh densities.
DMFs
The numerical results for the DMFs R defined by equation (7) obtained for the plate of a/b = 1.75 with h = 10, 15, and 20 mm are given in Figure 4. The scatter plots in the figure show that the values of R do not change with t1/T1. The mean value of R in the figure varies in the range of 0.774–1.142, 0.778–1.130, and 0.780–1.105 for h = 10, 15, and 20 mm, respectively.

Dynamic magnification factors against t1/T1 for the plate of a/b = 1.75 with thicknesses of (a) h = 10 mm, (b) h = 15 mm, and (c) h = 20 mm.
Figure 5 gives the variations of the mean values of Rw, RMx, and RMy for different plate thicknesses with aspect ratio. The figure reveals that the dynamic magnification responses of the plates for different variables behave almost similarly in the sense that they generally tend to increase to a maximum and then gradually decrease with increasing aspect ratio. It is seen in the figure that the DMFs are not much dependent on the plate thickness; therefore, in each of Figure 5(a)–(e), the average values of factors for the three thicknesses can be used to represent R for a particular a/b.

Variations of dynamic magnification factors (a) Rw at node A, (b) RMx at node A, (c) RMy at node A, (d) RMy at node B, and (e) RMx at node C with aspect ratio for plates of different thicknesses.
Variations of the average magnification factors, R, at nodes A, B, and C for the deflection and bending moments with a/b are given in Figure 6. It is seen that for the moments, the highest R values are obtained for Mx at node A between RMx = 1.126 and 0.623, and the lowest values are for Mx at node C between RMx = 0.914 and 0.352 depending on a/b. The present results are quite in agreement with the factors for deflection and span moments found by Kirkgoz et al. 26 for similar aspect ratios. Figure 6 shows that RMx and RMy at A, and RMy at B attain their maximums at a/b = 1.75 as 1.126, 1.061, and 1.016, respectively, and they are greater than 1.0 in the range of 0.8 ≤ a/b ≤ 3; it means that, the dynamic responses of the plate are greater than those of static. Consequently, the rectangular plates having aspect ratios in the range of 0.8 ≤ a/b ≤ 3 should be regarded as the most critical conditions for the dynamic magnification response. The results of DMFs show that using the modified results of static analysis, the dynamic design of coastal plates can easily be achieved without having to confer much more complicated methods of dynamic analysis.

Variations of dynamic magnification factors with aspect ratio.
Suggestions for engineering practice
In designing the vertical coastal plates with built-in edges under the breaking wave load, the DMFs given in Figure 6 can be used to modify the results of static analysis to obtain the dynamic calculations of deflection and bending moments. However, it seems more practical to suggest some generally acceptable R values for engineering applications. It was reported that when the aspect ratio a/b > 3, the plate can be assumed to behave like an infinitely long plate and the calculations for such a plate can be replaced by those for a strip. 27 Taking into account of this conclusion and the present results for bending moments in Figure 6, the following approximation for the DMF can be suggested for the calculation of dynamic bending moments of plates having aspect ratios in the range of 0.8 ≤ a/b ≤3, which is the case that mostly encountered in engineering practice

RM in equation (8) represents the DMF for the bending moments. For the design of vertical plates with a/b outside the above range, the static bending moments can safely be used by assuming RM = 1. However, as stated by Kirkgoz et al., 26 one should bear in mind that the present approach for the dynamic design procedure based on the results of static analysis should be limited to the design wave cases in which pmax/γH0 ≤ 18. Otherwise, the design calculations may end up with considerable overestimations because pmax/γH0 = 18 indicates the upper limit of the impact load that causes the maximum structural response. 26
Conclusion
The static and dynamic analyses of vertical steel plates of built-in edges with different thicknesses and aspect ratios were performed using the wave impact pressure data from a model test. Pressure histories from the breaking wave impact were used for the finite element analysis of the dynamic behavior of the plates, and the plate deflection and bending moment histories were calculated. The static analyses of the plates for the deflections and bending moments were also performed using the vertical simultaneous impact pressure distributions on the plate. The ratio of the maximum dynamic and static plate deflections and bending moments was defined as the DMF.
The results show that the DMF is almost independent of the plate thickness and it has a range of variation between 1.126 and 0.352 for the plate aspect ratios between a/b = 0.88 and 7.02. For the present computational cases, the plate with a/b = 1.75 gives the highest DMFs for most of the calculated deflections and moments. For a/b > 1.75, the value of DMF decreases with increasing aspect ratio. From the present numerical results, a value of RM = 1.15 can be suggested for the bending moments of plates having aspect ratios in the range of 0.8 ≤ a/b ≤ 3. As mentioned in the previous section, these results are valid for the analyzed wave condition. For plates with a/b outside this range, RM = 1 can be used. In order to take into account of the dynamic response of the coastal plates exposed to wave breaking, the results for the bending moments obtained from the static analysis can be modified by the suggested RM values. Consequently, by employing the modified results of static analysis, the engineering design of vertical coastal plates under breaking waves can easily be achieved without having to perform more complicated dynamic analysis.
Footnotes
Handling Editor: Pietro Scandura
Declaration of conflicting interests
The author(s) declared no potential conflicts of interest with respect to the research, authorship, and/or publication of this article.
Funding
The author(s) received no financial support for the research, authorship, and/or publication of this article.