
Abstract
The control valve of a diesel unit pump fuel system adjusts the pressure of the high-pressure fuel line through rapid opening to achieve fuel cut-off control. Previous research shows that the inner flow of the control valve is a dynamic cavitation flow process, and both the inlet/outlet pressures and valve lift have great influence on this process. However, the effect of the valve needle speed on the flow characteristics is not clear. This study presents an investigation of the effect of the valve needle speed on the flow characteristics within the control valve region during the fuel offloading process of a diesel unit pump fuel system based on a homogenous two-phase unsteady flow numerical model. The results show that under the condition of same inlet/outlet pressures, as the valve needle speed increases, the cavitation intensities of both the conical region and the conical downstream region are weakened. The effects of the valve needle speed on the mass flow rate under the condition of small valve needle opening can be ignored; under the condition of large valve needle opening, the higher the valve needle speed is, the greater the mass flow rate is.
Introduction
The unit pump fuel system is important for modern diesel engines to meet stringent emission standards and improve engine performance, especially for the heavy-duty diesel engines. Figure 1 shows the schematic diagram of the unit pump fuel system. For precise control of the fuel injection, in the high-pressure electronically controlled fuel system, there is a high-speed response control valve (the enlarged area of Figure 1) which connects/disconnects the high-pressure and low-pressure lines to adjust the fuel pressure. The control valve is a critical component in the fuel system, 1 and its flow characteristics determine the flow capacity of the control valve, the motion characteristics of the valve needle, the energy loss, and finally the injection performance of the fuel system. The inner flow within the control valve of the fuel system has its own characteristics, such as high pressure differential, great dynamic response, and small size flow area. These characteristics cause the inner flow within the control valve to be extremely complicated, and there is great turbulence, forming strong vortex and inducing cavitation.2–4 Initially, the inner flow of the control valve may cause great pressure fluctuations and noise, vibrations, efficiency loss, and erosion damage on surfaces of the mechanical components that will reduce valve reliability and control precision. 5 Compounding these factors, the inner flow can cause abnormal hydrodynamic force resulting in erratic movement of the valve. 6 This movement may change the flow discharge coefficient and the flow rate, which affects the flow capacity of the control valve. 7 In addition, the inner flow affects the fuel offload process related to the mass flow rate and the hydraulic delay characteristics, and, finally, affects the injection characteristics. 8
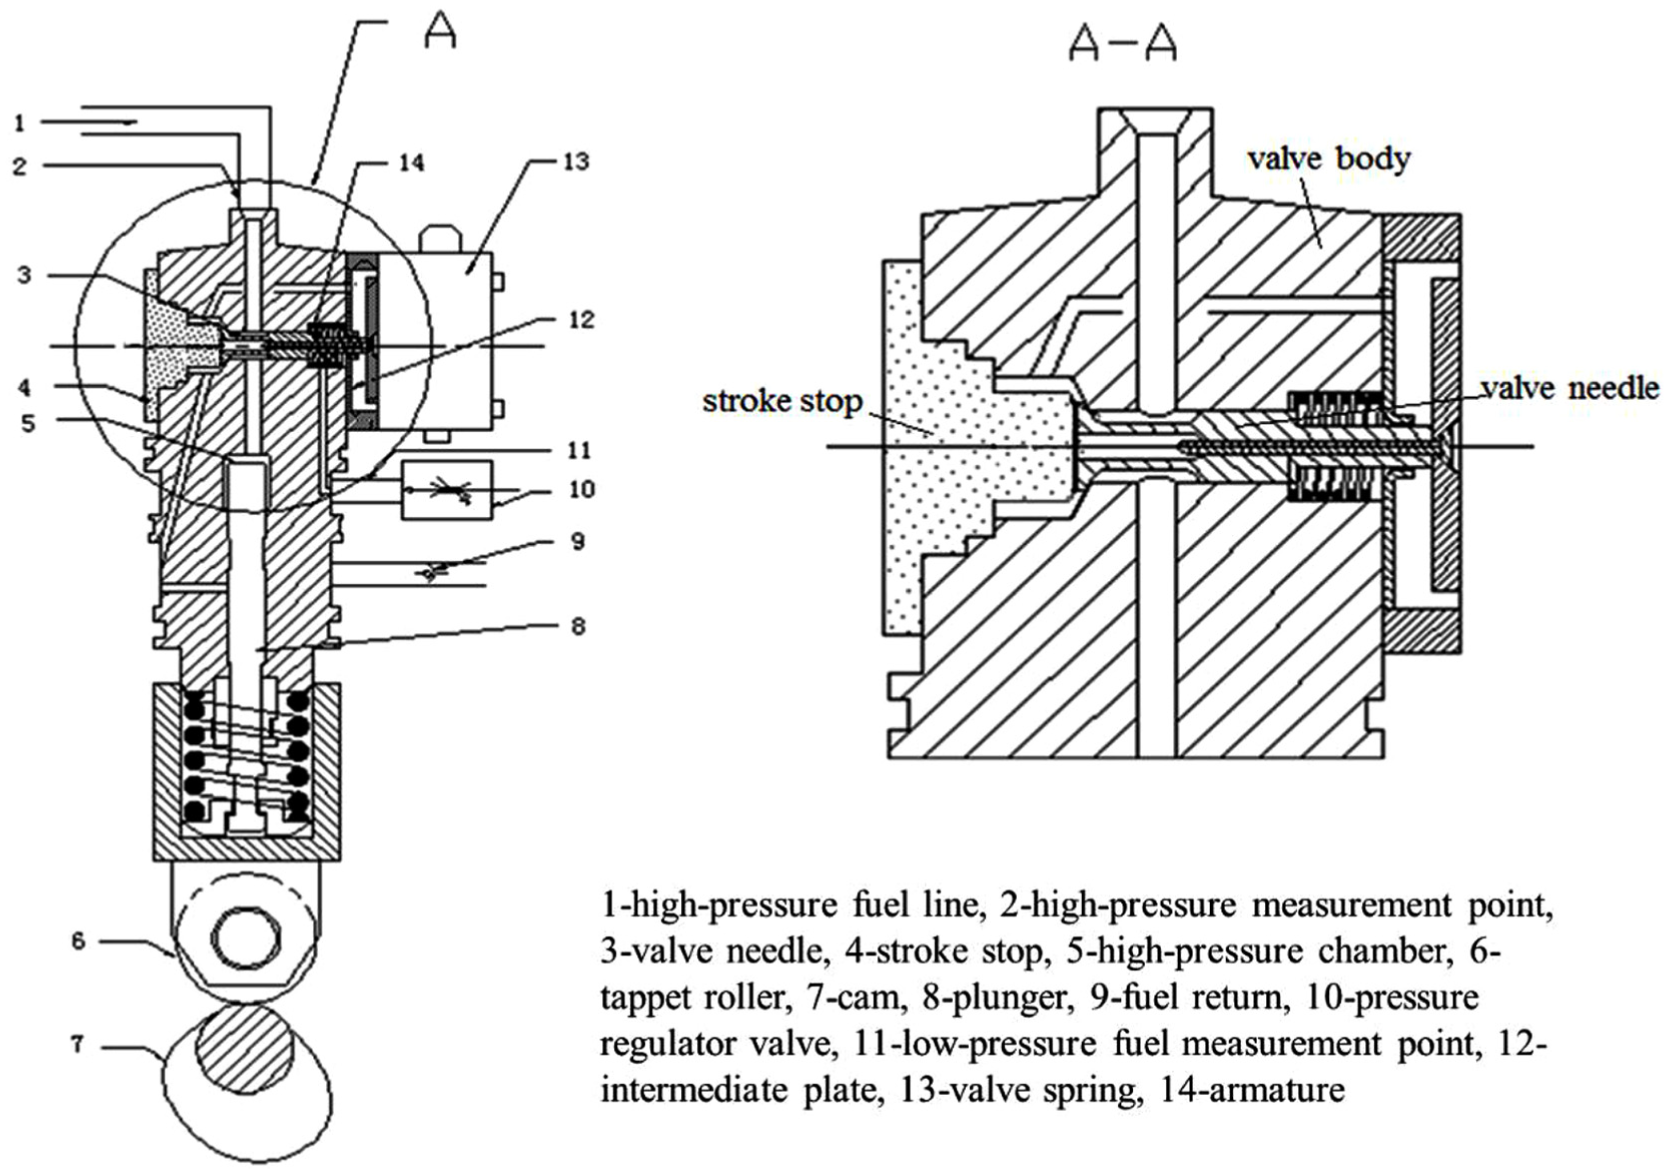
The schematic diagram of the unit pump fuel system.
Because the complex inner flow of the control valve has great effects on the fuel offloading process, many researchers have studied the flow characteristics of the control valve. Washio et al. 9 observed the cavitation occurring in an oil hydraulic poppet valve and reported that the major reason for the cavitation is the separation of flow and a colliding motion between the solids contacting in the liquid. Wang et al. 10 studied the flow and cavitation characteristics within the control valve of the fuel injector and pointed out that both the pressure and the velocity are the important factors which affect cavitation. The increase in the flow velocity induces the decrease in the pressure within the flow field which then aggravates the development of cavitation. Bernad and Susan-Resiga 11 predicted cavitation based on a two-dimensional (2D) fluid model of a hydraulic poppet valve and the results demonstrated that a computation of a steady cavitation flow does not depend on the bubble number density, which is an important parameter characterizing the governing equations of the cavitation models. Valdés et al. 12 investigated the cavitating flow through a ball check valve by experimental and numerical simulation and found that cavitation greatly affects the mass flow rate and the hydrodynamic force of the valve. Chern et al. 13 studied the condition for the inception of cavitation in a ball valve by the particle-tracking flow visualization method and proved that the method is good for understanding the condition for the inception of cavitation. Amirante et al. 14 theoretically and numerically studied the effects of the spool geometry on the flow forces of a hydraulic proportional directional valve and found that the new geometry of the spool allows a large flow force reduction of about 15%.
Most of the literatures above focus on steady flow inside a similar valve under constant conditions such as of the fixed valve opening and fixed inlet/outlet boundary conditions. However, the working process of the valve for the fuel system is dynamic because the valve opens and closes at high speed. Zhao et al. 15 proved that the valve needle speed greatly affects the transient flow force of a hydraulic valve. However, the effects of the valve needle speed on the flow process have not been studied. This is a spool valve with the pressure differential less than 2 MPa. Qiu et al. 16 proved that the inner flow state within the control valve of the unit pump fuel system is transient and unsteady because of the valve needle’s dynamic movement and the inlet/outlet pressure fluctuations. The effects of the pressure fluctuations on the flow characteristics have been most extensively investigated.17–18 However, few studies address the effects of the valve needle speed on the flow characteristics under the condition of high pressure differential. This study investigates the cavitation characteristics and flow capacity of the control valve for unit pump fuel system under the condition of different valve needle speeds based on a 2D unsteady numerical model which has been validated.
Numerical simulation of inner flow
Model establishment and validation
In this work, a 2D homogenous two-phase unsteady numerical model is built based on the commercial computational fluid dynamics code ANSYS FLUENT. To simplify the simulation, a symmetrical 2D geometry model of the control valve is adopted (Figure 2). The mesh type is set to TRI (triangle) which is an unstructured grid with a flexibility good enough to adapt to complex boundary. The grids of the sealing cone surfaces are refined because the conic zone should be paid more attention. The orthogonal quality is one of the evaluation criterion of the mesh. Once it is greater than 0.2, the mesh has high quality. In this study, the orthogonal quality of the mesh is 0.5, which is sufficient for the simulation calculation. In addition, the dynamic mesh is used because the valve needle keeps moving during the valve operation. The moving faces are the faces of the needle (Figure 2: A, D, H, I, J). A user defined functions program based on the test data is compiled to define the moving speed of these move faces. The grids update methods are set to spring-based smoothing and local refreshing. The boundaries between the fluid and the moving faces are defined as deforming faces (Figure 2: B, K).

The meshing diagram of control valve.
The mixture model is adopted as the multiphase setting. To simplify the simulation, there is no slip between the two phases (gas-liquid). For the cavitation model, the Zwart–Gerber–Belamri model 19 is adopted, and the initial diameter of the bubble is set to 0.001 mm. The saturation vapor pressure of diesel in this model is set to 5400 Pa at the vaporization temperature of 341 K. To model turbulence, the transition SST model is used. For the discretization of the momentum equation, bounded central differencing schemes are selected. A first-order upwind scheme is selected for the turbulence. The physical parameters of the diesel fuel and diesel vapor are shown in Table 1.
Parameter setting.

The grid independence analysis is done by comparing the average mass flow rate under different grid densities, and the model validation is completed by the comparison of relative cavitation intensity between the model simulation results and the optical test images. The optical test results, the grid independence analysis, and the model validation are shown in the author’s previous published paper. 4 The model validation results show that this simulation model can be used to analyze the flow characteristics within the valve.
Boundary condition settings
To analyze the effect of the valve needle speed on the flow characteristics, the valve needle is set to move at different speeds, such as 0.1, 0.2, 0.5, and 1 m/s, under the conditions of different needle lifts (lift = 0.02, 0.04, 0.08, 0.10 mm) together with constant inlet/outlet pressures. The boundary pressure values are the test data in Qiu et al. 16 (Figure 4). Meanwhile, to investigate the effect of the valve needle speed on the flow capacity in details, further simulation is made, in which the inlet pressure of the valve is constant while the outlet pressure varies under the conditions of given needle lifts and given valve needle speeds (speed = 0.1, 0.5, 1 m/s). For example, at the lift = 0.02 mm, the inlet pressure is 124 MPa under the conditions of different valve needle speeds (speed = 0.1, 0.2, 0.5, 1 m/s); similarly, the outlet pressure is increased from 2 to 50 MPa under the conditions of different valve needle speeds (speed = 0.1, 0.5, 1 m/s), but at the speed of 0.2 m/s, the outlet pressure is 2 MPa. The boundary conditions are shown in Table 2.
Boundary conditions setting.

Results discussion
The effect of valve needle speed on cavitation characteristics
Figure 3 shows the cavitation of different valve needle speeds under the condition of given needle lifts. For the definition of the relative cavitation intensity, it is similar to the relative brightness in Qiu et al. 4 It shows that cavitation mainly locates in two regions. One is the conical region which is marked by a red box, and the other one is the downstream of the conical region. The results show that as the needle lift becomes larger, the cavitation in both the conical region and the downstream of the conical region becomes stronger under the same valve needle speed. Also, under the same needle lift, as the valve needle speed becomes larger, the cavitation in both the conical region and the downstream of the conical region becomes weaker.

Cavitation under different valve needle speeds: (a) vapor volume fraction and (b) relative cavitation intensity: (i) 0.02 mm (ii) 0.04 mm, (iii) 0.08 mm, and (iv) 0.10 mm.
According to Qiu et al., 4 cavitation in the conical region is induced because the fluid velocity increases and the pressure dramatically drops, while cavitation in the downstream of the conical region is induced by the vortexes which are induced by fluid separation from the wall. Figure 4 shows the velocity streamline. First, for the conical region (marked by the red box), as the valve needle speed decreases, the fluid velocity increases, too. According to the Energy Conservation Law, the lower the fluid velocity is, the higher the pressure is. Thus, the cavitation becomes weaker. Meanwhile, in the downstream of the conical region, there is a main vortex (marked by a red circle). Under the same needle speed, as the valve needle speed increases, this main vortex becomes smaller and closer to the conical outlet, which causes the cavitation to become weaker. As the valve opens, the fluid flows at a great velocity from the narrow conical zone to the relatively wide downstream region, which is jet flow. This jet flow causes fluid separation to form a vortex. The vortex develops and moves together with the fluid flows. However, when the valve needle speed increases, the fluid velocity of the conical outlet becomes smaller, and the moving time of the valve needle becomes shorter so that the moving time of the main vortex becoming shorter. Finally, the main vortex becomes smaller and closer to the conical outlet, and then the cavitation in the downstream of the conical region becomes weaker.

Velocity streamline.
Figure 5 shows the turbulence kinetic energy of different valve needle speeds under the condition of given needle lifts. In addition, Figure 5(a) shows the turbulence kinetic energy contour, and Figure 5(b) shows the relative turbulence kinetic energy intensity. The turbulence kinetic energy mainly locates in the downstream of the conical region. The turbulence kinetic energy originates from the conical outlet, then it develops toward the downstream close to the needle, and it continues to develop to the outlet. Under the same needle lift, the turbulence kinetic energy decreases as the valve needle speed increases. It means that the larger the valve needle speed is, the weaker the turbulence is, which means the cavitation becomes weaker.

Turbulence kinetic energy: (a) turbulence kinetic energy contour and (b) relative turbulence kinetic energy intensity.
The effect of valve needle speed on flow capacity
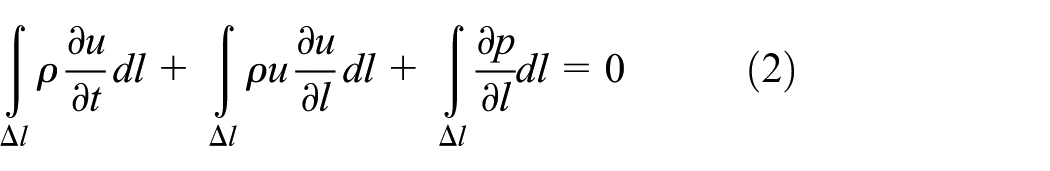
Figure 6 shows the diagram of control valve flow field. The flow field of the control valve is constructed as a simplified one-dimensional flow model. According to the principles of fluid mechanics, the fluid momentum equations of one-dimensional flow are shown as follows

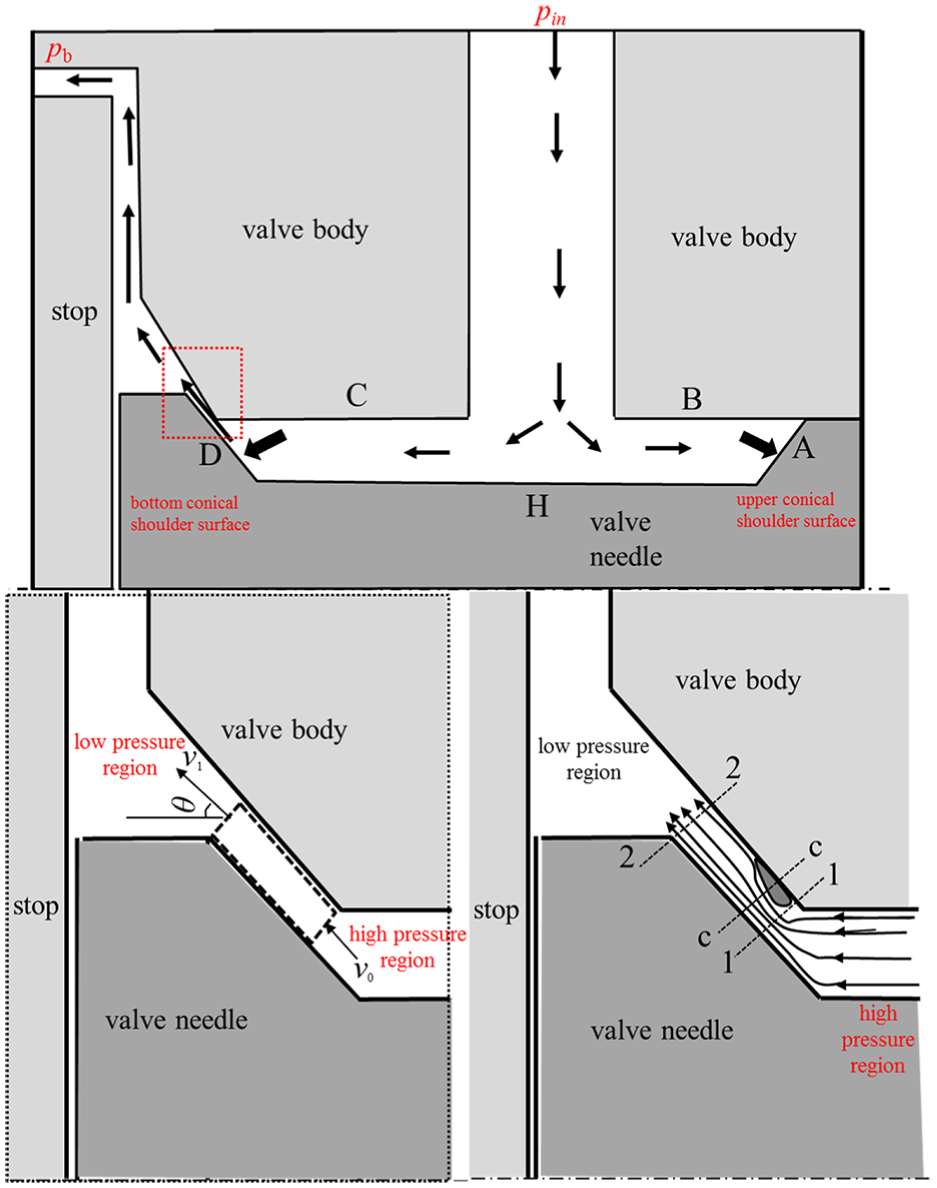
The diagram of control valve flow field.
Based on the integral (integrating range: Δl = l1 – l2) of equation (1) along the conic region from the conic inlet to the conic outlet, equation (2) is deduced
Under the steady flow, the

Comparing equation (2) with equation (3), the difference between the unsteady and the steady is

where Qm is the mass flow rate, Cd is the discharge coefficient, Δp is the differential pressure between the inlet and the outlet, ρ is the density of the fluid, and A is the flow area.
In the flow formula, the Δp is the differential pressure between inlet and outlet under the steady flow. However, under the unsteady flow, the differential pressure between the inlet and the outlet includes two parts: one is the differential pressure between the inlet and the outlet Δp1 and the other is the differential pressure induced by the inertial force because of the unsteady flow Δp2. Then, we get the differential pressure under the unsteady flow as follows

By incorporating equation (5) into equation (4), we get

According to equation (6), when the control valve moves, the mass flow rate of the control valve is determined by both Δpuns and
Figure 7 shows the acceleration of fuel of the conical region under the conditions of the given needle lifts (i.e. 0.04 and 0.08 mm), and the given outlet pressures (i.e. 3.6 and 40 MPa). Under the condition of small valve needle opening (lift = 0.04 mm), the acceleration of fuel of the conical region remains almost unchanged. This means that the mass flow rate of the control valve remains stable under the condition of small valve needle opening. However, under the condition of large valve needle opening (lift = 0.08 mm), as the valve needle speed increases, the acceleration of the fuel decreases. As a consequence, the mass flow rate of the control valve increases with the increase in the valve needle speed under the condition of large valve needle opening.

The acceleration of fuel of the conical region.
Figure 8 shows the mass flow rate of the control valve under the condition of constant inlet pressure but varied outlet pressure. It shows that the mass flow rate increases with the decrease in the outlet pressure, and it becomes saturated at last. Under the condition of small needle opening (lift = 0.02 and 0.04 mm), the mass flow rate under different valve needle speeds is almost equal, which has a difference value of 0.001 kg/s at lift = 0.02 mm and the difference value of 0.0005 kg/s at lift = 0.04 mm. Conversely, under the condition of large needle opening (lift = 0.08 and 0.10 mm), it is obvious that with the increases in the valve needle speed, the mass flow rate increases. The difference value is about 0.003 kg/s at lift = 0.08 mm, while about 0.013 kg/s at lift = 0.10 mm. Thus, it proves that the valve needle speed influences the mass flow rate of the control valve by affecting the acceleration of fuel. To improve the flow capacity of the control valve, it is useful to optimize the valve needle speed under different needle lifts; the fuel offloading ability of the fuel system is also improved.

Mass flow rate of the control valve: (a) 0.02 mm, (b) 0.04 mm, (c) 0.08 mm, and (d) 0.10 mm.
Conclusion
This article presents a simulation of 2D unsteady numerical model of the control valve of the unit pump fuel system and investigates the unsteady flow details under conditions of different valve needle speeds during the fuel offloading period; further, the effects of the valve needle speed on the cavitation characteristics and flow capacity are analyzed. The conclusions can be summarized as follows:
The valve needle speed has influences on cavitation characteristics. Under the condition of same needle opening, as the valve needle speed becomes larger, the fluid velocity of the conical region decreases so as to weaken the cavitation in the conical; the main vortex becomes smaller and closer to the conical outlet so as to weaken the cavitation in the downstream of the conical region.
The valve needle speed has influences on flow capacity. The valve needle speed influences the mass flow rate of the control valve by influencing the acceleration of fuel in the conical region. Under the condition of small valve needle opening, the valve needle speed has few effects on the acceleration of fuel, and the mass flow rate remains stable. Under the condition of large needle opening, as the valve needle speed increases, the acceleration of fuel decreases, and the mass flow rate increases. It can also be concluded that in the case of other factors remaining unchanged, high valve needle speed is good for the fuel offload process under the condition of large needle opening.
Footnotes
Acknowledgements
The authors gratefully acknowledge financial support for this work from the National Natural Science Foundation (91641106) and the Beijing Municipal Natural Science Foundation (3172007) and General Program of Science and Technology Development Project of Beijing Municipal Education Commission (KM201610005018). In addition, the authors acknowledge the Collaborative Innovation Center of Electric Vehicles in Beijing and Beijing University of Technology for their financial support of this work.
Handling editor: Roslinda Nazar
Declaration of conflicting interests
The author(s) declared no potential conflicts of interest with respect to the research, authorship, and/or publication of this article.
Funding
The author(s) disclosed receipt of the following financial support for the research, authorship, and/or publication of this article: This research was funded by the National Natural Science Foundation (91641106) and the Beijing Municipal Natural Science Foundation (3172007) and General Program of Science and Technology Development Project of Beijing Municipal Education Commission (KM201610005018).