
Abstract
In the pre-tactical phase of air traffic flow management, flights in terminal airspace generate plans, such as rerouting and holding, as influenced by the weather. Hence, the new flight rerouting and holding path should be confirmed by combining the original flight plan and the short-term weather radar map. Decision-making for rerouting and holding should consider not only flight safety but also the operating cost of flight delay acquired through accurate calculation. A specific fuel consumption model of leveling and descending phases of arrival aircraft in Base of Aircraft Data database was used in this article. Arrival route was divided into several leveling and descending legs, and the fuel consumption model of the arrival flight established. Delay time and fuel costs of the arrival flight attributed to the execution of a rerouting strategy and holding procedure were calculated, respectively. The operating cost prediction model of flight delay in the terminal area with consideration of the aircraft model and arrival route were established, and decision-making support was provided for diverted operation in the terminal in relation to flight delay cost. Finally, arrival routes in the terminal area in Shanghai were subdivided into different flight legs. The delay cost of the main aircraft model was calculated and a comparative analysis of arrival delay cost obtained through theoretical calculation and quick access recorder of the actual flight data was conducted. The results indicated that the proposed prediction model of flight delay cost could provide a relatively accurate basis for decision-making in aviation operation.
Introduction
Short-term weather variations exist in terminal airspace and cause abrupt declines in the capacity of terminal airspace and operating efficiency. The sharp increase in flight delay cost affects normal flight arrival and may even cause flight safety accidents. Severe weather variations are an important reason for flight delay. Passenger airline companies in China executed a total of 3,373,000 flights in 2015, mean flight on-time performance rate was 68.33%, and flight delays caused by weather comprised 29.53%. 1 In 2015, the proportion of flight delays attributed to weather in the US National Airspace System reached as high as 53.1%. 2 Single European Sky Atm Research 3 and Next Generation of Air Transportation System in the United States4–8 have regarded air traffic delay analysis under weather variations to be an important research topic. Flight delay cost analysis is also an important aspect that should be considered in flight decision-making.
With regard to an arrival flight under short-term weather change, the arrival route is usually blocked by meteorological cloud clusters and, hence, the reroute strategy must be implemented, allowing the aircraft to fly for a certain additional distance based on the original route provided. Airport runway capacity is reduced because of short-term weather variations, causing the service rate of arrival flight to decrease and circling and holding in air to occur before implementation of the approach procedure. The implementation of the preceding rerouting strategy and holding procedure will lead to an increase in fuel consumption and arrival time of the flight, as well as in fuel and time costs, thereby increasing flight delay cost and leading directly to economic loss of the airline. Therefore, apart from flight safety, acquisition of accurate flight delay cost is the important basis that should be considered in rerouting and holding decisions for operation during the arrival process. The flight delay cost problem attributed to the rerouting strategy and aerial hold procedure in the terminal area under short-term weather influence are discussed in this article and a quantitative analysis of delay time cost and fuel cost of the flight was conducted. The flight delay cost prediction model was proposed to calculate the delay cost of arrival flight in the terminal area accurately.
The estimation problems of delay cost at the terminal airspace have been extensively studied in the literature. Several scholars have conducted analyses of complicated external factors such as correlation analysis between flight delay cost, and factors such as air traffic capacity, weather, and air ticket price. For example, Post and colleagues9,10 explored and developed the National Airspace System Performance Analysis Capacity simulation tool and established limiting conditions for airspace capacity by combining flight path, weather, flight plan, route, and airport capacity. Hansen and Wei 11 proposed a multivariant postmortem analysis to study the influence of the sharp increase in the Dallas-Fort Worth Airport capacity. The extraneous income attributed to reduce delay was observed to compensate for the flight demand and flight plan of the airline apart from improving operating efficiency. Zou et al. 12 established a functional model between flight delay cost with air ticket price and flight frequency. The results of the empirical analysis indicated that flight delay would result in an increase in air ticket price and flight frequency. Comparing planned and actual flight paths, Belkoura et al. 13 studied the generation mechanism of flight delay and the results indicated that the generation of flight delay was related to flight phase and flight location to a great extent, and presented randomness in time and space.
The economic cost of flight delay has also been analyzed based on airline yield management. For example, Steinbach and Giles 14 indicated that extraneous income attributed to reduced flight delay was usually measured through cost saving of the airline and shortened travel time of passengers. This measurement method was intuitive; however, it did not consider follow-up influences on flight delay on the airline and passenger demand. Zou and Hansen 15 proposed a computing method for overall flight delay cost and analyzed the overall benefit and cost of the airline in a quarterly operation. However, they did not analyze aircrew cost, maintenance cost, fuel cost, and other costs in detail. Zou and Hansen 16 also indicated that capacity change would cause complicated interactions between flight delay with passenger demand, flight ticket price, flight frequency, and aircraft model, thereby resulting in fluctuation of the balance between supply and demand. They also proposed an analytic model involving multiple influencing factors, and the results indicated that decreased capacity would result in decreased flight demand and flight frequency as well as passenger cost. 8 Several scholars have analyzed the airline operating cost attributed to the delay through simulation, 17 data statistics, 18 and establishment of cost indices to realize delay cost management. 19
Other studies have analyzed travel cost attributed to flight delay based on passenger travel. For example, Baik et al. 20 conducted a selective analysis of the influence of flight takeoff delay on the opportunity cost of passengers in the landing station. Lubbe and Victor 21 established a quantitative model of direct loss caused by flight delay to individual unit time and evaluated delay cost of the airline within one period (days, weeks, months, and years). Peterson et al. 22 divided flight delay cost into direct operating cost of flight delay, indirect loss of business travelers, and opportunity cost of leisure travelers and utilized the quantitative model to analyze passenger travel cost in air transportation. 23
A key element of the flight delay cost literature is the focus on the influence of air traffic efficiency on fuel consumption. For example, a study conducted by Delgado and colleagues24–26 indicated that an aircraft flying at an economical cruising speed could not only reduce fuel consumption rate, that is, lower fuel cost, but also increase airborne time cost. Ryerson et al. 27 studied the influences of flight delay and regulation efficiency of terminal area on aircraft fuel consumption, built a prediction model of aircraft fuel consumption, and analyzed their respective influences on aircraft fuel consumption. Zou and Hansen 28 evaluated aircraft fuel efficiencies of 15 large-scale airlines and indicated that flight fuel consumption was closely related to revenue per mile. Hao et al. 29 collected flight fuel load and consumption data of one US large-scale airline and used a statistical model to study the relationship between flight fuel loading capacity and predictability of flight operation. Their study indicated that excessive fuel loading capacity would increase aircraft fuel consumption and operating cost.
Previous scholars have studied the influences of flight delay on the operating cost of the airline and the passenger travel cost from multiple aspects, and these studies provide references for the study in this article. However, in the pre-tactical phase of air traffic management, flight plans such as reroute and hold, which are generated by flights in the terminal area because of the weather, can accurately determine delay cost of arrival flights of aircraft only by combining the original flight plan and the weather radar map to establish a new flight rerouting and holding path and consider the differences between different aircraft models and legs in fuel consumption. Several studies have also discussed delay and fuel costs caused by flight reroute and air hold under severe weather in the terminal airspace. The main research contributions of this article are as follows:
Based on the Base of Aircraft Data (BADA) database 30 and in consideration of aircraft reroute strategy and hold procedure under severe weather in the terminal airspace, flight legs of aircraft arrival and approach flight procedure were divided to establish the calculation model of arrival aircraft fuel consumption and solve the calculation problems of fuel consumption of different aircraft models in different legs.
In consideration of the operating cost of time and fuel consumption generated by flight arrival, the prediction model of delay arrival costs of different aircraft models was established based on time and fuel cost.
Quick access recorder (QAR) is an airborne flight recorder designed to provide quick and easy access to raw flight data. A QAR receives its inputs from the flight data acquisition unit (FDAU), recording over 2000 flight parameters. Therefore, we can extract arrival data from it as the test data to verify the model. By introducing calculated arrival examples in Shanghai terminal area and QAR arrival data, the influences of different aircraft models and different arrival procedures on arrival time cost and fuel consumption are discussed, and a comparative analysis of theoretical calculation data of delay cost and QAR actual operation data implemented.
The rest of this article is organized as follows. In section “Models,” based on the BADA fuel consumption model and according to the arrival flight procedure, the calculation model of aircraft arrival fuel consumption was established. The types of flight operating costs were analyzed and the flight delay cost prediction model was established based on the fuel consumption model in section “Case study: results and discussion.” Section “Conclusion” discusses the analysis of actual calculated arrival example in Shanghai terminal area and the comparison with QAR operation data of actual fights, model feasibility, and accuracy.
Models
BADA-based calculation model of fuel consumption rate
BADA provides a set of ASCII files containing performance and operating procedure coefficients for 338 different aircraft types. The coefficients include those used to calculate thrust, drag, and fuel flow and those used to specify nominal cruise, climb, and descent speeds.
Fuel consumption rates of engines of relevant aircraft models from BADA database were used to establish the BADA-based fuel consumption model and calculate fuel consumption of aircraft executing arrival procedures. The fuel consumption model of engines of relevant aircraft models from BADA database utilized the list of aircraft model performance parameters to acquire fuel consumption coefficients of the aircraft in leveling and descending phases, as well as the thrust coefficient to obtain the fuel consumption rate within the unit time. 30 Aircraft fuel consumption rates in leveling and descending phases in the user manual for BADA are described in Table 1.
BADA operations performance parameter summary. 30

Leveling phase
Maximum flight leveling thrust
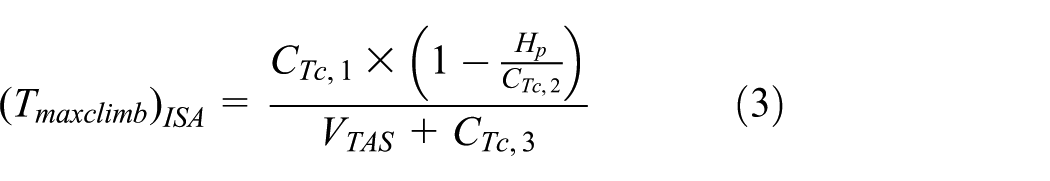
Maximum leveling thrusts of unit sets of turbojet, turboprop, and reciprocating piston engines are computed as

Formula (1) shows that maximum climbing thrust must be obtained to solve the maximum leveling thrust of a single engine. First, under the international standards of atmospheric temperature, the maximum climbing thrust of a single turbojet engine is

The maximum climbing thrust of a single turboprop engine is
The maximum climbing thrust of a single reciprocating piston engine is

Under actual atmospheric temperature, temperature correction of the maximum climbing thrusts of turbojet, turboprop, and reciprocating piston engines is performed and the maximum climbing thrust of a single engine is

The constraint conditions are

Fuel consumption rate of the aircraft in leveling phase
The fuel consumption rates of turbojet and turboprop engines are as follows

For turbojet engine, the fuel consumption rate is

For turboprop engine, the fuel consumption rate is

The fuel consumption rate of a reciprocating piston engine is

Descending phase
Aircraft thrust in descending phase
Landing thrusts of aircraft with turbojet, turboprop, and reciprocating piston engines are, respectively, computed as follows:
When

When

When the aircraft is in the approach phase

When the aircraft is in a descending phase

Fuel consumption rate in aircraft descending phase
The fuel consumption rates of turbojet and turboprop engines are

The fuel consumption rate of a reciprocating piston engine is

Calculation model of fuel consumption
Arrival procedure in the terminal area comprises a series of flight conditions, and a typical instrument arrival and approach may be divided by up to four segments: arrival leg, initial approach, intermediate approach, and final approach. Arrival leg is the constant speed descending phase and decelerated leveling phase of the aircraft from the arrival point in the terminal area to the initial approach fix (IAF). Initial approach is the constant speed descending phase of the aircraft from the IAF to the intermediate fix (IF), thereby completing the flight path alignment. The intermediate approach is the phase from the IF to the final approach fix (FAF), and this phase is used to adjust appearance, speed, and location of the aircraft, thereby facilitating the steady entrance of the aircraft to the final approach leg. Final approach leg begins either at a designated FAF or at an established point on the final approach course for a nonprecision approach. When an FAF is not designated (on-airport very high frequency omnidirectional range (VOR) or non-directional beacon (NDB)), this point is typically where the procedure turn intersects the final approach course inbound and is referred to as the final approach point. For a precision approach, the final approach segment begins when the glide slope is intercepted at the minimum glide slope intercept altitude.
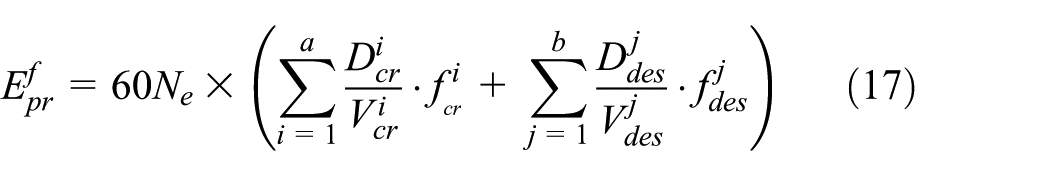
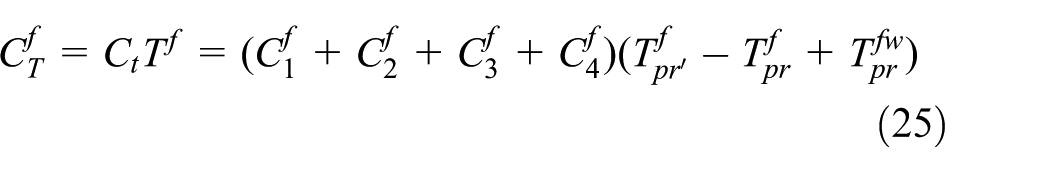
Hence, as a whole, arrival and approach legs in the terminal area comprise a leveling and descending phase. Under complicated short-term weather, superposition combinational calculation of the leveling and descending legs should be conducted in combination with the actual aircraft reroute status to calculate the fuel consumption requirement of the aircraft when executing arrival and approach procedures. For one arrival flight
Operating cost prediction model of flight delay
Flight direct operating cost can be divided into time cost and fuel cost. The former is the sum of all expenses related to time, including aircrew hourly cost, maintenance cost, aircraft and engine depreciation cost, and other expenses, whereas the latter is related to fuel price, fuel mileage, and cruising range. Time and fuel cost are related to the aircraft model, and different aircraft types have different aircraft hourly costs, maintenance costs, aircraft and engine depreciation costs, other expenses, and fuel consumption rates of aircraft engine.
Time cost of flight delay
Planned flight arrival time
According to the standard arrival procedure of the airport of destination, the arrival route executed by the scheduling flight when descending from the corridor in the terminal area to the airport of destination is fixed. Arrival procedure

Actual flight arrival time
With regard to short-term weather variations in the terminal area, possible rerouting strategies will cause changes in the arrival procedure. Arrival procedure

Flight hold time
Variations in the short-term weather conditions cause a decrease in runway arrival capacity and arrival service rate; consequently, arrival flight has to circle and hold outside the starting approach locating point IAF. Flight hold time is assumed to be
Variable definitions:
s: slots under short-term weather, obtains its integer,
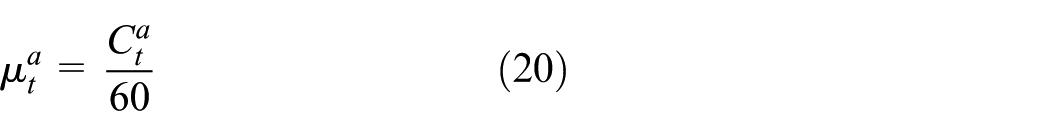
Service rate of the tth slot
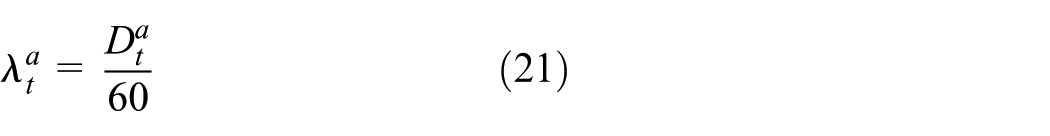
and arrival rate of the tth slot

Mean hold time of arrival flights in the tth slot, namely, arrival flight delay time

Arrival flight hold time within the s slot is

Time cost of flight delay
Delay time cost
Fuel cost of flight delay
Arrival fuel consumption

Arrival fuel consumption

Fuel consumption
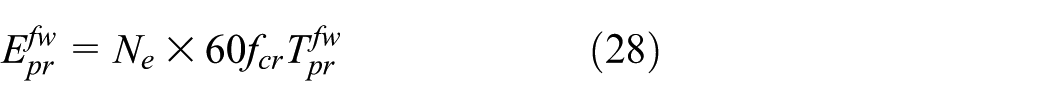
Fuel cost
Overall delay cost of flight arrival in the terminal area
Overall arrival flight delay cost

where


In the equation:
Case study: results and discussion
Flights arriving in the Shanghai terminal area and landing on Pudong Airport are taken as examples, and flight fuel consumption and delay costs of different aircraft models and arrival routes are discussed in this article. This calculated example was divided mainly into two parts:
Under the same arrival route, the fuel consumption model and delay cost prediction model were used to calculate theoretical fuel consumption values and delay cost values of flights of different aircraft models.
According to the actual flight operating QAR data of one airline and under the same aircraft model conditions, the fuel consumption model was used to calculate the theoretical fuel consumption values of flights with different arrival directions, namely, different arrival routes, and these theoretical values were compared with actual fuel consumptions of flights in QAR. The accuracy of the fuel consumption model was also verified.
Pudong Airport in Shanghai terminal area has flights from four arrival directions: AND, SUF, IBEGI, and DUMET. The arrival route of the AND direction is
Arrival directions and types of flights

Data
Aircraft performance parameters
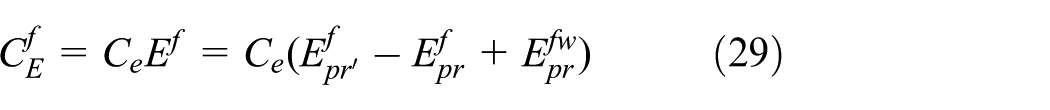
According to files in Aircraft Performance Operational File format in BADA database, with A320-212 taken as an example, thrust and fuel consumption coefficients of A320-212 could be obtained as shown in Figure 1. Statistical performance parameters of A320-212, A321, A330-301, A340-313, B737-800, B757-200, B767-300ER, and B777-300 from BADA database are shown in Table 3.
Thrust coefficient and fuel consumption coefficient of A320-212 from BADA database.
Performance parameters of aircraft types.

Fuel consumption parameters of different legs on each arrival route in the terminal area
Figure 2 shows that the arrival route of the Shanghai terminal area is divided into four directions: AND, SUF, IBEGI, and DUMET. Red lines represent arrival routes, blue lines(dashed line) represent departure routes, and yellow lines represent rerouting legs influenced by weather in the arrival direction of AND. When the waypoint, leg distance, and height of each arrival route, as well as aircraft speed, are confirmed based on thrust and fuel consumption coefficients of different aircraft models, fuel consumption rates of different models of aircraft in each arrival phase could be obtained through calculation according to the fuel consumption model in aircraft leveling and descending phases in section “Models” of this article. A concrete analysis is shown below.

Arrival and departure routes and rerouting legs in Shanghai terminal area.
Arrival route of AND direction
Table 4 shows that calculations of the consumption rates of aircraft in various phases of planned arrival route BK-BAVIK-IGLIT-XSY-PVG according to the performance parameters of A320-212, A321, A330-301, A340-313, B737-800, B757-200, B767-300ER, and B777-300, fuel.
Planned arrival route data of AND direction.

Planned arrival route is assumed to be influenced by severe weather as shown in Figure 2, in which the rerouting legs executed by the aircraft is
Rerouting leg data of AND direction.

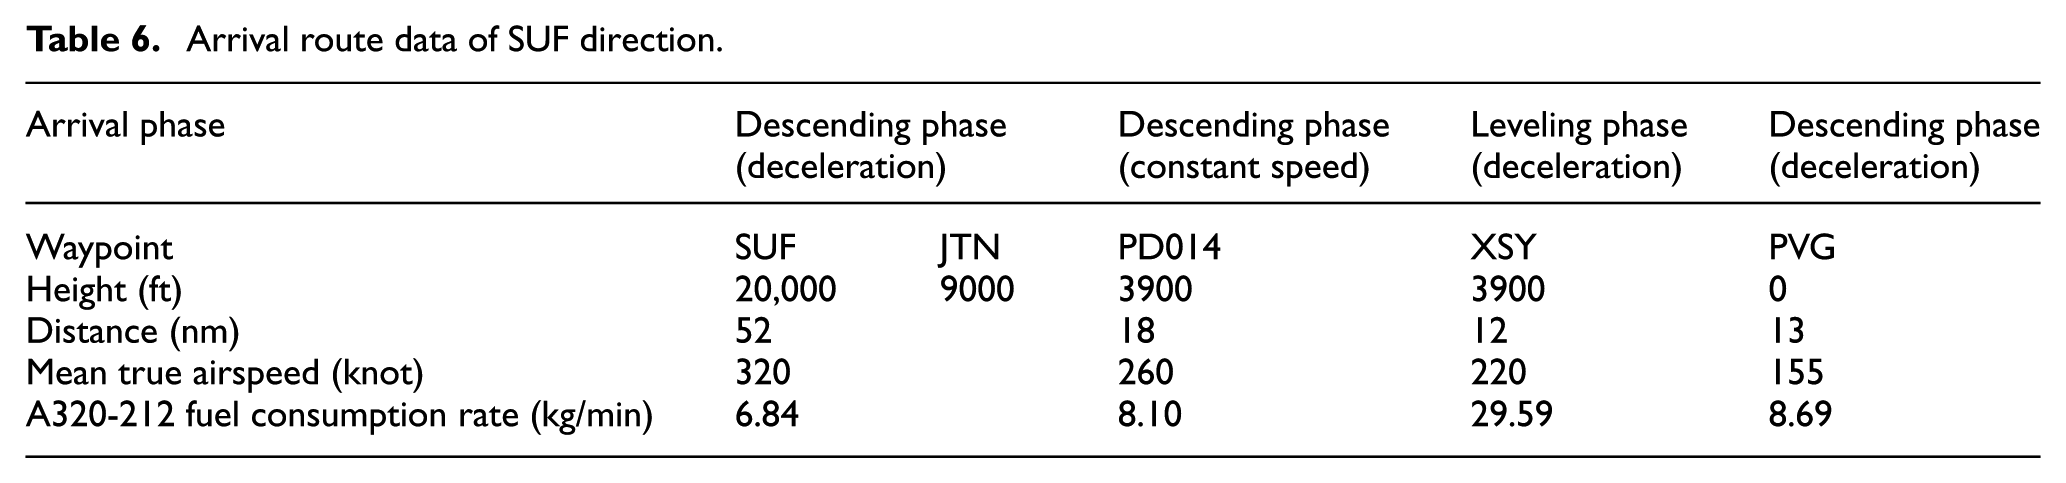
Arrival route of SUF direction
Table 6 shows the arrival route of SUF direction is SUF-JTN-PD014-XSY-PVG, and its fuel consumption rates in various phases.
Arrival route data of SUF direction.
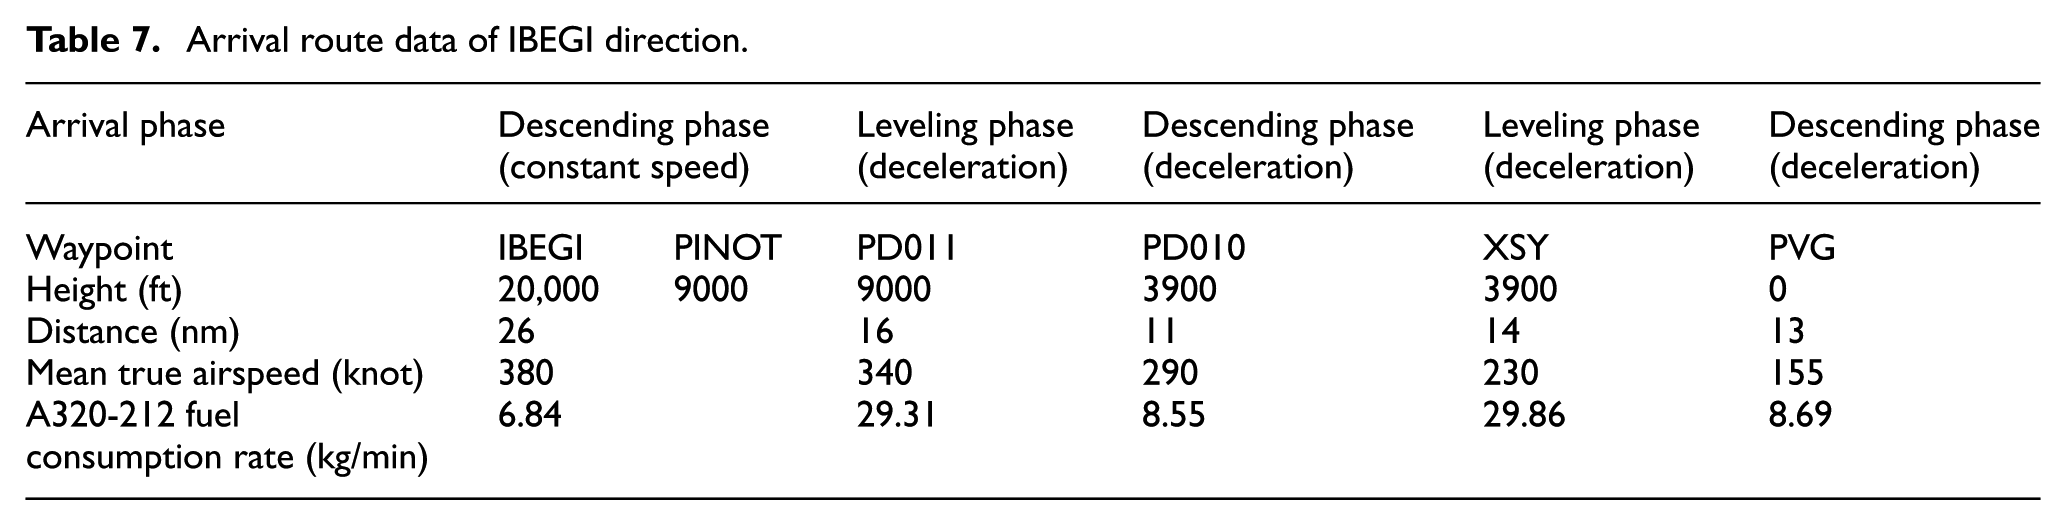
Arrival route of IBEGI direction
Table 7 shows the arrival route of IBEGI direction is IBEGI-PINOT-PD011-PD010-XSY-PVG, and its fuel consumption rates in various phases.
Arrival route data of IBEGI direction.
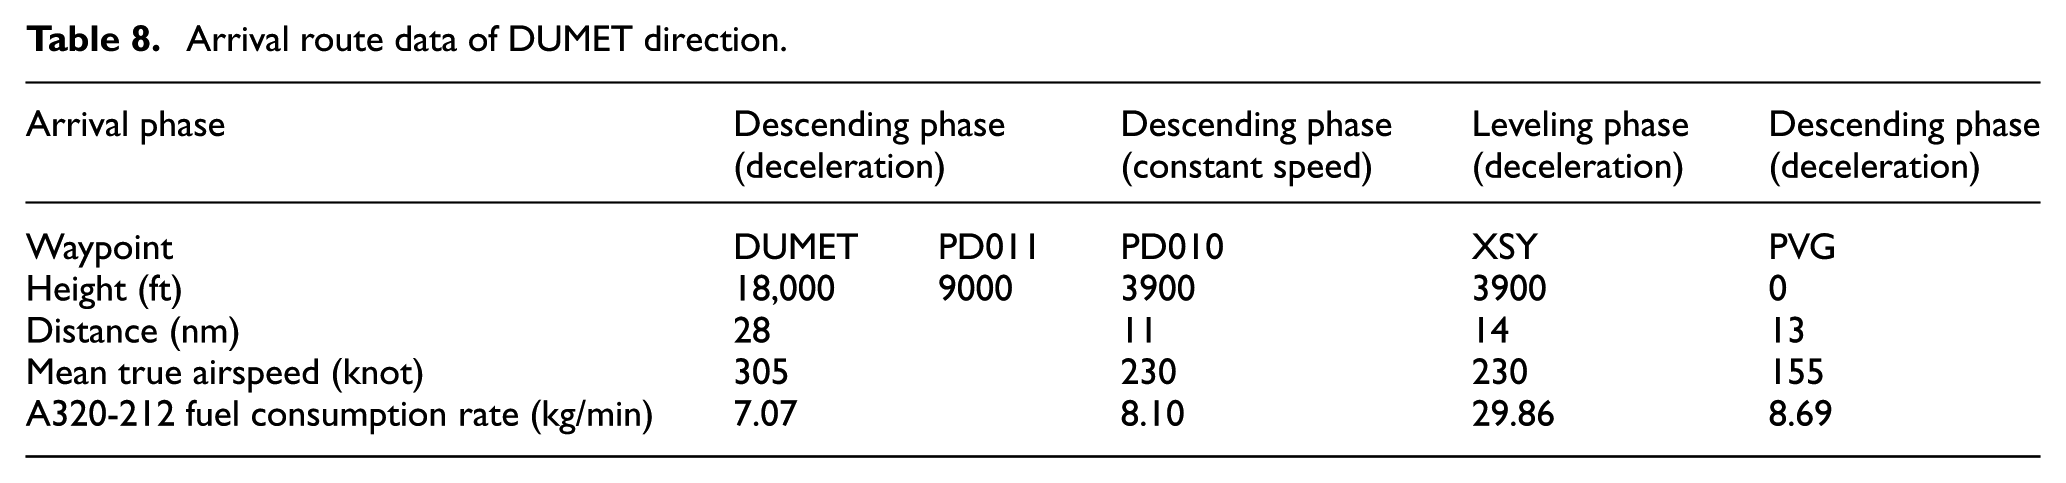
Arrival route of DUMET direction
Table 8 shows the arrival route of DUMET direction is DUMET-PD011-PD010-XSY-PVG, and its fuel consumption rates in various phases.
Arrival route data of DUMET direction.
Analysis of fuel consumption and delay costs of flights of different aircraft types on the same arrival route
Flights
Flight fuel consumption
Fuel consumption type was used to calculate fuel consumptions when flights

Fuel consumption of arrival flights of AND direction.
Figure 3 shows that for aircraft of the same type, the fuel consumption when the rerouting leg of the AND direction is executed is more than three times that of when the planned route is executed. When different aircraft types execute the same arrival route, it is obvious that the greater the fuel consumption rate of the aircraft in each arrival leg, the greater the fuel consumption rate when the aircraft executes planned route and rerouting leg.
Analysis of flight delay cost
Delay time cost
Flight delay time cost includes aircrew hourly cost
Unit time costs of different aircraft types (RMB/h).

The mean true airspeeds of eight aircraft models
The time

Flight delay time is
Delay fuel cost
The unit fuel cost
Overall delay cost
Overall delay cost of flight
Delay time costs and fuel costs of flights
Delay time and fuel cost of flights (RMB).

Through the analysis of overall delay costs of flights of different models on the same arrival route, the following conditions can be obtained:
The operating cost of flight delay is jointly decided by time and fuel costs. Table 11 shows that overall delay cost has a correlation with the performances of different types of aircraft: the more advanced the aircraft type the higher the overall delay cost. For example, compared with other types, A340-313 and B777-300 have higher time and fuel costs.
From time cost, the differences between different aircraft types in aircrew hourly cost, aircraft depreciation cost, and maintenance cost decide the differences in time cost. Time cost composition of the same aircraft type is decided mainly by fixed costs of the aircraft itself, such as maintenance cost and aircraft and engine depreciation cost, as shown in Table 10. The differences between different types in time cost are still decided by fixed costs, such as maintenance cost and depreciation cost.
Based on fuel cost, Table 5 shows that the same delay time exists in different aircraft types on the same route, and the differences in aircraft fuel consumption rate and number of engines decide differences in fuel cost. For example, for the fuel consumption rate of A340-313 with four engines is higher than that of any other aircraft type, hence, its fuel cost is higher. In addition, significant differences exist in fuel consumption rate and these differences also decide obvious differences in flight fuel consumption, because the aircraft are under the leveling state of different flight altitudes and hold state.
Comparison between arrival routes of AND direction in arrival time and fuel consumption.

Analysis of flight fuel costs of the same aircraft type on different arrival routes in the terminal area
Flights
Comparison between arrival routes of SUF direction in arrival time and fuel consumption.

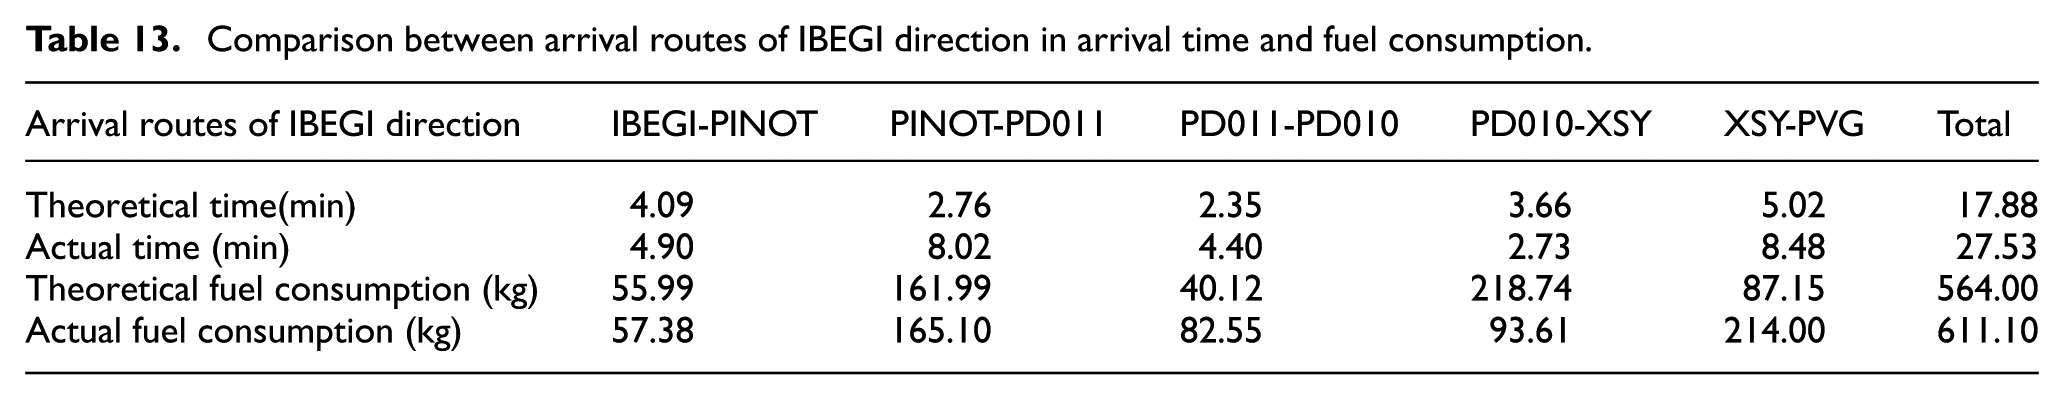
Comparison between arrival routes of IBEGI direction in arrival time and fuel consumption.
Comparison between arrival routes of DUMET direction in arrival time and fuel consumption.

By analyzing the fuel consumption rates of the same aircraft type on different arrival routes, the following conclusions can be drawn:
For arrival flights in the directions of AND, SUF, IBEGI, and DUMET, theoretical arrival times are, respectively, 80.1%, 97.8%, 65.0%, and 76.2% of their actual arrival times. Their theoretical fuel consumptions are, respectively, 95.4%, 89.8%, 92.3%, and 96.9% of their actual fuel consumptions, indicating that the theoretical flight delay prediction model established in this article conforms to actual operating data and can accurately reflect actual delay costs. However, because of the influence of subjective factors of weather conditions, pilots, and controller, as well as airport capacity limitation, both actual flight arrival time and fuel consumption are greater than theoretically calculated values.
Arrival routes are divided into several legs. Significant differences exist between actual values and theoretical arrival time and fuel consumption of the aircraft on the same leg. This may be attributed to the theoretical values obtained by assuming the mean true airspeed of the aircraft. Real-time variations also exist in the actual operating environment, namely, air speed and real-time scheduling strategies of true airspeed and flight status of the aircraft. Consequently, the theoretically calculated value of the aircraft on the same leg is different from the actual value.
Conclusion
The key factor affecting flight delay lies in the imbalance between demand and capacity, while severe weather causes a decrease of airspace and airport capacity, leading to an imbalance in capacity and flow. The occurrence of short-term severe weather in the terminal area lowers operating efficiency of the airspace system to a great extent. Moreover, rerouting and holding strategies implemented by the aircraft lead to increase in distance of the arrival route, extension of the flight arrival time, and increase in aircraft fuel consumption, resulting in excessive economic loss to the airlines. By establishing the BADA-based fuel consumption model and delay cost prediction model, an empirical verification of arrival flights in Shanghai terminal area was conducted in this article. Through this study, the following conclusions can be obtained.
BADA-based calculation model of aircraft fuel consumption was proposed. Most previous literature related to aircraft fuel consumption cost have analyzed and explored different influencing factors of flight delay costs by establishing statistical mathematical models as driven by historical data. However, fuel consumptions of different arrival legs and different models were analyzed based on the engine fuel consumption rate of the aircraft in this article to provide a basis for the accurate calculation of aircraft fuel consumption cost.
Moreover, time cost was classified considering that the operating cost of arrival flight not only includes fuel cost but also relevant aircraft operating time cost. Regarding the differences in flight reroute and hold, classified calculation was conducted in the calculation model of fuel cost to obtain overall flight delay cost.
Finally, the influences of different aircraft types and different arrival procedures on arrival time and fuel consumption were analyzed. A comparison between the theoretical calculation of operating cost of arrival flight delay and QAR actual operating data was conducted. The calculated data indicate the following:
Flight reroute and hold caused by short-term weather change will certainly increase overall flight operating cost to a great extent.
Flight fuel consumptions of different flights arriving from the same direction are slightly different, which is decided mainly by the difference between different aircraft types in time cost and is related to fuel cost and fuel consumption rates of the model in various arrival phases.
Through a comparative analysis on the actual fuel consumption of arrival flights, the fuel consumption model proposed in this article is known to calculate the fuel consumption of arrival flights in accordance with practical flight operation.
As discussed in this article, arrival procedures in the terminal area executed by the aircraft are influenced by multiple factors. For example, reroute strategy executed by the pilot, randomness of maneuvering flight, uncertainty of weather conditions in the terminal area, subjectivity of controlling commands, and other factors will affect arrival time and fuel consumption. Therefore, further studies should concentrate on analyzing the influences of weather conditions in the terminal area and human factors (controller and pilot), as well as reroute strategy under dynamically predicted short-term weather information on flight delay.
Footnotes
Acknowledgements
The authors appreciate important and worthy comments by the anonymous referees.
Handling Editor: Fakher Chaari
Declaration of conflicting interests
The author(s) declared no potential conflicts of interest with respect to the research, authorship, and/or publication of this article.
Funding
The author(s) disclosed receipt of the following financial support for the research, authorship, and/or publication of this article: This study was supported by the National Science Foundation of China (Nos U1633119 and U1233101) and the Fundamental Research Funds for the Central Universities (No. NS2016062).