
Abstract
Prediction accuracy is a key problem in estimating the fatigue resistance of engineering structures. Here, we consider mechanical structures with fasteners that are simultaneously subjected to a combination of shear and tension (or compression) loads. The currently used detail fatigue rating method is modified and an extended detail fatigue rating method is proposed to improve the estimation results. This is achieved by considering the effect of the load, stress concentration, and fatigue failure criterion on the fatigue capacity. An experimental assessment is also made of many specimens with different structures. A comparison of the estimation results obtained using the extended detail fatigue rating method and the experimental results shows that the new method gives results that are acceptable in engineering practice.
Keywords
Introduction
Nowadays, the study of fatigue in different materials, 1 and especially metals, 2 has reached a certain state of maturity. Problems actively being researched include the fatigue capacities of materials, methods of analysis, and the mechanisms responsible for fatigue in materials subject to uniaxial fatigue loads. Problems involving multiaxial fatigue have also been investigated by many researchers.3–5 Because of the practical need and application value, establishing appropriate fatigue theories for various kinds of engineering structures is a particular area of focus in fatigue research.6,7 Considering the critical influence of load on structural fatigue, many different kinds of specialized fatigue-design methods have been put forward for specific types of environmental and working loads that can provide the fatigue capacities of the materials or structures independently of the load, in order to facilitate practical application.
In the 1980s, a simple and practical method of durability analysis based on the S-N approach, the so-called detail fatigue rating (DFR) method, was first introduced in civil aircraft design by Boeing to analyze the fatigue damage and assess fatigue quality.8,9 Since then, it has been widely used in the structural design of aircraft for its convenience and simplicity.10–12 The method can yield reasonable results, especially for structures subject to tension loading. Many studies have been subsequently performed on the DFR method to modify it so that it can be applied in other situations.13,14
In civil aircraft engineering, a large number of mechanical structures with fasteners are encountered, which are subjected to a combination of shear and tension (or compression) loads simultaneously. Here, we simply refer to this situation as “shear loading” in order to distinguish it from the case where the subject is under tension or compression loading only. The common practice, at present, is still to use the current DFR method to calculate DFR values for cases under shear loading, which is the same treatment used in cases under tension loading alone. Unfortunately, however, this is a risky approach to take in engineering practice. Therefore, the objective of this investigation is to provide an extended DFR method, appropriate for connection structures subject to shear loading. The method is based on an understanding of the influence of load, stress concentration, and fatigue failure criteria. We consider each of these issues in turn.
Load
The significant difference between problems involving fatigue rather than static strength is that the assessment of fatigue in engineering structures has to take into account the type of load, load distribution, geometrical size of the structure, and microdefects arising during processing and under working conditions, all based on the appropriate research carried out on the static mechanical and fatigue behavior of the materials used.
In general, the main factors affecting the fatigue life of a structure can be divided into three categories according to the fatigue mechanism involved: 15 (1) factors affecting the local stress and strain, for example, the load characteristics (stress state, cyclic behavior, and residual stress); (2) factors affecting the microstructure of the material, for example, the structural material, and heat and mechanical treatment applied; and (3) factors affecting the sources of fatigue damage, for example, surface roughness, corrosion, and stress corrosion.
As far as load type is concerned, fatigue damage rules are given for the cases of tension, bending, torsion, or shear loads as different types of loads will have different effects on the fatigue behavior of the various structures and materials. Depending on the magnitude of the load, the fatigue damage rules of low and high fatigue cycles have been studied. Also, by applying several loads to structures simultaneously, the fatigue laws for uniaxial and multiaxial, and proportional and nonproportional loadings have been investigated. As far as transmission and distribution of the load in the structure is concerned, the maximum stress and stress concentration factor (SCF) have been studied using the stress severity factor (SSF) method. 15
The effect of structural size is assessed within the theoretical framework of the DFR method by determining the values of certain coefficients using the relevant design handbook. 9 The effect of microdefects (which may occur during processing and working) is further accounted for via fatigue life probabilities and several coefficients. These two facets of the DFR method reflect its convenience and simplicity. The influence of load type and distribution on fatigue capacity must be clarified because it will obviously be different in the present problem compared to the problem of tension loading. This is the first problem addressed in this article.
When using the existing DFR method to assess the fatigue quality of mechanical structures with fasteners that are subjected to tension loading alone, acceptable results may be obtained for the stress states at critical positions (i.e. where fatigue damage is most likely to occur first) as this can be viewed as a simple example of a unidirectional stress state. For structures simultaneously subjected to a combination of shear and tension (or compression) loads, noticeably different stress states should be found at critical positions (compared to the tension loading only case). The different effects on the load distribution relationship of the pin loads, stress concentrations, and structure fatigue quality need to be comprehensively analyzed. In this article, the influence of load type on fatigue capacity is assessed using the stress states at the critical positions.
Stress concentration
Stress concentration is an essential phenomenon to study to interpret fatigue and expose its mechanism. Several models (average stress model, fracture mechanics model, and stress field intensity model) have been obtained by considering the obvious differences in the stress concentration in a notch subject to fatigue and static loads, which establishes the relationship between these two cases.
Stress concentration factors are directly used to simplify the analysis in the theoretical framework of the existing DFR method. For structures simultaneously subjected to shear and tension (or compression) loads, the stress concentration factors will obviously be different from those in the tension-only case. Thus, the existing DFR method cannot be used directly. Furthermore, the stress concentration factors need to be reassessed for the case of shear and tension loading. There are two problems that need to be solved. The first is to find the dominant mechanical parameter among the various stress components and mechanical parameters. The other is how one should determine its value and obtain the stress concentration factor.
Fatigue failure criteria
Finding a criterion to gauge failure is another essential problem. Generally, one or a group of mechanical parameters, with (or without) explicit physical meaning(s), are individually or collectively used to characterize the behavior of the mechanical fatigue and form the failure criterion. Damage occurs when the value of the parameter falls outside a certain range in the material or structure. As one of the most complex failure phenomena closely related to engineering practice, fatigue (especially fatigue of structures) needs a suitable failure criterion to expose its mechanism correctly. Criteria for fatigue failure can be divided into three categories according to the material’s fatigue damage parameters: stress criteria, strain criteria, and energy criteria.
Several stress and strain criteria were established some time ago using the related static strength theories, including the maximum normal stress criterion, Tresca stress criterion, and von Mises stress criterion. As research has progressed, many more criteria have been proposed to improve the feasibility and precision of the theoretical predictions. This is especially the case for multiaxial fatigue and for all kinds of engineering structures. Notable works include those of Socie, 16 Fatemi and Socie, 17 McDiarmid, 18 and others.
In the existing DFR method, when the stress at a particular reference position is larger than its DFR value, it means that the structural fatigue life is less than the critical value of 105. For structures under shear and tension loading, this failure criterion needs to be modified according to the dominant mechanical parameter.
The DFR method
DFR is an inherent characteristic related to the fatigue capacity of a structure and is independent of the applied fatigue load. Its value represents the maximum nominal stress (σmax) that the structure can withstand when it is subjected to constant-amplitude fatigue loading with an asymmetry of R = 0.06 (where R is the ratio of the minimum nominal stress to the maximum nominal stress, namely R = σmin/σmax). As such, it corresponds to a fatigue life of 105 cycles based on a reliability level of 95% and a 95% confidence level for a particular structural fatigue detail. More generally, it can be expressed using an upper limit, DFRcutoff, and a lower limit, DFR0.
Benchmark values, DFRbase, for the basic structural details can be obtained by carrying out tests on standard specimens. Then, according to the DFRbase values of the standard structure and the differences between the structure to be analyzed and the standard structure considered, the DFR0 value of the structure can be calculated (based on the alterations made, for example, the filling condition of the hole, surface treatment of the structure, processing of the material stack, and condition of the bolt clamp). The DFR of the structure is related to the number of “dangerous” details in the structure. As the number of dangerous details increases, the DFR value of the structure becomes closer to DFR0. This can be expressed in terms of the structural fatigue rating factor, Rc.
Several basic assumptions are employed in the DFR method, as follows:
1. The fatigue life, N, follows a two-parameter Weibull distribution

where α is a material constant that can be regarded as a known parameter (e.g. α = 4.0 for aluminum alloy)9,11,13 and β is the characteristic life.13,14
2. The mean stress, σm, is constant. There is an approximately linear relationship between lg σa and lg N when N is in the range 103–106, that is

where σa is the stress amplitude. Thus


The slope of the logarithmic S–N curve is given by B, which is a material constant, and S = 10−1/B. For aluminum alloy, S = 2.0,9–11 so that B = –3.32.
3. The constant-life fatigue curves are all linear, and they intersect the horizontal coordinate line at a point whose longitudinal coordinate value is σm0, which is a material constant. For aluminum alloy, σm0 = 310 MPa.9,12,13
4. Fatigue damage accumulates according to Miner’s rule.
For aluminum alloy subjected to constant-amplitude fatigue loading with an asymmetry of R = 0.06, the stress amplitude and mean stress are given by σa = 0.47 DFR and σm = 0.53 DFR. Considering DFR = σmax when N = 105, R = 0.06, with a 95% reliability level and a 95% confidence level. For aluminum alloy, equation (2) can be rewritten as

where N95/95 is the characteristic fatigue life at the 95% reliability level associated with a single-sided confidence level of 95% of the scale parameter of the fatigue life distribution.
Finally, considering the slope of the equation for the S–N curve, S = 10−1/B, define the parameter X by X = S(5 – lg N). Therefore, based on equation (5), the DFR of a structural detail can be expressed as

To predict the fatigue capability of a structure based on the DFR method, the value of the DFR of a structural detail can be calculated according to

where A, B, C, D, E, and U are all different kinds of coefficients for structural details whose values can be found in design handbooks. 9 Furthermore

where K is a material parameter (equal to 1 for aluminum alloy) and
In the DFR method, the uncertainty in the fatigue damage assessment mainly results from the estimation of the characteristic fatigue life and the processing methods used on the experimental data. The influence on the structure details is mainly reflected in the related alteration factors, which can be determined by querying the appropriate design manual. When applying the DFR method to design a structure or predict its fatigue performance, a very important problem is the stress concentration, which has a direct and prominent effect. This issue needs to be resolved before calculating the DFR value and predicting the position where fatigue failure will occur.
Extending the DFR method to shear connected structures
It is found in practice that applying the DFR method to mechanical structures with fasteners that are simultaneously subjected to a combination of shear and tension (or compression) loads (“shear loading”) may result in dangerous predictions. This is because the DFR values have been calculated according to conventional DFR procedures that are appropriate to tension loads. In other words, the conventional DFR method needs to be extended if it is to be used to reliably assess the fatigue performance of mechanical structures with fasteners that are subject to shear loading. A way of achieving this is proposed here.
In what follows, a particular example of a fastener subject to shear loading is first considered to introduce the extended DFR method. The mechanical structure employed (a typical connection structure with m rows and n columns of rivets) is used to connect a frame with a web in the same technological mode. Then, an application is made to assess the fatigue performance of an actual engineering structure. A comparison is also made of the results obtained using the proposed extended DFR method, conventional DFR method, and some experiments.
For the structure and loading regime considered, the loading is complex in comparison with pure tension and compression loads. This has a serious impact on the fatigue failure that occurs. First of all, the distribution of the pin loads induced by the tensile load applied to the frame and the balance relationships in the entire fastener region will be significantly changed. Second, the stress state at the critical position (where the fatigue failure will emerge when the structure is under shear loading) is much more complex compared to the simple tension case. Thus, the problem cannot be treated as a uniaxial stress state as it would be in the conventional DFR method for structures connected under tension. On the one hand, the method of fatigue assessment for structures subject to shear loading is quite different from that of the same structure under tension due to the significant differences in their loading. On the other hand, the method of fatigue assessment required for a structure subject to shear loading can be based on the method used for the structure under tension because of the identical nature of the structure.
In light of this, we propose our extended DFR method. Its main features are illustrated using the flowchart in Figure 1. First, the new load distribution induced by the tension P is obtained for the loads on the pins using the relevant principles found in the conventional DFR method and considering the difference in the loads and equilibrium between the present loading case and tension case. Second, as the stress states in the critical positions near the pin holes on the web are much more complex, further calculations are made and the situation is investigated. Finally, the stress states in the critical positions and stress concentration factors of the structure are used to determine the DFR value.
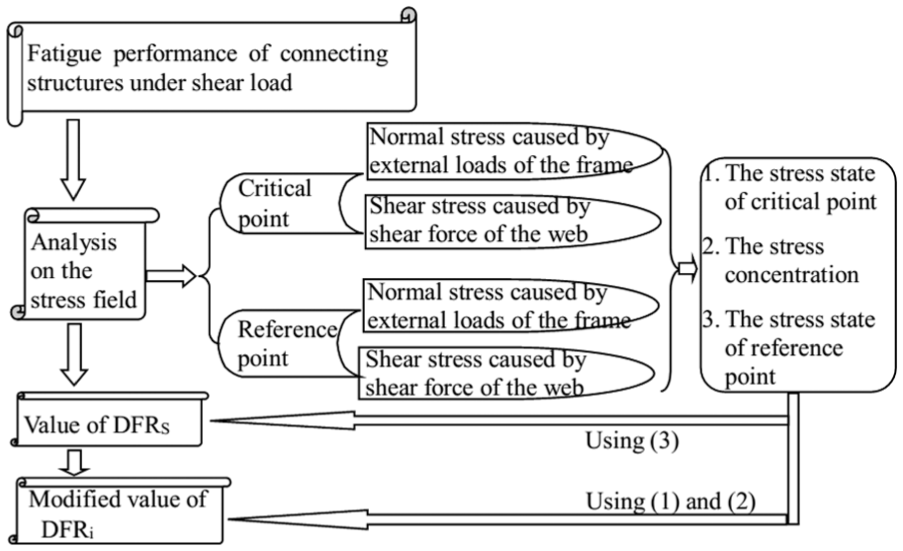
Flowchart for the extended detail fatigue rating method.
A typical (local) connection structure is shown in Figure 2(a). The structure is subject to shear loading as a part of a larger structure with a compressive load on the frame and two hinged fulcrums positioned at the side ends of the web. When the frame is loaded with a tension P on the top side, the web of the fastener in Figure 2(a) is loaded by two web shear flows, kP and (k – 1)P, on its left and right sides, respectively. For the sake of simplicity, a linear relationship is used to calculate the stress components, stress concentration factor, and accumulation of damage.

Sketch illustrating the principle of superposition used in the analysis: (a) the force diagram of the local connecting structure in a structure subjected to complex loads, (b) the simplified force diagram of the local connection structure when analyzing the fatigue capacity of the zone near to the right pin hole in the web, (c) the simplified force diagram of the local connection structure when analyzing the fatigue capacity of the zone near to the left pin hole in the web.
The case shown in Figure 2(a) can be decomposed into two cases, shown in Figure 2(b) and (c), according to the principle of superposition. The case shown in Figure 2(b) corresponds to a local connection structure with a compressive load on the frame and a hinged fulcrum positioned on the left end side of the web. Similarly, the case shown in Figure 2(c) corresponds to a local connection structure with a tensile load on the frame and a hinged fulcrum positioned on the right end side of the web. In many cases, the connection structures are not the main load-bearing components and the fatigue capacity mainly depends on the in-plane mechanical behavior caused by in-plane forces (i.e. it essentially has nothing to do with bending forces, warping forces, and so on). Therefore, in Figure 2(b) and (c), the problem of static equilibrium can be neglected and only these two or three forces should be taken into account in the analysis. Our attention is focused on the area near the pin holes in the web where fatigue cracking is most likely to emerge.
Load distribution among the rivets
A structure subject to shear loading has quite different balance relationships in the rivet zone compared to that under tension. In the former case, the pin load in a particular rivet zone is balanced and cannot be transmitted to a neighboring rivet zone in the form of a web bypass load, that is

That is to say, the bypass load is zero in every rivet zone. Therefore, according to the principle of deformation compatibility, the load distribution among the rivets can be obtained as follows.
1. Single shear connection

2. Double shear connection

in which
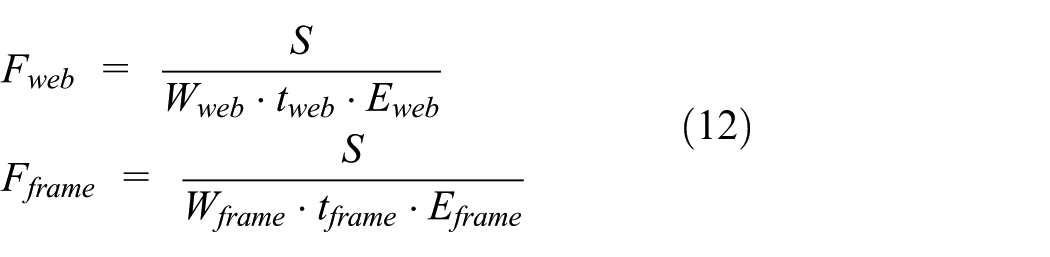
In these expressions, Ri is the total pin load of the rivets in the ith (1 ≤ i ≤ n) column of the frame, Pfastener is the real load of the rivets in the ith column, and P is the compressive load on the top of the frame. The quantities Cfastener, Fweb, and Fframe denote the flexibilities of the fastener, web, and frame, respectively. For different cases, Cfastener can be calculated using the relevant expressions listed in the appropriate handbook. 9
It should also be noted that the pin load will be altered when there is a reinforced plate in the structure. In the absence of a reinforced plate, the estimated load of the rivet is

where k is the load coefficient and m is the number of rows of rivets, so that m = 2 for the structure shown in Figure 2(b). If a reinforced plate is used, the estimated load of the rivet is

where tweb and treinforce refer to the thickness of the web and reinforced plate, respectively.
Stress concentration in the region of the rivet holes
As it is difficult to obtain analytical solutions for the stress field in the structure, an expression is provided by which stress can be calculated (derived using a simple and convenient method of estimation based on elasticity theory).
In the structure shown in Figure 2(b), fatigue failure is most likely to occur in the regions near the top of the frame, where the compressive load is applied, and on the left side of the web, where the web shear flow is applied. Attention is therefore focused on these two positions. Thus, we consider the critical position on the rivet hole and reference position near to the rivet hole shown in Figure 3. Parameters corresponding to these two positions are denoted using appropriate subscripts (“crit” for the critical position and “ref” for the reference position).

Simplified schematic diagram of the stress distribution in the rivet zone.
In Figure 3, the solid circle represents the position of the rivet hole and the dotted lines delineate its action zone. The pin load on the rivet hole causes extrusion stress in the horizontal section and the web shear flow (applied to the left side) leads to shear stress in the rivet zone. The site that is most prone to fatigue damage is the rivet zone in the first column (near to the position where the compressive load is applied) and on the left (near to the location where the web shear flow is applied). Thus, according to the SSF approach, 15 the critical position is chosen to be the point shown in Figure 3. The reference position is chosen to be the point where the magnitudes of the applied stresses have the average values of those applied to the rivet zone.
The normal stress at the critical position (σcrit) can therefore be obtained by considering equation (9) and using the SSF method

where Ktb is the stress concentration factor of the tension load, d is the diameter of the fastener, and θ represents the distribution factor of the normal stress. Due to the negligible effect of the stress concentration at the reference point, the homogenization method is adopted for the sake of simplicity. In the action area of the rivet hole, the normal stress is distributed linearly from its maximum value to zero along the direction of application of the tension P. It remains unchanged in the width direction. Thus, one has

where σref is the normal stress at the reference point and W is the width of the action area of the rivet hole.
The magnitude of the shear stress at the critical position (τcrit) is Kτ times that of the average shear stress at the reference position (τref), that is

in which Kτ is the stress concentration factor of the shear load and S is the length of the action area of the rivet hole. Due to the weak effect of stress concentration on the shear load, the shear stress at the reference position can be calculated using

The mechanical behavior of a structure, including fatigue failure, can be described using one or more mechanical quantities. That is to say, in the structure currently being considered there exists one or more dominant mechanical quantities that need to be determined. In mechanical structures with fasteners, fatigue failure first occurs somewhere near the fastener hole in the web. When using the DFR method to analyze the fatigue capability of a connection structure under tension, the stress state is simple and can be regarded as being unidirectional. Therefore, in this case, the relative normal stress is the controlled mechanical quantity. The normal stress at the critical position reaches its critical value for this structure with a fatigue life of 105 cycles and an asymmetry of R = 0.06. In the DFR approach, the controlled mechanical quantity at a reference position far away from the critical position (i.e. DFRbase) can be calculated by considering the critical value at the critical position and converting using the stress concentration factor. Thus, the DFR can be obtained by considering the effect of the details in the structure and then used as the fatigue performance indicator for this structure.
Consider the structure shown in Figure 2(b). Following the conventional DFR method, one mechanical parameter needs to be chosen as the controlled mechanical quantity to facilitate engineering application. This raises an important question: Which parameter should be chosen as the controlled mechanical quantity with respect to fatigue behavior? Different options can be accepted depending on the actual engineering application. Examples include the maximum tensile stress, Tresca stress, and von-Mises stress. These measures have been used in many simple cases and can be represented using the expressions


Substituting equations (14)–(17) into the above relations yields the controlled mechanical quantities σcrit-i and σref-i at the critical and reference positions, respectively (here, subscript “i” denotes that mechanical quantity of type i is used). The stress concentration factor Kcrit-i can thus be estimated using the expression

Extended DFR
Based on the calculated values of the normal and shear stresses, their ratio (former : latter) is used to determine which one is dominant (or if both are similar) with respect to the fatigue behavior of the connection structure. Therefore, three cases arise according to the stress state at the critical position.
Case 1: normal stress prevails over shear stress at the critical position
In this case, the magnitude of the normal stress is much larger than that of the shear stress at the critical position of the rivet hole in the web. The extended DFR value, DFR i , can be determined according to the standard procedures and formulae used in the DFR method, irrespective of whether the shear stress is dominant in other areas of the web or not. Thus

where DFRS is the DFR of the shear connection structure calculated using the conventional DFR method.
Case 2: both normal and shear stresses are of similar importance at the critical position
In this case, the normal stress is of the same order of magnitude as the shear stress, so that they both affect the fatigue capacity of the structure. The extended DFR value, DFR i , can therefore be determined by taking into account the influence of the stress concentration factor Kcrit-i, so that

Case 3: shear stress prevails over normal stress at the critical position
In this case, the extended DFR value can be determined using the conventional DFR method for the case of fasteners without transmitted load.
Fatigue damage
For a structure comprising several frames, there will be several local connection structures in which one frame is riveted to a web. We need to determine which of these local connection structures is the most “dangerous,” in the sense that it is the one in which fatigue damage is most likely to take place. This can be done by calculating the ratio of the extended DFR value, DFR
i
, to the controlled mechanical quantity σref-i. That is, we calculate
Using the extended DFR method, the same extended DFR value, DFR i , can be obtained for the structures shown in Figure 2(b) and (c) once the controlled mechanical quantity has been determined. In other words, the fatigue capacity of the structure shown in Figure 2(a) can be determined by analyzing just Figure 2(b) or (c) if the extended DFR method is used.
Numerical results and discussion
In this section, a comparison is made of the results obtained experimentally and numerically. Measurements were made using an MTS 810 testing system and specimens made from aluminum alloy (consisting of web riveted to frames, reinforced plate, etc.). The fatigue tests were conducted at room temperature and normal atmospheric humidity.
Depending on the characteristics of the loads used (e.g. their asymmetry and/or eccentricity) and the bounds and structural details of the specimen tested, some phenomena may occur during the fatigue experiment that one would rather avoid (e.g. warping and bending). When designing the specimens used, therefore, edge strips were used to weaken the impact of any bending induced by bending moments. In addition, front and rear baffles were adopted to minimize (as much as possible) the impact of any out-of-plane warping induced by eccentricity in the loading.
A diagram showing the structure of the first specimen used (“type-I”) is shown in Figure 4. In this diagram, the green parts correspond to the frame, the red/brown parts an enhanced plate, the yellow parts (including the area under the enhanced plate) the web, and the blue parts at the top and bottom of the structure the edge strip. All these parts are made of aluminum alloy. The web is a thin plate (1.2 mm) measuring 240 mm (width) by 460 mm (length). The enhanced plate is also a thin plate (2 mm) measuring 240 mm (width) by 255 mm (length). The edge strips, the web, the enhanced plate, and the frames are connected using high locked bolts at the top and bottom of the specimen—all the other connections were made using rivets. The five frames shown in Figure 4 are labeled 1–5 from left to right.

Structure of the type I specimen.
Compressive loads were simultaneously applied to the top sides of frames 2 and 4. A photograph of the experimental setup is shown in Figure 5. The left and right sides of the specimen are bounded by simply supported structures at the bottom of frames 1 and 5. In consideration of safety, a double-shear structure was used for the local connection structures on the left and right that connect to frames 1 and 5. In other words, two frames are symmetrically arranged on the front and back sides of the plate (web or enhanced plate) in each local connection structure. The local connection structure of frame 2 is the focus of our attention because of its similarity to the connection structure shown in Figure 2(b).

Photograph of the experimental setup.
For this particular structure, 12 specimens were manufactured and tested under stress of constant amplitude (R = 0.06). The experimental results are given in Table 1. For specimen No. 6, damage did not occur even though the specimen was subjected to a fairly long set of loading cycles. Thus, these test results cannot be used to assess the fatigue capacity of this structure (hence the damage label “failed” is recorded in the table). Apart from specimen No. 6, all the other test results were useful. In five of the specimens, fatigue damage was found to be located near to the rivet hole. This indicates that the design of the structure has been successful as the experiment has exposed the essence of the structure’s fatigue performance. Thus, in Table 1, the word “valid” is used to denote the test data corresponding to these five specimens. Typical failure phenomenon was observed in the webs of the valid specimens (i.e. fatigue cracks occurred near their rivet regions). The damage label “invalid” is used to denote the other six specimens tested.
The test results obtained using the different specimens.

Based on the test results listed in Table 1, the DFR value is 118 MPa (according to the method specified in the DFR approach for processing experimental data).
If the conventional DFR method were to be used to predict the DFR value, then different DFR values will be obtained for different reference positions. For example, if the left side point in the typical local structure shown in Figure 2(a) is chosen as the reference position, then DFR = 154 MPa. Alternatively, if the right side point is used as the reference position, then DFR = 113 MPa. Further still, if one chooses the difference in the shear stresses at these two side points as the reference shear stress, then DFR = 137 MPa. This indicates that the DFR value depends on the value of the reference stress if the conventional DFR method is employed. Therefore, it is not acceptable to directly apply this method to connection structures subjected to shear loads.
If the extended DFR method proposed is used instead, estimation and assessment steps need to be performed on the local connection structure corresponding to frame 2 of Figure 4 or 5.
First, attention is focused on the location of the rivet in the first column and leftmost row where damage is most likely to occur (as this location is nearer to the tensile load and web shear flow). As there are fasteners arranged in two columns and 10 rows, we have m = 2 and n = 10. The rivet-hole region, which is prone to fatigue damage, corresponds to i = 3 and its pin load can be obtained using equations (10) and (12). One thus obtains

In these calculations, we need

Next, the stress concentration factor can be estimated by inserting these expressions into equation (22), which results in
Second, the stress at the reference position, σref-1, is now regarded as the reference stress. The DFR value obtained is
Third, it is now clear that the order of magnitude of the normal stress at the critical position is the same as that of the shear stress. Thus, both the normal and shear stresses have dominant roles. According to the present extended DFR method, the DFR value can now be obtained by considering the influence of the stress concentration, Kcrit-i. Thus, we find
The result predicted using the extended DFR method is smaller than the experimental result, which shows that the safety requirements are satisfied. The difference between these two results is about 12.5%, which is an acceptable deviation in engineering practice.
The extended DFR method was further used to perform analyses of the four other local connection structures associated with the four other frames. The resulting estimations are listed in Table 2. The table reveals that the value of the ratio
Calculation results when the frame is subjected to a tensile load P.

DFR: detail fatigue rating; N: Newton.
If the focus were to be placed on one of the other rivet hole areas in the same local connection structure (i.e. that related to frame 2 in this article), then the same DFR value can be obtained. Furthermore, the estimated value of the stress concentration factor and DFR value are constant for the same structure subjected to different reference stresses or loads (also coincident with engineering practice). The pin load on the rivet in the first column is greater than that on the others. This is in agreement with the experimental observation that fatigue damage most frequently occurs in the rivet hole area near the first column and the left row. All these observations and results show the rationality of the extended DFR method proposed.
Fatigue tests were also carried out on another structure (type-II, see Figure 6). As before, 12 specimens were made and tested. Among the different specimens, three experienced fatigue damage near to the rivet hole after testing. The newly proposed extended DFR method yielded the estimate DFR1 = 105.1 MPa, which agrees well with the experimental result of 113 MPa. The middle frame/web local connection structure was the most vulnerable part of this structure under the loads used. This observation can be explained quite nicely using the proposed method (i.e. by considering the ratio of the extended DFR value, DFR i , to the controlled mechanical quantity σref-i.).
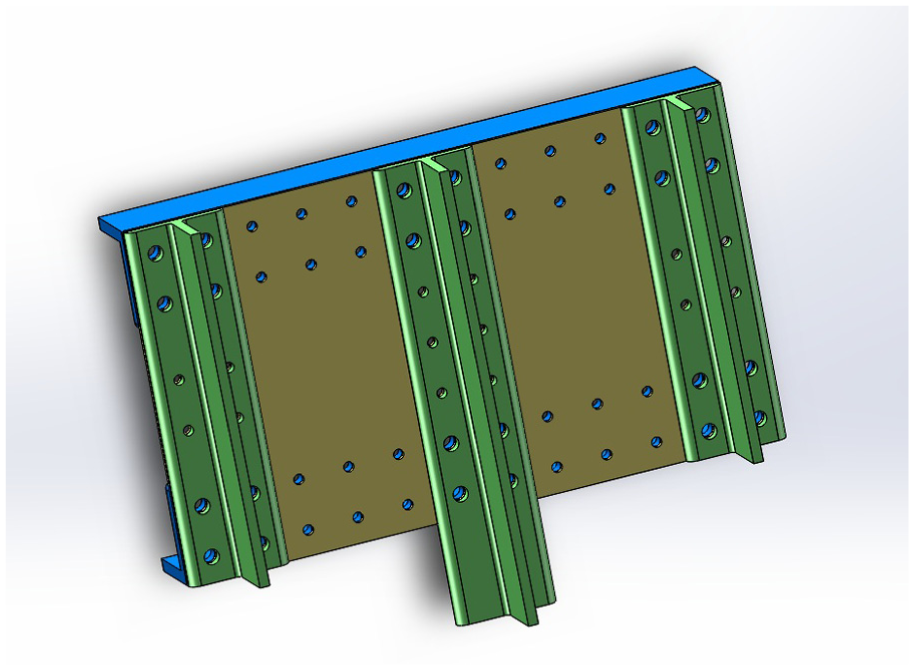
Structure of the type II specimen.
Conclusion
When designing fastening structures, the conventional DFR method is widely used for structures under tension or compression and good results are obtained. However, for structures subjected to shear loading, the method produces incorrect results, especially if the structure is complex. Staying within the theoretical framework of the DFR method, modifications can be made to extend the method so that it can give satisfactory results for structures subject to shear loading. That was the aim of the work presented here.
Using the extended method, comparisons were made with experimental data obtained using typical fastening structures subjected to shear loading. The most significant merit of the new extended DFR method is that it can give satisfactory explanations for the following two phenomena: (1) fatigue cracks mainly occur in the region where frame 2 connects to the web and (2) the left rivet-hole area of the first column is the place where fatigue damage is most likely to take place in the web.
The extended method can also give reasonable DFR results that characterize the essential features of the structural fatigue. In other words, using the extended DFR method yields results that are the same for the same structure and are independent of the values of the loads applied. Based on our comparisons of the results obtained using the extended DFR method, conventional DFR method, and experiments, one may conclude that the proposed extended DFR method can yield acceptable results. Thus, it can be used to more accurately assess the fatigue damage likely to occur in fastening structures.
Footnotes
Appendix 1
Handling Editor: Jianqiao Ye
Declaration of conflicting interests
The author(s) declared no potential conflicts of interest with respect to the research, authorship, and/or publication of this article.
Funding
The author(s) disclosed receipt of the following financial support for the research, authorship, and/or publication of this article: L.D. acknowledges the support from National Natural Science Foundation of China (NSFC, No. 11372269). X.F. acknowledges the support from the National Basic Research Program of China (Grant No. 2015CB3 51900), NSFC (Nos. 11222220, 11320101001, 11090331, and 11227801), and Tsinghua University Initiative Scientific Research Program.