
Abstract
Hydroelasticity is a phenomenon which occurs during the interaction between water and a deformable structure. Predicting the structural deformation and stress during water entry is a highly challenging endeavor and suitable computer-aided design tools are currently being developed and validated. This article discusses a hydrodynamic problem of the water impact on the stiffened side of elastic stiffened plates; the problem is addressed via an experimental approach and by explicit finite element method with a Multi-Material Arbitrary Lagrangian–Eulerian solver. A series of water entry tests were conducted to measure the impact pressure and effective stress on the stiffened panel at different drop heights. Convergence studies were conducted to run the numerical analysis; the results are consistent with the experimental data. Influences of drop height, stiffeners, and air cushion on pressure and effective stresses are discussed. Impact pressure and effective stress increase linearly with drop height. Stiffeners with different dimensions and directions appear to exert various effects on the maximum value, duration, and starting time of pressure and stress. The air cushion primarily increases the pressure duration and reduces its maximum value, and its property is discussed in detail.
Introduction
The water impact on various structures has garnered a great deal of research attention over recent decades. As a complex transient process, such impact can be considered a three-phase coupling model encompassing solid, liquid, and gas. 1 This phenomenon is common in the natural environment and across countless engineering applications.
The water impact problem of a rigid wedge was studied in detail starting from the 1930s of the last century, which was motivated by design of hydroplane landing on water. Von Karman 2 first carried out an analytical study on water entry problem by potential theory. Considering the deformation of water surface, Wagner 3 extended this model. In the following several decades, more complex models of water impact were developed based on Wagner’s theory4–6 and some new methods were also proposed.7–9
Structural shapes served as an important topic in the extant research on water impact. Many researchers have explored the water impact on wedges,10,11 spheres,12,13 cones,13,14 cylinders,15,16 plates,1,17,18 and even segmented ships.19,20 Water impact on the stiffened side of a panel was the focus of the present study. This phenomenon exists in engineering practices, for example, as extreme sloshing loads on the bulkhead of self-supporting prismatic B-type (SPB) liquefied natural gas (LNG) carrier tanks21,22 and extreme wave impacts on the bottom sides of stiffened offshore structures. 23 Pure numerical modeling of three-dimensional coupled hydro-structure interactions during sloshing and wave impacts is highly challenging when considering all the influencing factors such as hydroelasticity and air cushion. Some researchers simplified these problems as the water entry of structures. For example, Khabakhpasheva et al. 24 solved the water entry problem of a corrugated elastic panel via Wagner approach to simulate the extreme sloshing loading case of the Mark-III containment system. Korobkin and Khabakhpasheva 25 also simplified the wave impact onto a local elastic plate as a water entry problem. In the preliminary stage of the present study, we conducted quantitative experimental and numerical analysis for water entry of an elastic stiffened panel.
Water slamming is a phenomenon characterized by high pressure acting over a body surface for a very brief duration. The impact pressure could cause great structural deformation and even dynamic buckling. 26 The elastic response also played an important role in forecasting maximum slamming pressure. 27 Many researchers have realized the importance of hydroelasticity and explored experimental and numerical methods to solve this problem.28–30
In water entry tests on elastic or elastic-plastic structures, most researchers focus on structural stress and impact pressure as influenced by hydroelasticity. Chuang,1,18 for example, investigated the water entry problem for plates, wedges, and ship bottoms by comparing elastic and rigid structural measurements. In addition, hydroelastic and air cushion effects were both discussed. Both effects were shown to decrease the maximum impact pressure of water entry. Stenius et al. 31 studied hydroelasticity through a series of experiments on slamming loaded marine panels; such hydroelastic effects can be quantified by comparing deflections and strains from experiments with the corresponding non-hydroelastic reference solutions. Several water entry tests on elastic structures were also conducted to validate the applicability of simplified and numerical methods to the water entry problem. Luo et al. 10 experimentally investigated the slamming load and response of a complex three-dimensional steel wedge with stiffeners on both sides, and the hydroelastic effects were discussed. They developed an approach combining the Wagner theory and finite-element method (FEM) for comparison against their experimental measurements. Panciroli et al. 11 conducted a comparison between an experiment and numerical simulation to study the water impact on an elastic wedge; their numerical approach was based on a coupled FEM and Smoothed Particle Hydrodynamics (SPH) formulation available in the commercial code LS-DYNA. However, they only considered the water portion and neglected air in applying SPH method.
Large amounts of numerical methods have been adopted to solve the water entry problem of elastic structures. Among them, SPH and Arbitrary Lagrangian–Eulerian (ALE) methods were two of the most common ways in the latest studies. Anghileri et al. 17 provided a helpful review of the merits and limitations of different numerical approaches in solving the water entry problem. They found ALE and SPH methods had less limitations and cost less CPU time when compared to other methods, while the coupling parameters in ALE method and the particle quantities in SPH method should be determined before the analysis. In this study, ALE method was adopted in the numerical analysis via LS-DYNA code. Bereznitski 29 and Luo et al. 32 gave numerical predictions for the water impact on elastic structures by ALE method, effectually characterizing the merits of this approach in research on hydroelastic slamming. Wang et al. 33 investigated the hydroelastic responses of a horizontal plate under water impact at both forward and downward speeds via ALE method. Stenius et al. 34 explored the hydroelastic interaction in high-speed craft via ALE method including a series of simulations on different impact velocities, deadrise angles, boundary conditions, membrane effects, and panel properties. Wang et al. 35 studied the dynamic response of a light weight pyramidal sandwich plate structure (LWPSPS) under different water entry velocities by ALE method, with particular focus on the structural deformation.
Unlike most water entry problems, the impact discussed in this article occurs with significant air cushion effect. The direct water slamming on the stiffeners and the impact on plate transmitted by compressed air form two separate sets of effects though they influence the whole panel concurrently. Lewison 36 explored a similar phenomenon to find that flanges fitted to the outer edge of a flat-bottom body can decrease the pressure and cushion the impact on the structure. Khabakhpasheva et al. 24 also developed a numerical representation of the incompressible liquid impact onto a corrugated elastic panel with compressible gas trapping between the corrugations. In this study, we explored the impact pressure, structural stress, and air cushion at work in a similar water entry problem.
We investigated the water impact on the stiffened side of an elastic stiffened panel in this study by a series of experiments as well as three-dimensional explicit FEM with a Multi-Material Arbitrary Lagrangian–Eulerian (MMALE) solver. We first measured the impact pressure and stress on the stiffened plate with drop heights of 0.5–2.0 m, then compared the measurements against the results of our numerical simulation. Effects of drop height, stiffeners, and air cushion on loads and dynamic responses are analyzed. We also explored the influences of the gas prosperities on pressure, as discussed below.
Model tests
Model description
A typical stiffened panel (Figure 1) was designed for use in our test program to explore impact acting on a complex three-dimensional structure. Free-drop model tests with different drop heights were carried out at the Ship and Offshore Structural Mechanics Laboratory. The drop height was defined as the distance between the plate of the stiffened panel and the water surface; we tested four different drop heights of 0.5, 1.0, 1.5, and 2.0 m.

Free-drop stiffened plate model from three-dimensional view and three orthographic views.
The size of the stiffened plate was 1.6 m × 1.2 m. Three kinds of stiffeners were welded on the plate and defined as stiffener I, II, and III. Two L-shaped stiffeners (stiffener III) were placed along the transverse direction while seven small T-shaped stiffeners (stiffener I) and two large T-shaped stiffeners (stiffener II) lay along the longitudinal direction, all equally spaced. Detailed structural data for the panel are provided in Table 1. The thickness of other unspecified components were all 2 mm.
Stiffened panel structural data.
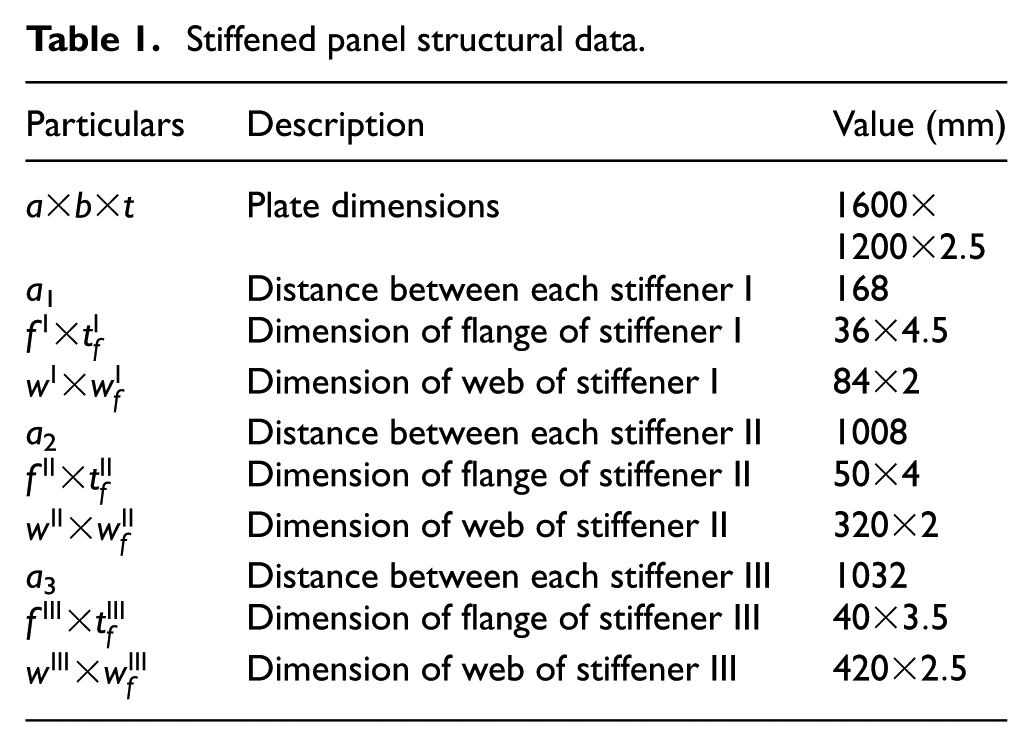
The stiffened panel was fixed to the impact frame with more than 100 screws, and four beams 30 mm in height were welded to the plate edges to provide stronger boundary support. The total weight of the specimen was 112 kg.
Facilities and instrument
The specimen was dropped into a water tank 4 m in length, 4 m in width, and 2 m in height (Figure 2). The effects of the tank bottom and wall were neglected in the experimental measurements since they are found small by numerical approach in a later section. The total drop components, including the model, impact frame, and sliding frame, hung from the crane in the configuration shown in Figure 3. The 2 m × 2.5 m sliding frame was made of I-section beam with guide rails across its four respective corners which prevented the drop components from rolling during impact. The friction between the sliding frame and guide rail was neglected as the specimen free-fell. The two-layered impact frame was made of U-shaped beams (upper layer) and equal-angle steels (lower layer). The 2 m × 2 m upper layer was bolted to the sliding frame, and the 1.2 m × 1.6 m lower layer was bolted to the stiffened panel. The impact frame ensured that the model entered the water before any other component. The total weight of the sliding and impact frames was 346 kg. A mechanical release mechanism was positioned between the ropes on the sliding frame and the crane hook.
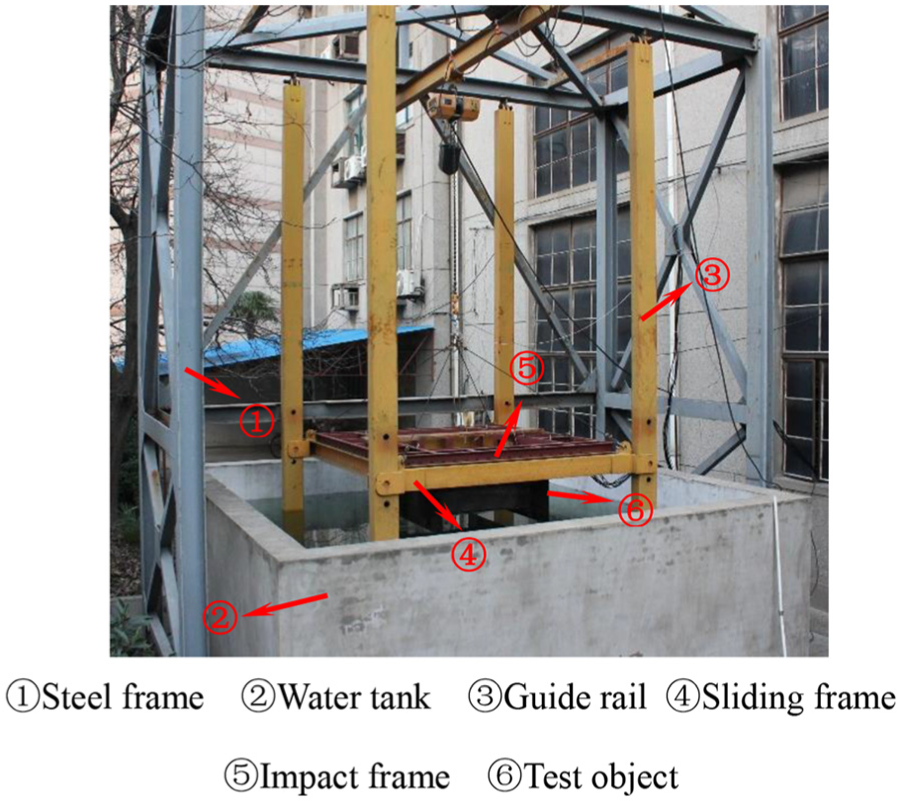
Schematic diagram of experimental set-up.

Detailed images of drop components: (a) stiffened panel and impact frame, (b) stiffened panel and impact frame (another view), (c) hoisting to the sliding frame, and (d) pressure and strain transmitters.
The pressure signal and strain responses on the elastic stiffened plate were recorded during impact tests. Figure 4 shows the configuration of the pressure transmitter NS-W and three-element rectangular strain rosettes BE120-3AA on the panel. The pressure transmitter (P) was mounted at the center of the plate between Center Line 2 and stiffener I. The pressure at P represents the impact pressure of the stiffened panel. Eight strain rosettes (S) were attached on the stiffened panel to measure the strain responses; among them, S1–S6 were attached to the flanges of the stiffeners while S7 and S8 were fitted on the plate. All the pressure and strain transmitters and the wires connecting them were made watertight with latex and tape. The strain transmitters were also attached to the back surface to prevent direct water impact, as shown in Figure 3(d). Several small holes were drilled on the web of the stiffener to allow passage of the wires. Dynamic data acquisition and processing system (EDX-100A) was used to gather the pressure and strain signals. The sampling frequencies were set to 50 kHz to measure the peak signals occurring within the very brief duration of water impact, which is generally millisecond-level.

Locations of pressure cell and strain rosettes.
After obtaining readings from the three-element rectangular strain rosette, the principal stress at each position was calculated as follows

where
We define the effective stress based on von Mises yield criteria, which can be calculated from principal stress (equation (1)) as follows

Data collected
We used a high-speed camera to record the experimental events. A series of images for one free-drop test were obtained at height of 2.0 m from the frames of the high-speed video, as illustrated in Figure 5. The signal lines which connected the sensor on the model with the data acquisition system were bound together and passed through the steel frame after ensuring they were long enough for the free drop distance. Figure 5(a) shows the instant just after the start of the free drop. Figure 5(b) and (c) illustrates the water splashing as it impacts the stiffened plate. The spray was also caused by water entry of the impact frame and sliding frame, which were submerged just after the panel.

Images of free-drop test at height 2.0m when the specimen: (a) starts to fall, (b) reaches to water, and (c) submerges.
The body was dropped into the water three times at each drop height to ensure the repeatability and reliability of the tests. All test cases were carried out orderly with respect of their drop height on the afternoon of 15 January 2016. The environmental conditions of the test site are listed in Table 2. The repeated tests were the same except for some inevitable changes in environmental conditions and manual operation. The pressure at P and the effective stress at S1 in the tests at drop heights of 1.0 and 2.0 m are plotted in Figures 6 and 7. The initial time is the moment when the drop components were released and began their free-fall. The time of the water entry is about 0.7, 0.6, 0.45, and 0.3 s at the drop heights of 2, 1.5, 1.0, and 0.5 m, respectively.
Environmental conditions of tests.
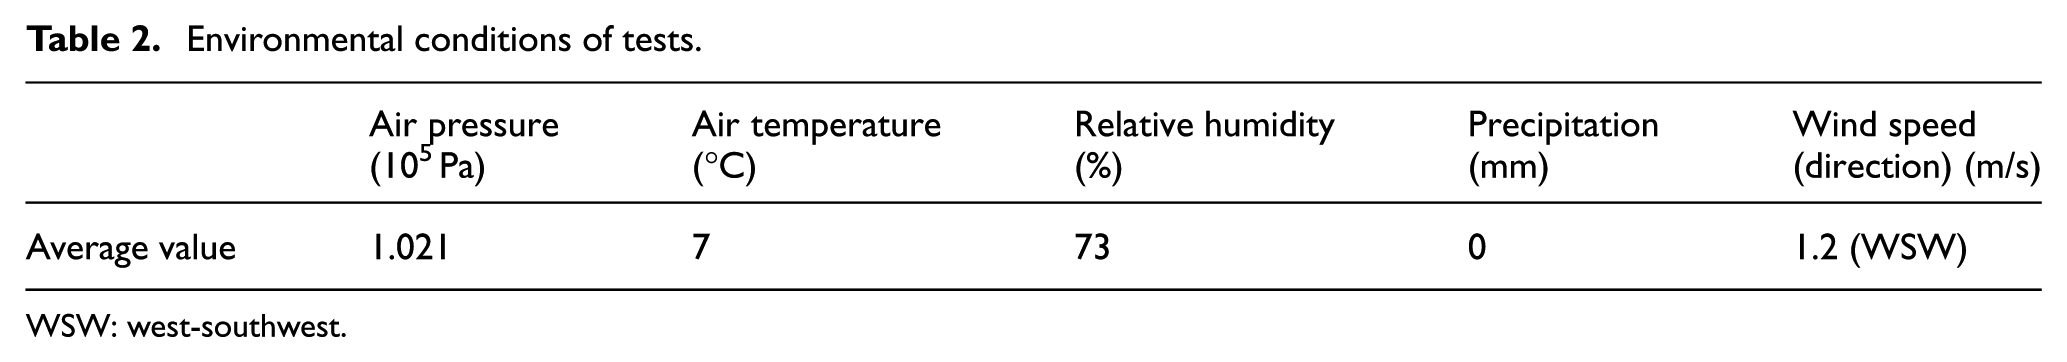
WSW: west-southwest.

Measured pressure at P for drop heights of 2.0 and 1.0 m.

Experimental effective stress at S1 for drop heights of 2.0 and 1.0 m.
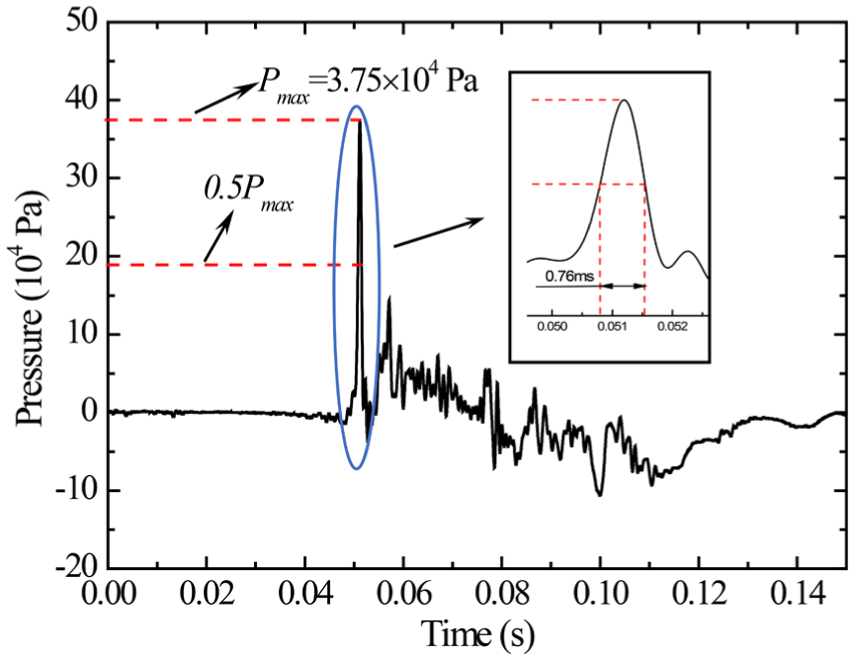
Large pressure oscillations occur in the curves after the specimen was released; these were caused by alternating compression, expansion, and escape of the air surrounded by the main stiffeners under the plate during the free-fall. The pressure peak is not as sharp as in most slamming events due to the strong air cushion effect (which we discuss in detail in a later section). There are also oscillations in the stress curves after the impact is complete. More interfering signals were generated on the panel and transmitted to the strain sensor after it was submerged. We installed rubber bumpers on the underwater guide rail to prevent the specimen from collision with the tank bottom; these may also have caused the oscillations. The pressure transmitter was not sensitive to the interfering signals, however, as it did not sustain direct water impact loads and was cushioned by the air.
The relative errors of the data across the three experimental replications remain within 10% of the peak value. The measured pressures and effective stresses for all drop heights and locations were checked and their standard deviations determined. The differences between these measures at the same height were caused by environmental (e.g. wind) changes and manual operation error (e.g. inconsistent water level and drop height). Variations were also more apparent in the later stages of the impact as the flows of water and air grow more complex. Small distinctions in the environment and initial conditions may have altered the state of air remaining in the cavity after the impact. The differences in measurements in the repeated tests may reach 20%1 as interactions are transient and environmental conditions are hard to control. The repeatability and reliability of our tests are indeed satisfactory per comparison among the measurements. All the experimental measurements below are calculated as mean of the data obtained from these test replications.
Numerical modeling
Mathematical model for ALE method
As mentioned above, we used explicit FEM with ALE solver to simulate the water entry problem discussed here. This section describes the relevant equations constituting this method.
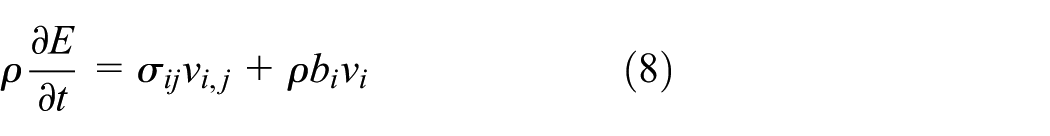
The ALE formulation can be derived from the relation between the time derivative of the material and that of a reference geometrical configuration. The equations of mass, momentum, and energy conservation for a Newtonian fluid are as follows


where wi is the relative velocity given by w = v – u, v represents the velocity of the material and u is the velocity of the mesh, ρ represents the fluid density, bi is the body force acceleration, and σij is the total Cauchy stress which can be calculated as follows

where p is the pressure and δij is Kronecker δ function; ν represents the dynamic viscosity.
For the MMALE method, equations can be solved in two steps. The Lagrange approach is carried out in the first step. No material flows through the element boundary, so mass conservation is satisfied. The equilibrium equations of the velocity and energy can then be calculated as follows

In the second step, the mass, momentum, and energy of materials transports through the boundaries of the element. The velocity and displacement of each node are updated according to the following equation


where
Model description
The explicit finite element analysis is based on a MMALE solver with a penalty coupling method. This method has been successfully used to study water impacts and events involving fluid-structure interaction.13,37 The fluid is described as an Eulerian formulation while the stiffened panel is described by a Lagrangian approach. We use the commercial code LS-DYNA to accomplish this. Water surface tension effects are not considered in this study.
The panel is modeled with SHELL163 element, which is a 4-node element that is only applicable to explicit dynamic analysis. The plate is modeled with *MAT_ELASTIC, which is an isotropic elastic material model with Young’s modulus (E) of 210 GPa, density (ρs) of 7850 kg/m3, and Poisson ratio (ν) of 0.3. MASS166 element, which is defined by a single node, was added along the edges of the panel to reflect the weight of the entire drop components.
Fluids are modeled with SOLID164 element, an 8-node brick element. They are assigned with *MAT_NULL, which is a void material that allows equations of state to be considered without computing deviatory stress. The air and water states are defined by Gruneisen state equation, which defines pressure for compressed materials as follows

and for expanded materials as

where
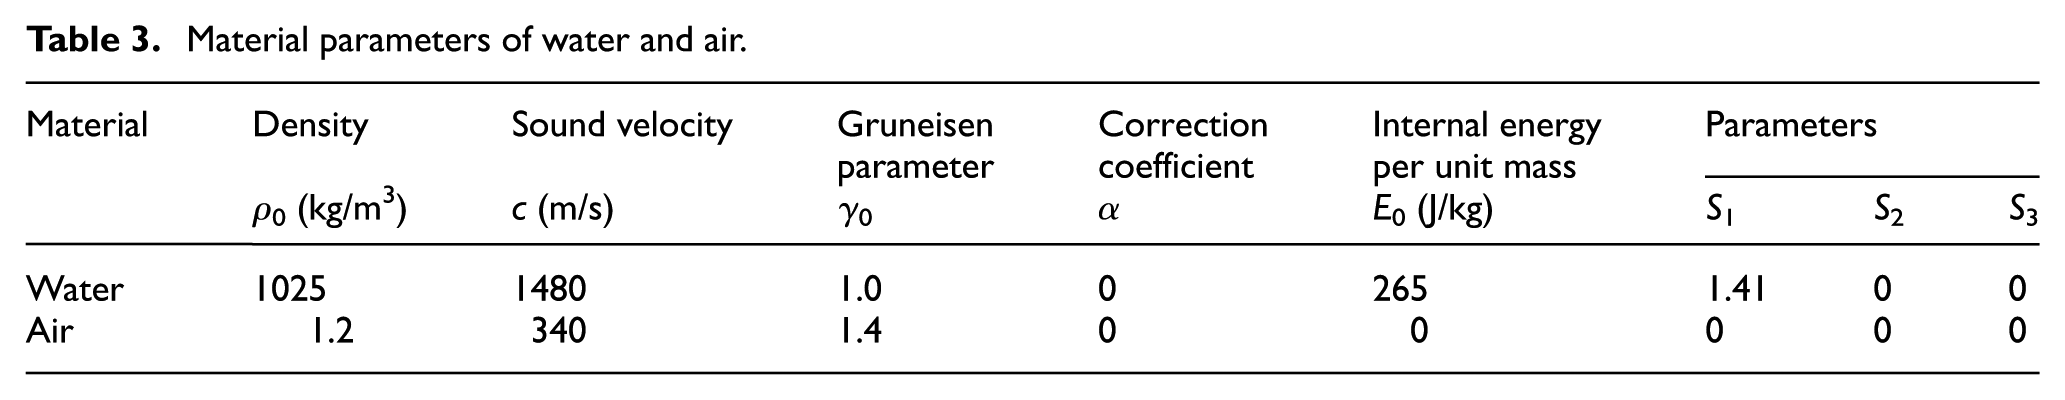
The detailed definitions of parameters in equations (11) and (12), as well as their values for water 35 and air, are shown in Table 3.
Material parameters of water and air.
In the penalty coupling algorithm, the penalty factor is set to 0.1 (as discussed in the convergence section below). Because the mesh size of the structure and the impact fluid domain are nearly equivalent, the number of coupling points distributed over each coupled Lagrangian surface segment is set by default to 2. A normal direction with compression and tension for coupling direction is defined. The minimum volume fraction is set to 0.3, and no leakage control is imposed here as the water entry velocity is relatively low.
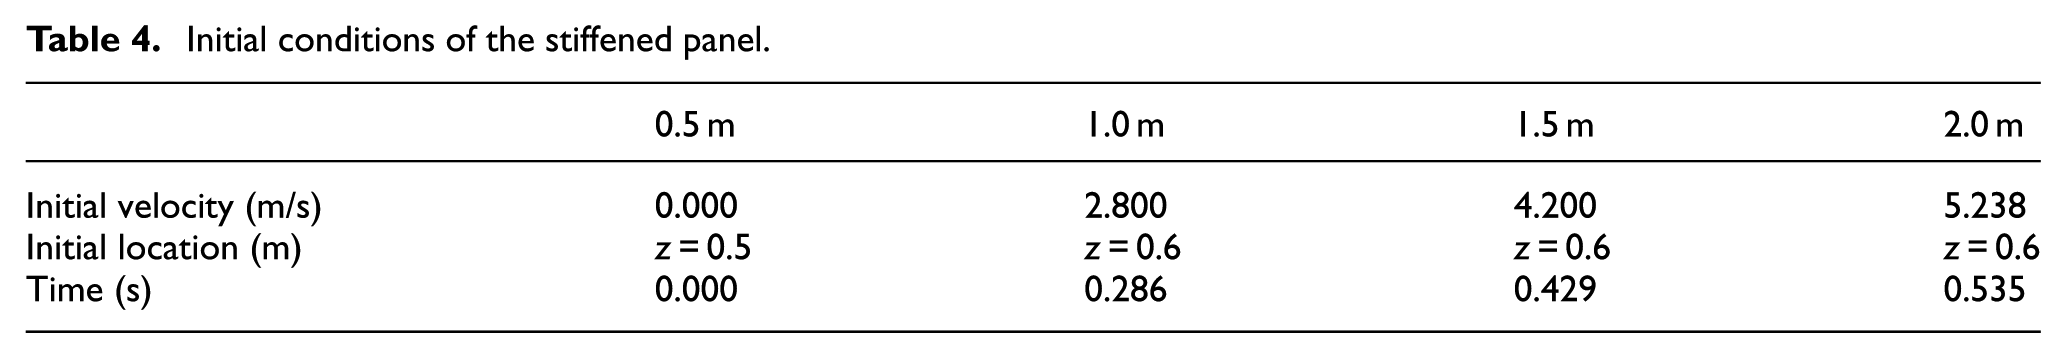
As illustrated in Figure 8, we introduced a coordinate system x–y–z where the x–o–y plane was placed at the undisturbed water surface. The body entered the calm water with an initial vertical velocity at initial time as the body dropped from each height to the initial location. The initial locations, velocities, and corresponding moments from the start of the free fall are shown in Table 4.

Coordinate system of numerical model.
Initial conditions of the stiffened panel.
The fluid domain and structure are symmetrical with respect to the y–o–z and x–o–z planes, so only a quarter of the model was established with symmetric boundaries on these two planes. The boundaries of air are defined as non-reflecting; the boundaries of water were simulated as the wall in accordance with the walls and bottom of the tank in the tests. The plate edges were clamped to only move freely in the z-direction.
ALE calculations are notoriously time-consuming, so we applied different mesh types on different regions to reduce the burden on memory and CPU. Luo et al. 38 found that the mesh size near the contact region is crucial to an accurate simulation. Figure 8 and Table 5 show the mesh style of the fluid domain. In the model, the fluid domain is limited to (L1+L3) × (L2+L4) × (L7+L5+L6+L8), so the dimension in the x–o–y plane is (L1+L3) × (L2+L4); the dimensions of the air domain and water domain in the z-direction are L7+L5+L6+L8. The dimension of the impact domain is L1 × L2 × (L5+L6). The size of the model was designed based on several calculations and the experience with LS-DYNA code. The dimension of the air domain in the z-direction (L5) is much larger in this model than the models used for most water entry problems. The section below regarding convergence discusses models of different mesh density and contact stiffness.
Fluid domain dimensions.

Convergence analysis
The penalty coupling algorithm is adopted in running the ALE method to simulate the interaction between the structure and fluid. Penalty coupling behaves like a spring system wherein coupling force can be described as follows

where k represents the spring stiffness and d is the depth penetration which can be calculated by the velocities of the master node of Eulerian element and slave node of Lagrangian element. The coupling force F is applied to both master and slave nodes at the coupling interface.
The numerical stiffness by unit area k is as follows

where K is the bulk modulus of the fluid element, V is the volume of the fluid element that contains the master node, and A is the average area of the structure elements connected to the structure node.
It is necessary to properly account for the influence of the penalty factor pf on the solution to any water entry problem. 39 Luo et al. 38 conducted a parametric study to find that mesh size is also of critical significance to such simulations, while other aspects (such as penalty factor and contact point quantity) are less important. We investigated the penalty factor pf and mesh size related to V and A in this study.
Three mesh sizes, 20, 10, and 5 mm, were selected for the fluids of the impact domain. The mesh size of the structure is the same as that of the impact domain, as suggested by Luo et al. 32 The value of pf was set to 0.1 and the free drop height to 2 m in the simulations. The tower workstation we used is configured with a motherboard Supermicro X10DAi, 2 CPUs (Intel® Xeon® E5-2650 v3) and six 16 GB memory banks (Samsung DDR4 2133 MHz); 30 processors and about 40% of the memory were allocated to the numerical models. Table 6 lists the main parameters of the three models.
Three models with varying mesh density.

Figure 9 shows impact pressure at P and effective stress at S1 for models with different mesh sizes as well as the experimental measurements. Two short pressure peaks exist before the main pressure peak in the experimental data indicating pressure oscillations after the release of the specimen. However, the structure in numerical model has an initial velocity when the calculation begins and the air is static at this moment. So there is nothing matching these experimental oscillations. As shown in Figure 9, when the mesh size is 5 or 10 mm, the numerical impact pressure and stress are in good agreement with experimental measurements. When the mesh size is 20 mm, the predictions overestimate the experimental measurements, especially in the later stages of impact. We also found that numerical noise is more apparent for the model with the larger mesh size. The 10 mm mesh size model is best suited to capturing the time history of impact pressure and stress on the stiffened plate, and works within a reasonable computation time. The model with 5 mm mesh size is not utile due to its excessive computation time.

(a) Impact pressure at P and (b) effective stress at S1, with different mesh sizes, drop height of 2.0 m.
The influence of penalty factor pf on the results is also explored by implementing three different values, 0.1, 0.3, and 0.5, with a 10 mm mesh size as determined based on the analysis described above.
Figure 10 shows the impact pressure on the stiffened plate with different pf values and drop height of 2 m. The three curves agree well despite some oscillations which were likely caused by the penalty coupling algorithm itself. 13 There are distinctions after the peak value, and error accumulation may have created the larger differences in the later stages of impact. In addition, the outside panel was directly impacted by water as it was not surrounded by the main stiffeners in the later stages. The load acting on them, to this effect, is more sensitive to the pf value. This phenomenon may have influenced the velocity of the panel and affected the air state in the cavity. The impact pressure from the model with pf value of 0.1 is in closest agreement with the experimental measurement.
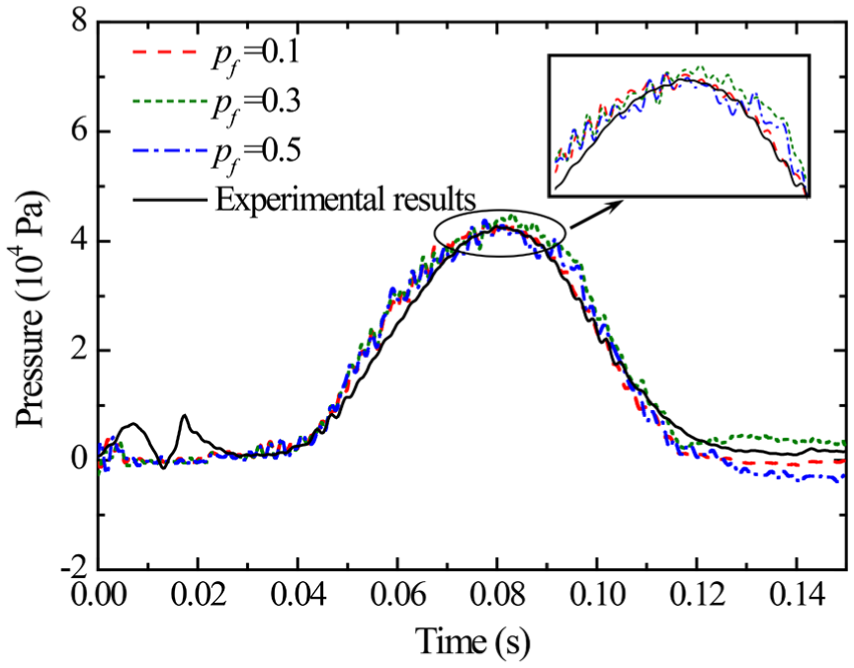
Impact pressure at P with different pf values with drop height of 2.0 m.
Effects of tank bottom and wall
To study the effects of the tank bottom and wall on the results, another two numerical models are built. These models are same as the one described above except for the dimension of the fluid domain. In one model (Model 2WL), the length and width of the fluid domain are both twice the size of the original so that L3 and L5 increase to 3.35 and 3.15 m. In the other model (Model 2D), the depth of the water domain is doubled so that L8 increases to 2.8 m. A sketch of the water surfaces and impact pressure in the two models and original model are shown in Figures 11 and 12.

Sketches of structure and water for three models at 0.15 s.

Impact pressure for three models.
Figure 11 shows the deformed water surface at the 0.15 s time point (i.e. when the calculation ends). The differences among models are mainly embodied in the water spray and the water level near the boundary. As shown in Figure 12, the pressure in the three models is also basically the same despite slight differences in the later stages of impact. The pressure, water spray, and raise of water level are especially similar between the model with deeper water and the original model. There are greater differences when comparing the original model to the model with the broader fluid domain; the water level in the latter model is lower at the edges because the water surface rises to less extent when the water domain is larger. The pressure is also a little smaller in the later stage compared to that in the original model, but the decrease accounts for only about 5% of the maximum pressure value.
The comparison indicates that the influences of the tank bottom and wall are limited. In fact, in the initial stage, hydrodynamic impact only occurs on the main stiffeners, which are rather small compared to the water domain. In the middle and later stages, the pressure on the plate is mainly induced by the compressed air. The deformation of the water surface under the panel is closely related to the pressure, and the tank wall mainly influences the surrounding water level. The effects of tank bottom and wall can be neglected in the numerical analysis as well as in the experiment.
Analysis of experimental and numerical results
Impact pressure and effective stress
Changes of water and air cushion surrounded by the main stiffeners are closely related to impact pressure, but were difficult to observe in the experiment. In addition, the water spray was caused not only by the panel itself but also by the sliding and impact frame. Here, we analyze the impact process only via a numerical approach.
Figure 13 shows the numerical simulation of structure and fluid states with free drop height of 2.0 m. Three moments were extracted from the pressure curve shown in Figure 14(d): An increase at 0.04 s, maximum at 0.08 s, and decrease to zero at 0.12 s. As shown in Figure 13(a), the impact begins when a closed cavity is formed. At this moment, stiffener III has penetrated the water and stiffener II is approaching the water surface; the impact pressure on the plate is mainly caused by air compression. As the panel continues falling, the impact pressure at the plate center reaches its maximum (Figure 13(b)). The air is compressed further and there is still no direct contact between the plate and water apart from the interaction between the water spray and plate edge. Once the impact is effectually complete (Figure 13(c)), there is no longer any contact between the water and the center of the plate. At this moment, an air gap forms between the water and flange due to the pressure difference, and the trapped air escapes.
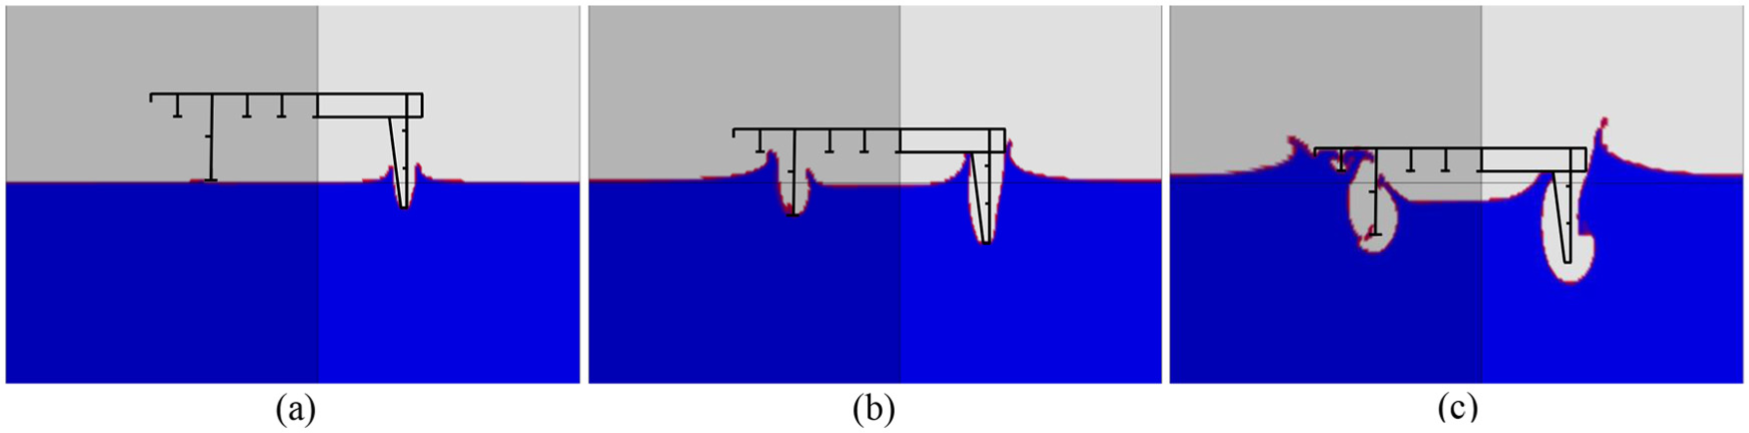
Impact process of free drop height 2.0 m (numerical simulation): (a) t=0.04 s, (b) t=0.08 s, and (c) t=0.12 s.
There are two different types of impact which occur in the water entry process. The flanges and portion of the panel outside the main stiffeners are directly slammed by water. The former happens first, and the latter comes up in the end. Air cushion effects at these locations are limited. The impact pressure at the center of the plate is mainly induced by the air wrapped by the water, plate, and stiffeners. The pressure changes with the compression, expansion, and escape of air.
We also quantified the pressure and effective stress values by both experimental and numerical approaches. The measured and calculated pressure at P in the time domain with different drop heights are illustrated in Figure 14. In the initial stages of impact, the experimental pressure fluctuated in all cases as discussed above; this fluctuation decreases as drop height decreases. The predicted impact pressure values are in close agreement with the experimental measurements. The largest relative error of the peak value, which is within 10%, occurs at drop height of 0.5 m. The error is accumulated over the course of the computation time, so greater differences appear at lower drop heights toward the end of the simulation. The duration of pressure ranges from about 60–80 ms, which is much longer than most water entry problems. These duration values also illustrate that the air cushion plays a critical role in water entry of the stiffened plate when stiffeners are assigned to the side near the water.

Impact pressure at P with free drop heights of (a) 0.5 m, (b) 1.0 m, (c) 1.5 m, and (d) 2.0 m.
The measured and calculated maximum pressure at P with various drop heights are shown in Figure 15 alongside the standard deviation of the experimental replication data at each height. The small standard deviations validate the reliability of the experimental results. The maximum numerical pressure values with various drop heights are in close agreement with the experimental measurements. The peak value increases as drop height increases. In the experiments, the maximum drop height was restricted to the height of the steel frame. To determine the exact relationship between drop heights and maximum pressure, two more cases were calculated in which the drop height was raised to 3 and 5 m. The results indicate that the maximum impact pressure increases linearly with drop height.

Measured and calculated maximum pressure at P with different drop heights.
In the tests, eight positions are chosen to measure the strains on the stiffened panel. Effective stress is calculated by the measured data of three-element rectangular rosettes. Results of numerical approach are also given to evaluate the stress distribution of the whole stiffened panel.
The effective stress contour of one-quarter of the stiffened panel at the peak impact (0.08 s) is shown in Figure 16(a). Significant stress is distributed across stiffener II as well as the junction of stiffeners II and III. The compressed air produces strong lateral pressure on the web of the main stiffeners. For stiffener III, other crossing stiffeners and the bracket weaken the torsional deformation generated by this pressure, so its effective stress is not as high as that of stiffener II, which is only connected to stiffener III at its ends. It is necessary to consider the lateral pressure and torsional deformation of the high web in the design process when the panel suffers similar loads.

Effective stress contour on (a) stiffened plate, (b) stiffener III, (c) stiffener II, (d) stiffener I, and (e) the plate, with drop height of 2.0 m.
Figure 16(b)–(e) shows the distribution of effective stress on each respective part of the specimen. High stress is distributed at the flange and root of stiffener II near Center Line 1. The maximum effective stress of the plate and stiffener III is near their junctions with stiffener II; the maximum stress on stiffener I is at the flange close to Center Line 1.
Figure 17 shows the experimental and numerical effective stress values at S1–S8 in the time domain with drop height of 2.0 m. There are oscillations both in the experimental stress curves and numerical results. High-frequency oscillations in the numerical results were induced by the algorithm itself. In addition, pressure fluctuates strongly in the area of direct water impact, as shown in Figure 18, though pressure curve at P is smooth due to the air cushion effect; this may have induced oscillations in the stress curves. Such oscillations could be suppressed by applying stiffness damping to the structure, but potentially at the cost of affecting the stress values. In the experimental data, oscillations originated in noise signals during data acquisition. When the maximum stress is less than 60 MPa, the oscillations are as large as one-quarter of the maximum value in some cases. However, when the maximum stress exceeds 200 MPa, the noise signals effectually vanish. A smaller sampling frequency may dampen the noise signals in the experiment—we plan to further explore this phenomenon in the future.
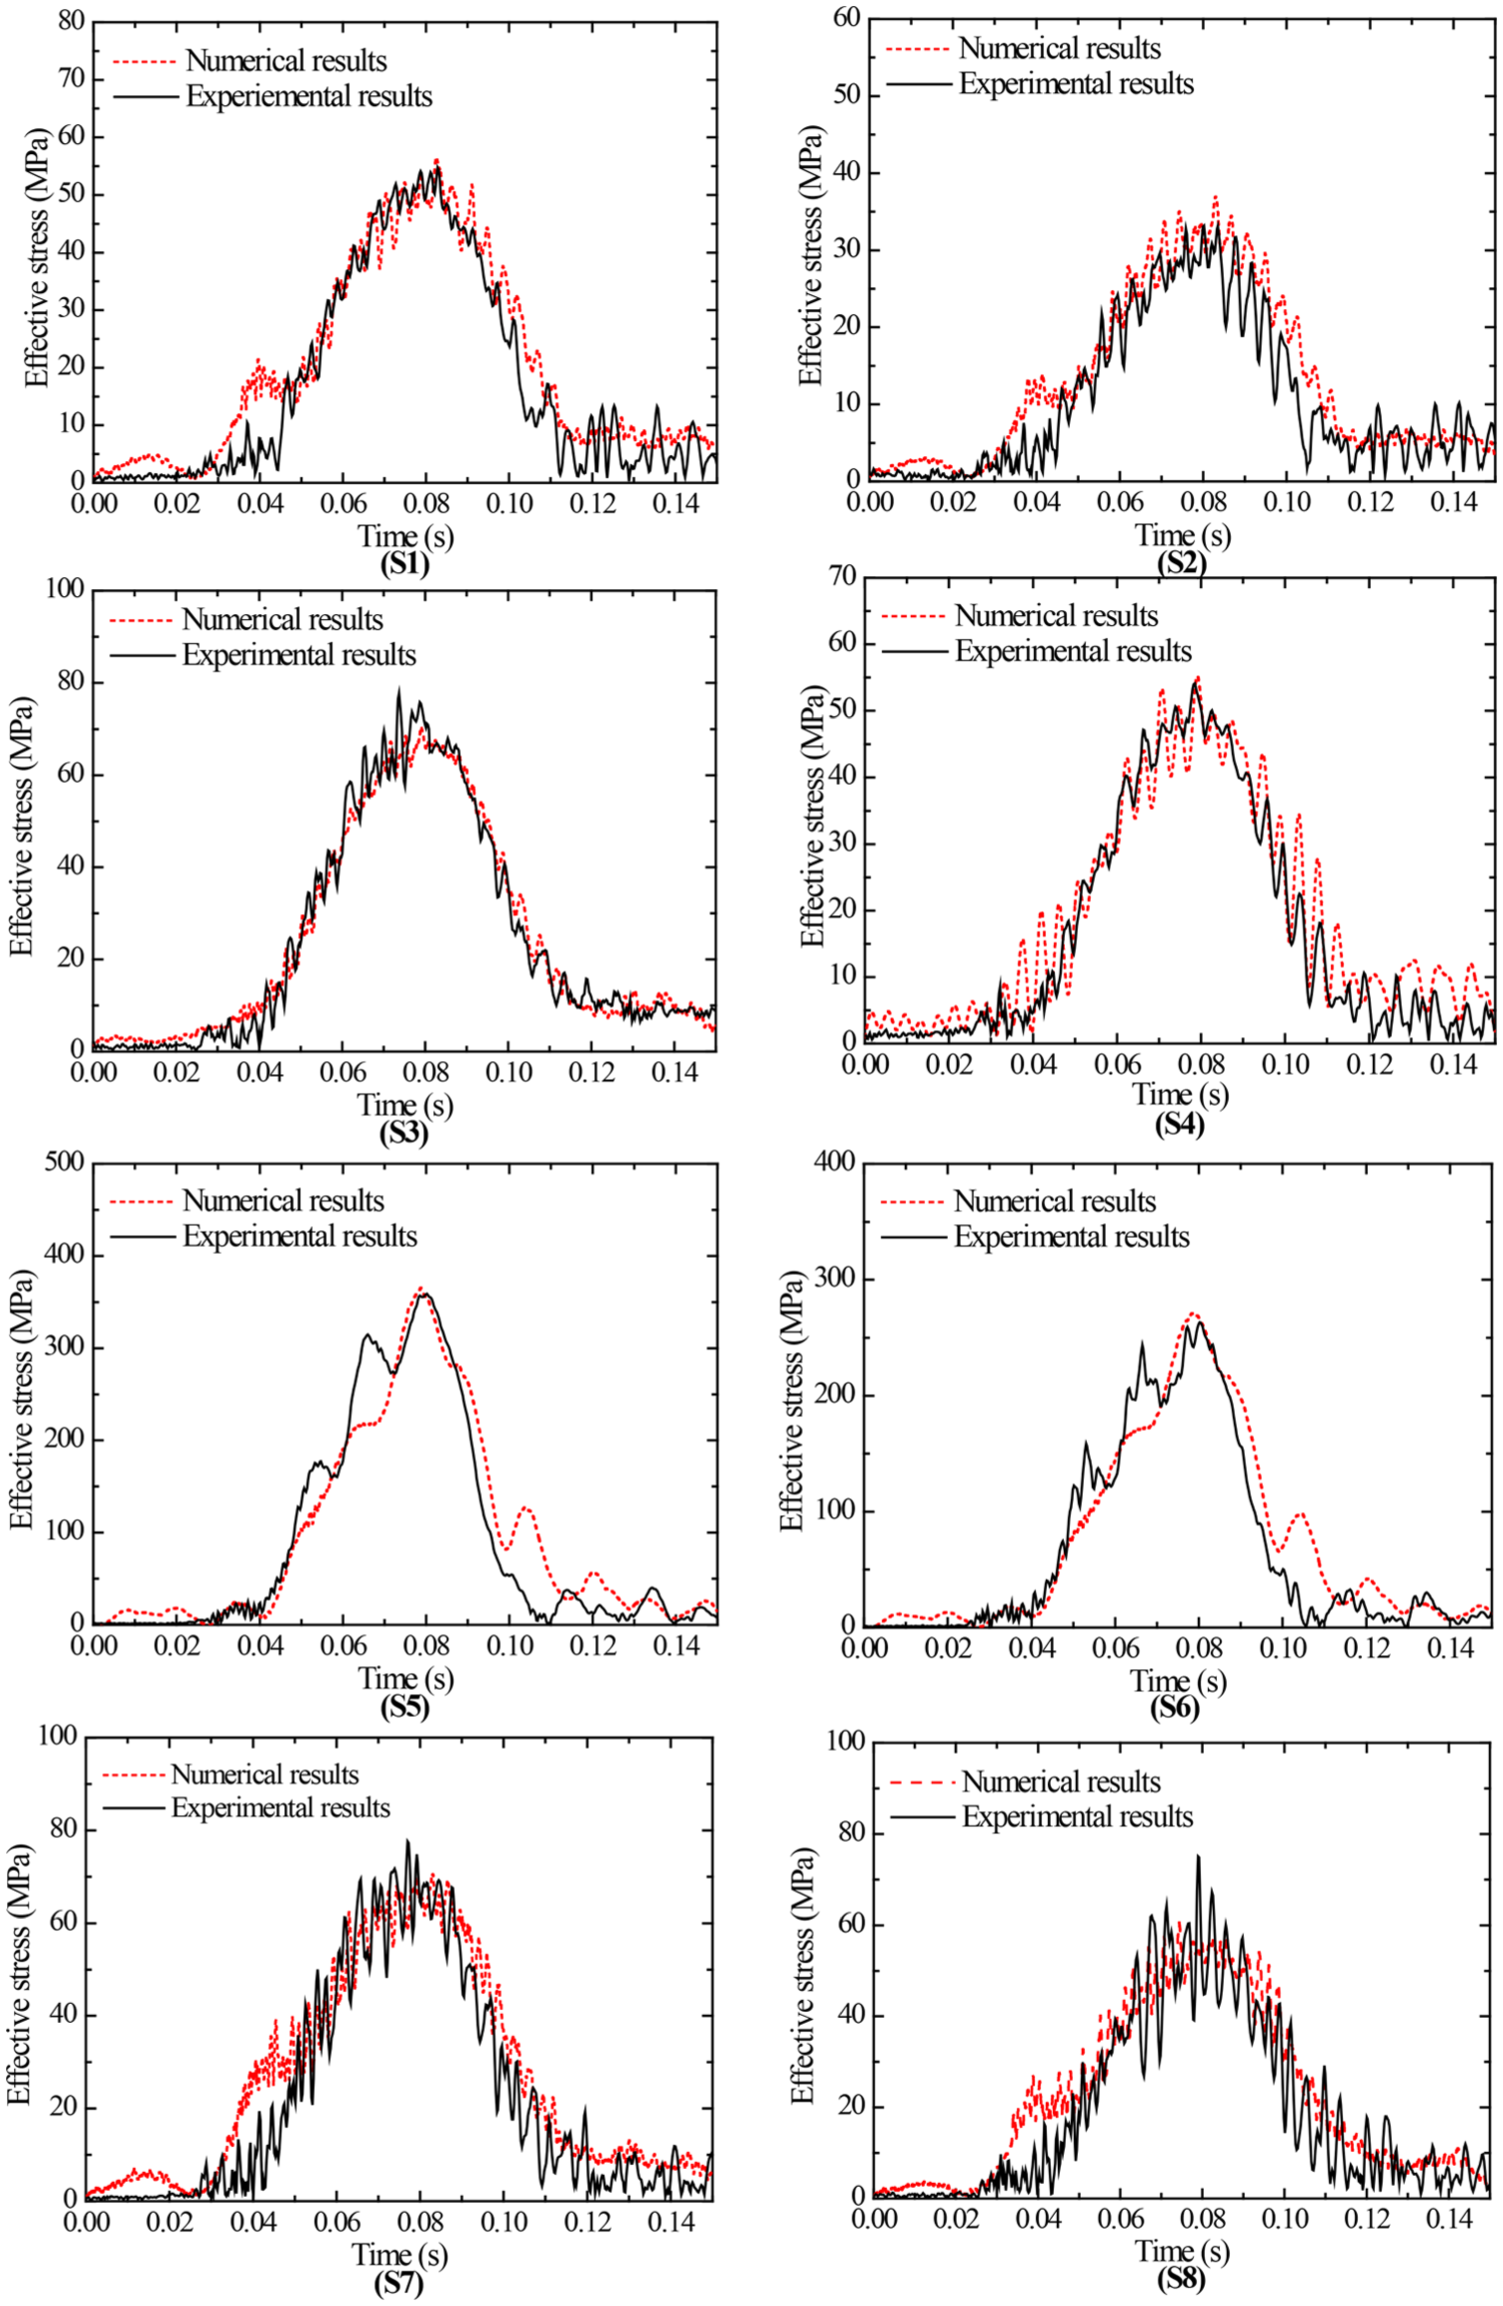
Experimental and numerical effective stress at S1–S8 with drop height of 2.0 m.
Impact pressure on stiffener III flange with drop height of 2.0 m.
Figure 17 shows that all stress values begin to increase at the same time as impact pressure. Close agreements between stress responses in the numerical results and experimental data are achieved. The errors of the peak value can be reduced to about 10% by neglecting the oscillations. The errors are mainly produced by welding distortion and dimension errors. The thinnest plate on the panel is 2 mm, so welding distortion was not entirely preventable even though the single-side welding process is applied. Structural dimension error is also inevitable when the plate is very thin.
There are small waves in the experimental stress curves at S5 and S6 as stress increases; these waves also exist in the numerical results, but are much smaller. The waves were caused by the impact pressure on the flange of stiffener II (Figure 18). In the test, the pressure here is not measured as the flange was too narrow to attach sensors, so only the calculated results are presented here. The first fluctuation peak in the stress curve occurs at about 0.05 s, and the pressure peak on the flange of stiffener II occurs at the same moment; its value is about eight to nine times that on the plate and the duration is as small as 1.5 ms. The second stress peak is caused by the subsequent pressure wave on the flange between 0.05 and 0.07 s. However, it is important to note that the calculated pressure on the flange is not accurate within the current mesh size, so the stress fluctuations caused by this pressure are not as obvious as those in the experimental data.
Figure 19 shows the experimental and calculated maximum effective stress on the stiffened plate at the testing drop heights. Similarly, the maximum effective stress increases due to the increase in load at greater drop heights. The maximum stress in the figure was defined as the average of the peak and valley of the oscillation near the real maximum value in order to eliminate the influence of the oscillation. The numerical effective stress values are in close agreement with the experimental measurements—the absolute errors are smaller at lower drop heights, but all relative errors are below 10%.

Experimental and numerical maximum effective stress at: (a) S1 and S2, (b) S3 and S4, (c) S5 and S6, and (d) S7 and S8, corresponding to different drop heights.
We calculated two more cases, as mentioned above, with drop height raised to 3 and 5 m. The maximum effective stress increases roughly linearly with drop height at S1, S2, S7, and S8, but the curve slopes decrease as drop height increases at S3, S4, S5, and S6—especially at S5 and S6. The stress of stiffener II appears to be caused by the pressure on the plate, stiffener web, and flange combined. The pressure on the flange does not increase linearly with drop height. Chuang18 gave the relationship between the impact velocity and pressure on a rigid flat plate considering air cushion effects as
Discussion of stiffener parameters
As discussed above, stiffeners play a significant role on pressure and stress in the present study. First, the water impact on flanges of stiffeners will induce extra stress. More importantly, the air trapped by the stiffeners will generate effective cushion during impact process. Dimensions of stiffeners are discussed here to analyze the complicated relationships with impact pressure and stress.
Twelve more numerical models were designed for panels with different stiffeners, as shown in Table 7, and they were divided into six groups to explore dimensions of flanges and webs of the three kinds of stiffeners (stiffeners III, II, and I, Figure 1). Underlined data are the stiffener dimensions in the original model. The new models have no differences except for these changed stiffeners compared with the original model. The free drop height was set to 2.0 m.
Case description.
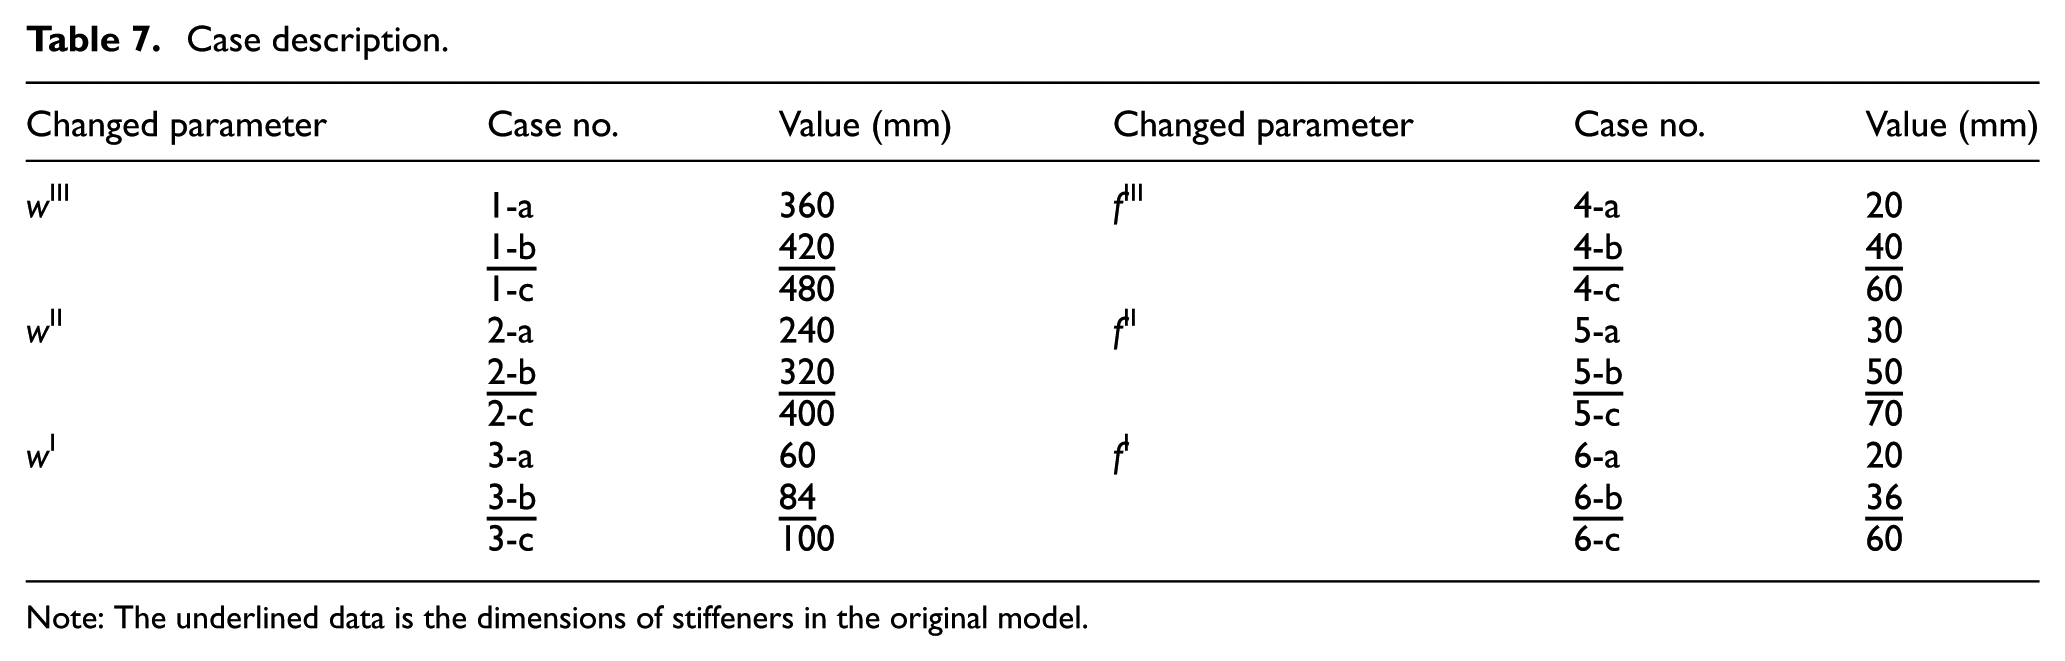
Note: The underlined data is the dimensions of stiffeners in the original model.
The positions we used to extract pressure and stress values of stiffeners III, II, and I and the plate are shown in Figure 20. They are all set as close to the panel center as possible. P is the position where the pressure transmitter is attached in Figure 4. The pressure at stiffener I can be neglected as it receives so little of the water impact.

Positions of pressure and effective stress.
Pressure at P for models with different values of wIII, wII, and wI is calculated and compared, as shown in Figure 21(a)–(c).
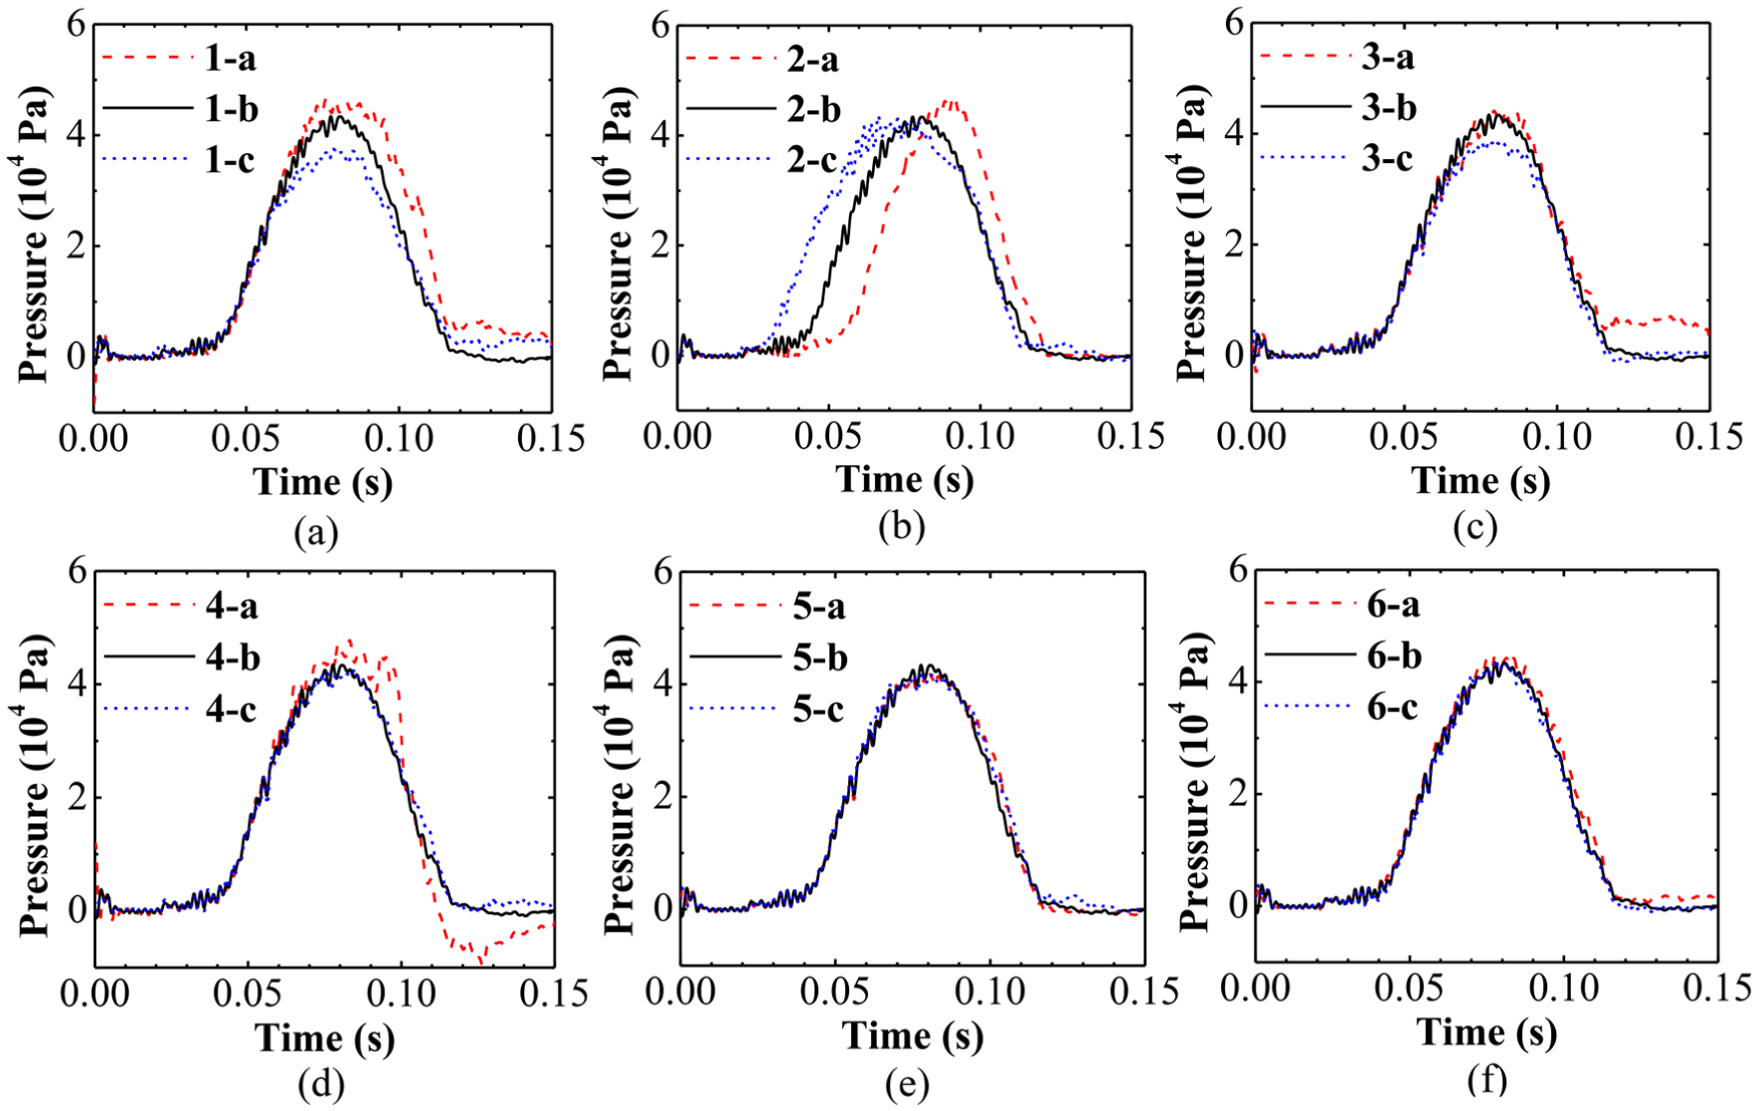
Pressure at position of P for models with different values of: (a) wIII, (b) wII, (c) wI, (d) fIII, (e) fII, and (f) fI
The values of wIII, wII, and wI, which represent heights of stiffener III, II, and I, exerted different influences on the pressure. As shown in Figure 21(a), a larger wIII value appears to decrease the impact pressure at P when stiffener III penetrates the water earlier. The interactions between stiffener flanges and water reduce the velocity of the panel; this resistance occurs earlier when the value of wIII is larger, as shown in Figure 22(a), and makes the impact velocity smaller.
Pressure at position of PIII for models with different values of: (a) wIII, (b) wII, (c) wI, (d) fIII, (e) fII, and (f) fI
The value of wII slightly affects the maximum pressure value at P. However, the start time and duration are greatly influenced by it. The air is completely trapped by the combination of stiffeners III and II. Stiffener II is in the lower position and thus determines the moment when the air cavity is generated. The air is compressed earlier when stiffener II is higher, so the pressure starts to increase earlier. The compression process is longer in this case, which leads to a longer impact duration. The thicker cushion slows down the pressure growth and slightly reduces its maximum value.
The height of stiffener I, which is the lowest, has little influence on the pressure at P. Only when the value of wI is fairly large (here, about one-third of wII) does the peak value decrease slightly little due to an increase in impact load and subsequent water resistance.
For panels with different flange widths, pressure at P is compared in Figure 21(d)–(f). The pressure increases slightly when fIII is smaller, which is attributable to the reduction in total force and resistance in the water movement despite the relatively high local pressure (Figure 22(d)). There is no apparent change in pressure at P with different flanges of stiffeners II and I.
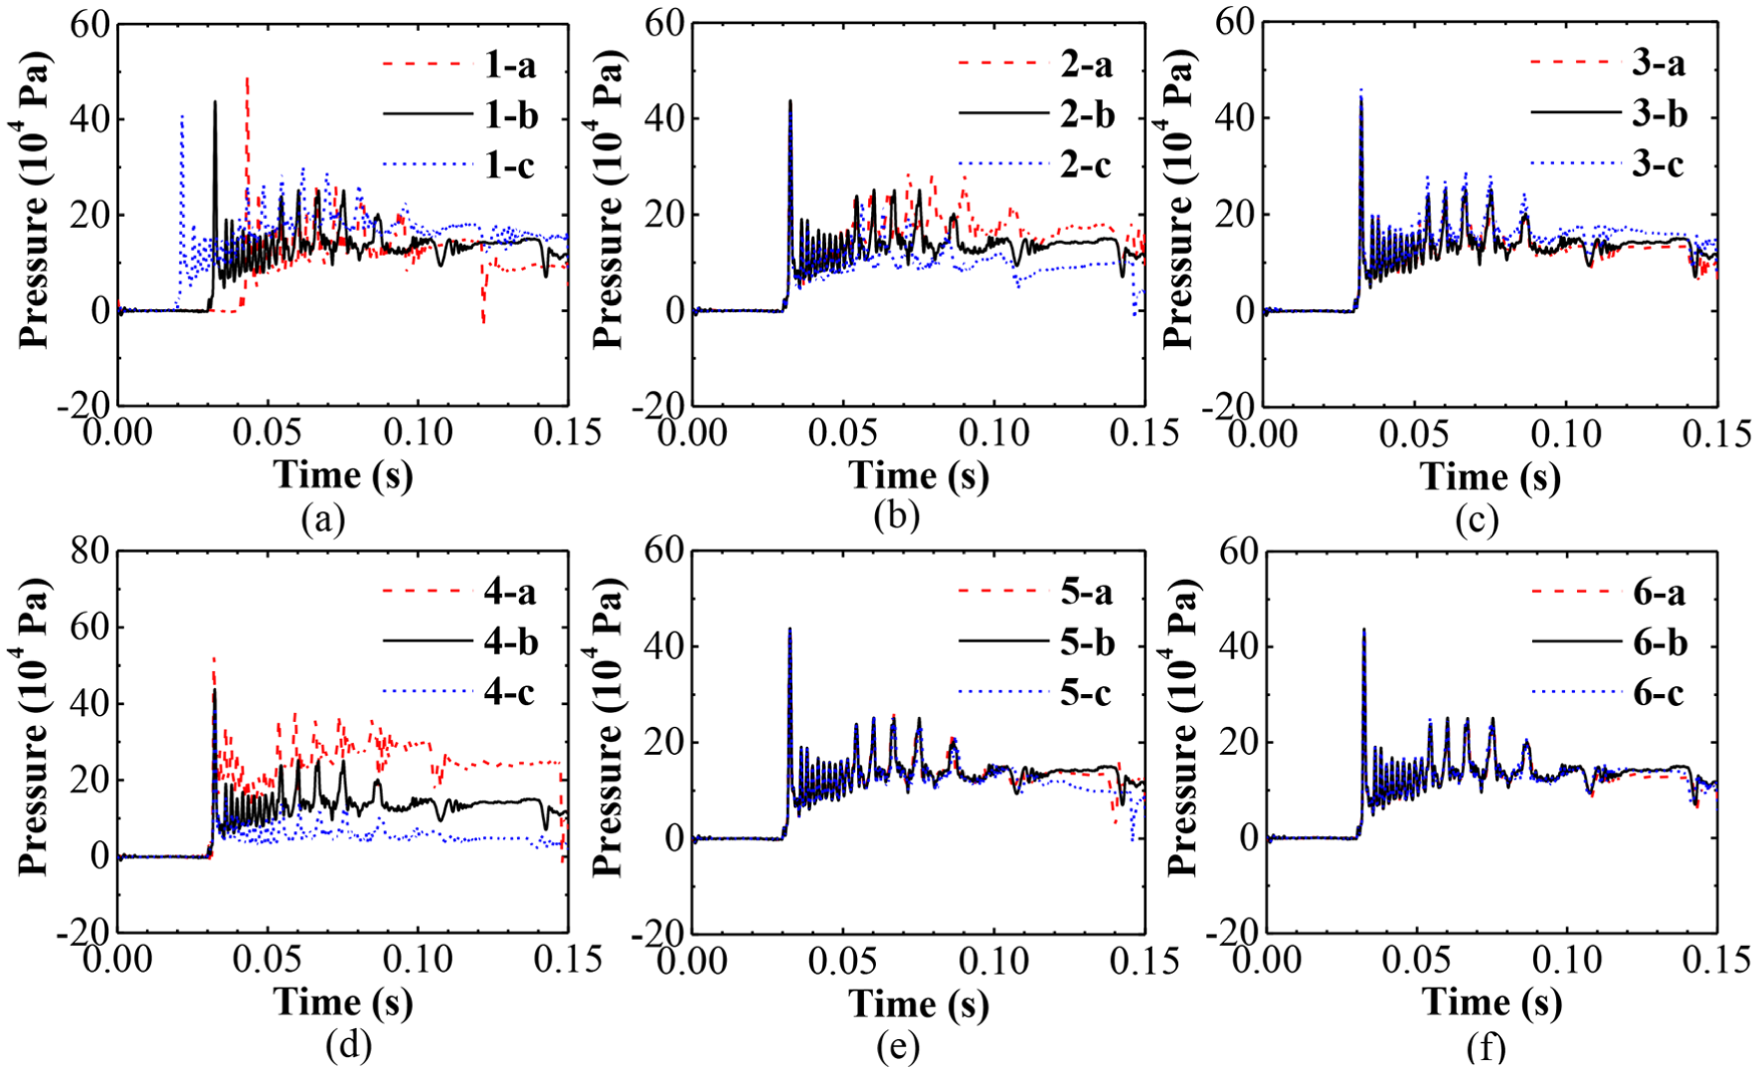
Changes in the stiffeners influence the pressure acting upon them. The pressure on stiffeners III and II are shown in Figures 22 and 23 when there is almost no direct water impact on stiffener I. Table 8 lists the peak values of pressure, which are hard to observe in some of the overlapping curves.
Pressure peak at PIII and PII in all cases.
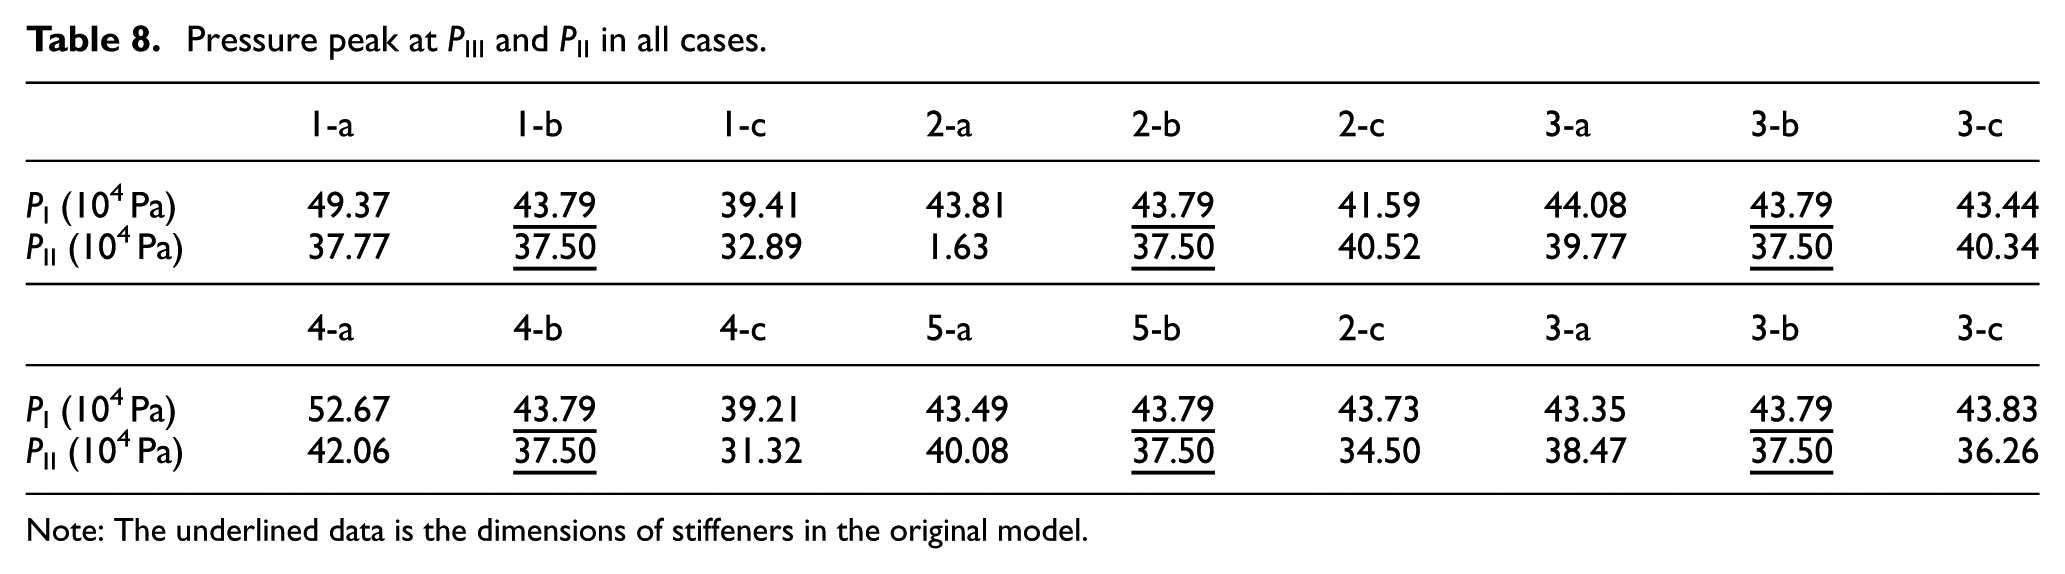
Note: The underlined data is the dimensions of stiffeners in the original model.

Pressure at position of PII for models with different values of: (a) wIII, (b) wII, (c) wI, (d) fIII, (e) fII, and (f) fI
The values of wIII mainly affect the pressure on stiffener III. A higher stiffener touches the water earlier at a lower velocity, so the impact pressure is smaller. The stiffener in this case also slows down the panel’s velocity earlier and decreases the pressure on stiffener II slightly. The influences of wII on the flange pressure are the opposite, because the velocity begins to decrease after stiffener III penetrates the water. Its velocity is higher when it touches the water earlier, which creates a larger impact pressure on it.
The values of fIII and fII also have some effects on flange pressure. When the flange is narrow, the local air cushion effect is weaker and impact pressure increases. The value of fIII also influences the pressure of stiffener II by changing the panel’s velocity. However, stiffener I still exerts little effects on the pressure on stiffeners III and II.
The stiffener dimensions also influence the stress—the effective stress values of stiffened plates with different web heights are compared in Figure 24. The value of wIII mainly affects the effective stress on the flange of stiffener III. A lower web decreases the effective stress when the distance between the flange and neutral surface is smaller; it also reduces the rigidity of the whole panel and increases the impact loads, which slightly increases the stress at other positions. The stress wave between 0.02 and 0.05 s at SIII was caused by the local impact pressure on the flange (Figure 22(a)), and its starting time is correlated to the starting time of local pressure. However, the durations of the main waves remain unchanged, which are same as that of the impact pressure at P.

Effective stress for models with different web heights.
The effective stress at SII decreases as the value of wII decreases, and the stress at SI and SP slightly increases. The wII value also affects the duration and the start moment of the stress peak due to changes in the impact pressure at P, as shown in Figure 21. However, the stress waves between 0.2 and 0.4 s at SIII remain basically unchanged.
Unlike the other two groups of stiffeners, a lower height of stiffener I increases the effective stress on its flange because the rigidity of the local panel surrounded by the primary stiffeners decreases. Stiffener III, which is perpendicular to stiffener I, shares more stress in this case. The value of wI has no effect on the pressure at P, so few stress changes occur at SII and SP.
The effective stress values of stiffened panels with different values of fIII, fII, and fI are shown in Figure 25.

Effective stress for models with different flange widths.
As discussed above, the dimensions of stiffener flanges have only a slight influence on the pressure at P but do affect the pressure sustained by the stiffeners themselves. They have a close relationship with their own stress values as well. The width of the stiffener flange is in an inverse proportional relationship to its effective stress when pressure at P is unchanged, while stress at other locations remain about the same. Increase in the flange width may increase the local stress, however, especially for stiffener III, which first touches the water surface. In case 4-c, the local load produces the maximum effective stress observable during the whole impact process. To this effect, increasing the flange width within a suitable range is an effective way to reduce local stress at the stiffener flange besides increasing its thickness, as pressure remains unchanged.
Air cushion effects
During the impact process, stiffeners prevent the air from escaping and exert significant effects of the cavity. As discussed above, the impact pressure at the center of the plate is mainly induced by the compressed air cushion rather than direct water slamming. In this subsection, we designed a numerical model in which the portion of the air is replaced by the void in the initial settings. We used this model to simulate vacuum conditions and validate the air cushion effect through comparisons to the original model. The water and the structure remain the same as the original model, and the drop height is 2.0 m. The impact pressure at P in the new model is illustrated in Figure 26 by comparison to the original model.

Impact pressure at P for models with and without air at drop height of 2.0 m.
Two pressure peaks exist for the model without air (vacuum). The peak values are about three times higher than those in the original model and only occur upon the interactions between the water and structure (Figure 27). Two moments are defined by these two peaks. The water jets caused by stiffeners lap on the plate at t = t1 while the remaining water rushes to the plate at t = t2. When comparing this figure to Figure 13, it can be observed that the impacts on the plate are of two different types. In the previous study, a cavity filled with air is formed by the main stiffeners, and the water force does not act on the plate center at all in the impact process while pressure is generated by the compressed air. The impact occurs only once the plate fully contacts with the water under vacuum conditions.

Two impact moments under vacuum conditions: (a) t = t1 and (b) t = t2.
The air cushion is of significant importance, so the properties of the air, which changes with the environment (e.g. temperature and altitude), may influence the impact pressure. The ambient gas properties also vary in the enginnering applications. To analyze the influences of gas density and sound velocity, numerical calculations for models with different gas properties are carried out.
Pressure values for models with different gas densities are shown in Figure 28. The pressure begins to increase at almost the same time point, but decreases to zero at various time points. The gas density exerts primary influence on the pressure increase rate and some influence on the maximum value. Smaller gas density generally leads to a longer pressure duration and a larger peak value, the only exception being density of 0.6 kg/m3. When the density doubles from 0.8 kg/m3 to 1.6 kg/m3, the maximum pressure increases by about 25%. Greater fluctuations appear in the later stages of impact when gas density is low. A larger pressure reduces the velocity of the panel, which decreases the pressure in turn. The extreme point of gas density is about 0.8 kg/m3 corresponding to the minimum pressure peak value.

Impact pressure at P for models with different gas densities.
Models with different sound velocities through the gas are built and calculated in Figure 29. Similarly, pressure begins to increase at about the same time but decreases to zero at various time points. The pressure duration increases as sound velocity decreases; the maximum value also decreases except for the sound velocity of 220 m/s. The maximum pressure value increases by 35% as the sound velocity increases by 60% (from 250 to 400 m/s). So the sound velocity is more sensitive to the pressure peak than the density. The curve becomes irregular in the later stages when sound velocity is low. The extreme point of sound velocity is close to 250 m/s.
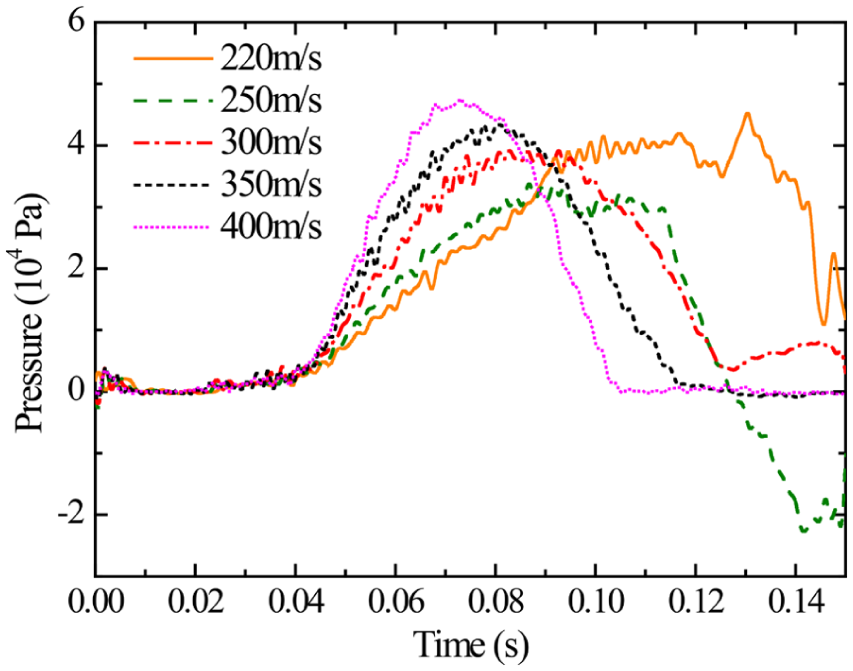
Impact pressure at P for models with different sound velocities in gas.
The impact pressure at P is transmitted by the air cushion. In the numerical model, Gruneisen state equation describes the gas properties reflected in equations (11) and (12). Relationships among pressure, density, and sound velocity in this water entry problem are reflected in these equations when the latter two are sufficiently high. Increases in density and sound velocity cause the pressure to increase in these equations, which causes corresponding increases in the growth rate and peak value of pressure. Sound velocity is more sensitive to pressure per the index numbers in the equations. Nevertheless, the pressure change would affect the impact velocity, and the changed velocity further influence the pressure in turn. When the density and sound velocity of the gas are sufficiently small, the pressure peak value may increase instead. Then the explanations by the equations are not suited for the case any more.
Conclusion
The hydrodynamic problem of the water impact on an elastic plate with stiffeners assigned to the water-attaining side was investigated in this study through experiments and explicit FEM with the MMALE method. Results of the numerical simulation are consistent with the experimental data for both impact pressure and effective stress.
The entire impact process was simulated via numerical approach. The impact begins as a closed cavity is formed by the crossing main stiffeners. As the panel continues to fall and the air is compressed further, the impact pressure at the center of the plate reaches its maximum while there is still no direct contact between the plate center and the water. In the later stages of the impact process, an air gap forms between the water and the flange of the stiffener. The trapped air escapes and the impact ends.
There are actually two types of impacts which occur in the whole process. The stiffener flanges and panel outside the main stiffeners are directly slammed by water, while the impact pressure at the center of the plate is mainly created by the wrapped air under it.
The results of this study can be summarized as follows:
The maximum impact pressure at the center of the stiffened panel increases linearly with the drop height. The maximum effective stress also increases linearly with the drop height, apart from the portion of the stress on the main stiffener flanges. The effective stress on the main stiffeners is influenced by the impact pressure acting on the plate, stiffener web, and flanges. The last produces an extra stress peak before the impact on the whole panel.
Three kinds of stiffeners are defined in this article through their sizes and directions. The height of stiffener III mainly affects the maximum value of impact loads at the center of the plate. The height of stiffener II primarily influences the cavity formation time and determines the start time and duration of the impact. The height of stiffener I, as well as the flange widths of all the stiffeners, exert slight effects on the pressure at the plate center.
The heights of stiffeners III and II influence the local pressure acting upon them as they touch the water surface at different velocities and time points. The pressure decreases as flange width increases. Stiffener I does not significantly affect local impact pressure.
Higher main stiffeners come with increased stress and they alter the overall stress values by changing the impact loads. Increase in the web height of stiffener I strengthens the local rigidity and decreases the stress acting upon the stiffener. Besides, the moment of the stress peak will hold off when the height of stiffener II is smaller, which is in keeping with the load. The widths of all the stiffener flanges are in an inverse proportional relationship to the effective stress acting upon them. So, it is an effective way to reduce local stress at stiffener flange besides increasing its thickness, and the pressure change can be ignored.
Effective air cushioning occurs in the impact onto the stiffened side. Compared with the numerical model in vacuum condition, the impact pressure at the center of the plate decreases by one-third due to the air cushion effect; the impact also occurs earlier and lasts longer.
Influences of gas density and sound velocity are explored as well. Larger density and sound velocity (when they are sufficiently high) increases the growth rate and maximum value of the pressure, and the latter appears to be more sensitive. Extreme points in the air properties corresponding to the minimum pressure peak values are identified; we calculated these values at 0.8 kg/m3 and 250 m/s, respectively.
There are two important points worth attention in the process of structural design under similar load cases: (1) An air cushion can not only decrease the impact pressure but also produce strong lateral pressure on the web of the main stiffeners which may cause excessive torsional deformation. Extra supporting components are necessary to strengthen these stiffeners. (2) The width of the flange should be increased only within a certain range to reduce the local stress on the main stiffeners, because the increased flange area increases the local impact loads which leads to a larger transient stress.
The results and conclusions gathered in this study are only suitable for the specific water entry problem in question. Slamming on the stiffened side is a complex issue and some of them happen when the water rushes to the structure. The distinction and equivalent condition of these two problems will be made clear in the future. Influences of roll angles on impact pressure have not been considered as well. They will be the focus in the future research.
Footnotes
Handling Editor: Seung-Bok Choi
Declaration of conflicting interests
The author(s) declared no potential conflicts of interest with respect to the research, authorship, and/or publication of this article.
Funding
The author(s) disclosed receipt of the following financial support for the research, authorship, and/or publication of this article: The work presented in this article has been carried out under the co-support provided by the Ministry of Education and the Ministry of Finance of China (Grant No. 201335), and by NSFC (51239007).