
Abstract
The accuracy of model-based gas turbine performance prediction, diagnosis, and prognosis is mainly determined by the precision of compressor thermodynamic model. This article proposes a novel component map adaptation method for gas turbine compressor modeling and gas-path diagnosis. First, compressor characteristic maps are generated through stage-stacking calculation. And the generated compressor characteristic maps are expressed in the form of polynomial functions by partial least squares regression. After integrating the fitting polynomial functions into the gas turbine performance model, the adaptation of characteristic maps in the performance model by gas-path measurements from the target engine can be made easily, through tuning the fitting polynomial coefficients. Application and analysis have illustrated that the proposed approach can effectively improve the accuracy of the gas turbine thermodynamic model during off-design performance calculation. The proposed approach exhibits a great potential to tune compressor characteristic maps for both compressor performance modeling diagnosis, with full consideration of their highly nonlinearity.
Keywords
Introduction
With application of gas turbine engines in the aviation industry, 1 gas turbine engines have attracted wide attention from the thermal power plants2,3 and the navigation industry, 4 due to many virtues, for example, rapid startup performance, wonderful load regulating competence, high thermal efficiency, and environmental friendly capacity. During operation of gas turbine engines, performance deterioration and abnormal events of their components may happen, due to the harsh operating conditions with high pressure, high temperature, and high thermal and mechanical stress within their components.5 The urging requirement for efficient gas turbine engine management by means of health monitoring, diagnostics, and prognostics has promoted engine users to develop high-accurate performance model. 6 Under current modeling technique, the precision of a gas turbine thermodynamic model mainly relies on the expression accuracy of the compressor characteristic maps, which are obtained from rig test bed or through computational fluid dynamics (CFD) and belong to proprietary information of original equipment manufacturer (OEM). 7
Gas turbine users may adopt generic compressor characteristic maps for engine performance modeling and therefore, the inaccuracy of the engine thermodynamic model may significantly influence the accuracy of diagnostics and prognostics, as the errors produced by the engine thermodynamic model may stay at the same level with the performance degradations caused by component deteriorations.8,9 So as to improve the reliability of the engine thermodynamic model, many efforts have been made by researchers and scholars, to propose efficient approaches to depict compressor characteristic maps. One part of efforts has been made to ensure the generalization of compressor characteristic maps with good interpolating and extrapolating performance, to make full use of off-design flow character and efficiency character on the characteristic maps. One of the most used approaches is lookup table method, whose core algorithm is linear or spline interpolation and extrapolation algorithm. Lookup table method has been widely used in almost every commercial thermodynamic calculating software, for example, Krawal-modular, IPSEpro, and Thermoflex. However, for this method, the sample data of compressor characteristic maps in the table should be dense and regular. Another popular method to express compressor characteristic maps is artificial neural network10,11 due to its highly nonlinear mapping competence. Artificial neural network can approximate any nonlinear functions by setting appropriate topology. However, the extrapolating performance of artificial neural network is often reported to be poor.12,13 Another reported method is an ellipse fitting algorithm, in which rotating ellipse equations are used to fit compressor characteristic maps through optimization process.14,15 The practical trial of this method has demonstrated that the fitting accuracy is highly decided by the selection of the initial values of the fitting polynomial coefficients, which is not easily determined. In order to let compressor characteristic maps match the target ones well, other part of efforts has been made to improve the accuracy of engine thermodynamic model by tuning compressor characteristic maps in externally linear-scaling8,9,16 or quasi nonlinear-scaling 17 manners, or by generating new ones based on gas-path measurements.18,19 The principle of these tuning methods is to let the thermodynamic model outputs match the target engine measurements by scaling the shape of a similar compressor characteristic maps through local or global optimization process. The accuracy of these tuning methods highly relies on the similarity of the shape of the to-be-adapted compressor characteristic map to the target one, and the shape of each constant speed line itself cannot be fully adapted. Gas turbine users may not even have the compressor characteristic maps of the fleet engines, as manufacturers are seldom willing to provide component characteristic maps to users. And then the stage-stacking technique becomes a useful and reliable method to generate the compressor characteristic maps, whose calculating procedure is based on the mean-line one-dimensional flow continuity equations together with the generalized stage characteristic curves.20,21 Case studies of the application of this approach can be found in the literatures.22–24 This method uses one set of generalized stage characteristic curves derived by fitting experimental data from extensive tests based on different types of compressor stages (e.g. subsonic, transonic, and supersonic stages). 20
In the paper, a novel component map adaptation technique for both compressor performance modeling and gas-path diagnosis is proposed to effectively solve the existing problems described above. The remainder of this article is organized as follows. In section “Basic theory,” the basic theory of compressor generalized nonlinear thermodynamic model is introduced, and subsequently, our proposed method is described in sections “Compressor map generation,”“Compressor map generalization and adaptation,” and “Compressor performance diagnosis.” The related case studies of the proposed approach are presented in sections “Application” and “Result and analysis,” followed by the conclusions in section “Conclusion.”
Methodology
Basic theory
The characteristics of a compressor in the form of Cartesian coordinate’s graph are often defined as compressor characteristic maps. Axial compressor characteristic maps are used in the gas turbine thermodynamic models for estimation of key component parameters, such as the pressure ratio
According to similarity theory


where
Considering


where
For the same compressor, the value of D is constant and equations (3) and (4) can be converted into equations (5) and (6)


As the change magnitude of the ratio of specific heat capacity k is relatively small due to the varying ambient temperature, pressure and relative humidity, equations (5) and (6) can be converted into equations (7) and (8)


In practical application, equations (7) and (8) can be further converted into generalized forms in equations (9) and (10), which represent compressor generalized nonlinear thermodynamic model


where

is relative corrected spool-speed

is relative corrected mass flow rate

is relative pressure ratio
Compressor map generation
Gas turbine users may not even have the compressor characteristic maps of the fleet engines, as manufacturers are seldom willing to offer component characteristic maps. And the stage-stacking technique becomes a useful and reliable method to generate the compressor characteristic maps. In order to fulfill off-design calculation, the related stage character for the target compressor need to be used to reconstruct the overall compressor characteristic maps. For gas turbine users, due to the lack of any stage geometric knowledge of the target compressor, the generalized stage characteristic map20 illustrated in Figure 1 is used. The generalized stage characteristic map is derived by fitting experimental data from extensive tests based on lots of compressor stages (e.g. subsonic, transonic, and supersonic stages).

Compressor generalized stage map.
The relationships between the relative pressure coefficient (


During compressor characteristic map generation, due to the lack of stage geometric knowledge of the target compressor, which is proprietary information of OEM, the necessary assumptions are made accordingly:
1. It is assumed that the generalized stage characteristic map illustrated in Figure 1 is suitable for all stages of the target compressor during off-design condition.
2. Stage pressure ratio is slightly decreasing from the inlet to the outlet of the target compressor, and the pressure ratios of all the stages on-design condition are distributed by adopting equations (14) and (15)


where
3. Stage isentropic efficiency is same for each stage on-design condition.
Finally, the characteristic maps of the entire compressor can be obtained through the stage-stacking of all the stages from the inlet to the outlet.
Compressor map generalization and adaptation
Due to the simplification of the compressor map generation, the inaccuracy of the engine thermodynamic model by the stage-stacking calculation is inevitable to some extent. In the paper, a component map adaptation technique is proposed to improve the accuracy of engine thermodynamic model from two aspects. One process is to express compressor characteristic maps with good extrapolating and interpolating performance and the other process is to tune the compressor characteristic maps to let the output of the engine thermodynamic model match the gas-path measurements from the target engine with full consideration of highly nonlinearity of compressor character, as shown in Figure 2.
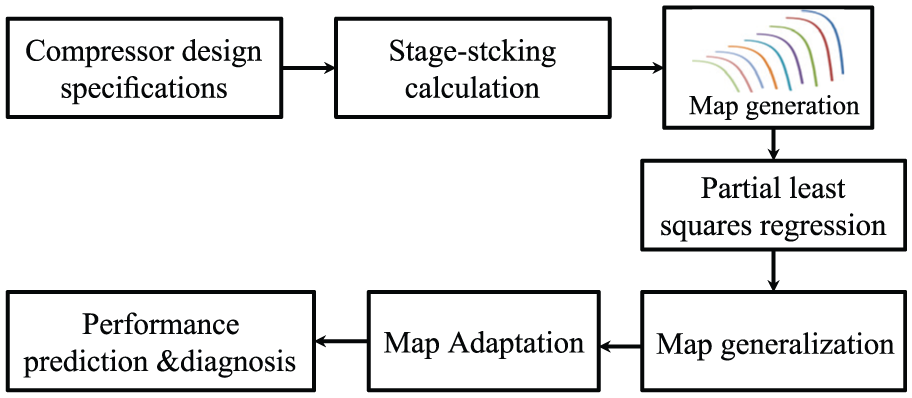
The flow chart of our proposed approach.
Compressor map generalization
Many methods have been proposed to improve the expression precision of compressor characteristic maps in terms of map generalization with good extrapolating and interpolating performance. We have discussed the relative merits of lookup table method, artificial neural network method, and other reported approaches in section “Introduction.” Our previous works25,26 have demonstrated that the partial least squares regression (PLS-R) is a useful and reliable method to be used in expression of compressor characteristic maps with the following two reasons: it shows excellent interpolation and extrapolation performance and there is no need to select initial values of the fitting polynomial function coefficients. PLS-R as an effective multiple statistical analysis tool, originated from chemistry field and proposed by S. Wold and C. Albno in 1983, combines the basic theories of canonical correlation analysis, principle component analysis, and multiple linear regression analysis. And the detailed description of the methodology of PLS-R can be referred to our previous works.25,26
After the generated compressor characteristic maps are fitted by PLS-R, the compressor characteristic maps can be expressed in the form of polynomial functions, as shown in Figure 3

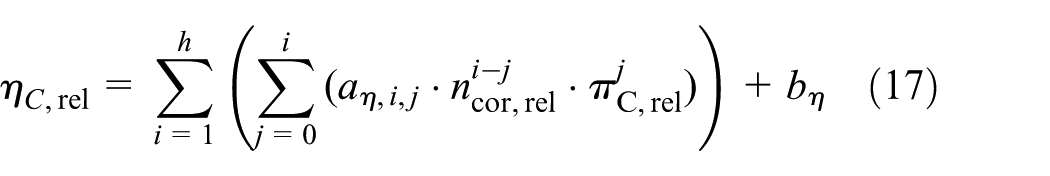
where

The expression of compressor characteristic maps in the form of polynomial functions by PLS-R.
Compressor map adaptation
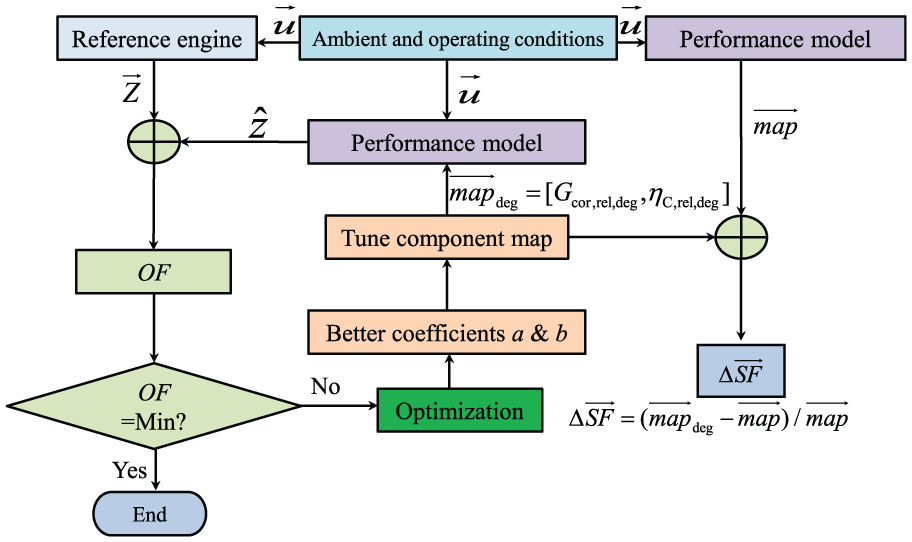
After integrating the fitting polynomial functions into the gas turbine thermodynamic model, the internal tuning of compressor characteristic maps based on gas-path measurements from the target engine can be made easily over adapting fitting polynomial function coefficients, as shown in Figure 4.

Flow chart of compressor characteristic map adaptation.
The adaptation of the fitting polynomial function coefficients a and b plays the main role in modification of the shape of each relative corrected spool-speed line with full consideration of nonlinearity of the compressor behavior. And the gas turbine compressor characteristic map adaptation process can be treated as an optimized identification problem, as shown in Figure 4.
Set the ambient conditions (ambient pressure, temperature, and relative humidity) and the operating control conditions of the engine thermodynamic model same as those of the target engine, and take the root mean squares
5
between the calculated gas-path parameters


where
The above compressor map adaptation can effectively remove the uncertainty introduced with engine-to-engine variability due to manufacturing and assembly tolerance, different disturbances, unknown initial conditions, and modeling simplifications due to the stage-stacking technique. After compressor map adaptation as shown in Figure 4 by gas-path measurements from the target engine, the compressor map in the thermodynamic model can match the real one in the target engine.
Compressor performance diagnosis
After compressor map adaptation as shown in Figure 4 by gas-path measurements from a clean/healthy/new target engine, the compressor map in the thermodynamic model can match the real one in the target engine. The adapted thermodynamic model can then be taken as benchmark model for gas turbine performance prediction and diagnosis. Gas-path analysis (GPA) method has been widely used to monitor gas turbine health and has become one of the key techniques in favor of condition-oriented maintenance strategy. When the level of degradation is small, it is always assumed that the characteristic maps of the degraded components (i.e. compressors, combustors, and turbines) will keep more or less the same shape as their original ones, based on the fact that the geometries of gas-path components do not change significantly after degradation. And thus the degradation of gas-path components can be represented by the externally linear shift of the characteristic curves on the maps.29,30 However, when the level of component degradation gradually becomes large, the actual component characteristic maps must undergo an inherent nonlinear shape change. In this phase, the diagnostic error will inevitably increase with the augment of the level of component degradation using traditional GPA method. In the paper, the proposed component map adaptation method can be further used for component performance diagnosis by tuning component characteristic maps with full consideration of their highly nonlinearity, as shown in Figure 5.
Flow chart of compressor performance diagnosis.
Normally, gas turbine overall health status is represented by component health parameters (i.e. compressor and turbine flow capacity indices and efficiency indices, and combustor efficiency index), which represent a shift of the characteristic curves on component’ maps due to degradation. 5 In the operation of gas turbine, the engine thermodynamic model can be adapted to keep track with target engine by the proposed method shown in Figure 5, to output compressor health parameters to capture the inherent nonlinear shape change of the degraded compressor characteristic maps.
At this stage, the objective of the diagnosis task is to deal with estimating the level of the component degradation of the target engine. The performance adaptation is once again implemented for performing the diagnostic task. For the initial adaptation of the engine model to the target engine, the entire set of historical operating data is used for establishing a benchmark model that represents the clean/healthy condition of the target engine. For diagnostic purpose, the above tuning process is performed discretely for every new set of engine measurement data, as seen from Figure 6.

Representation of the engine models implemented for the initial global adaptation and the adaptive local diagnosis processes.
Application
In the paper, a three-shaft marine gas turbine is chosen as the target gas turbine for validation of our proposed approach due to the availability, which is applied in Chinese Navy marine integrated power system, as shown in Figure 7.

The diagram of the three-shaft marine engine.
The generator electric power output is the key control parameter to let engine runs at a certain operating point, and the power turbine (PT) rotational speed is kept constant to maintain the constant electrical frequency. For more detailed description about this engine, readers can refer to Ying and colleagues.5,31 The engine gas-path instrumentation set is seen in Table 1.
Engine gas-path instrumentation set.

LPC: low-pressure compressor; HPC: high-pressure compressor; HPT: high-pressure turbine; LPT: low-pressure turbine; PT: power turbine.
To test our proposed approach, considering the information security for the Chinese navy, two engine thermodynamic models are used. The engine thermodynamic model for this three-shaft marine gas turbine established in our previous works5,31 is regarded as the reference engine, with its compressor characteristic maps obtained from experimental rig. The second engine thermodynamic model for this three-shaft marine gas turbine implementing the proposed approach for low-pressure compressor (LPC) and high-pressure compressor (HPC) modeling is referred to as the engine performance model. Performance design specifications of the reference engine are shown in Table 2.
Performance specification of reference engine.

LPC: low-pressure compressor; HPC: high-pressure compressor; LPT: low-pressure turbine; HPT: high-pressure turbine; PT: power turbine.
And the related compressor design specifications of the reference engine are shown in Table 3.
Compressor design specifications.

LPC: low-pressure compressor; HPC: high-pressure compressor.
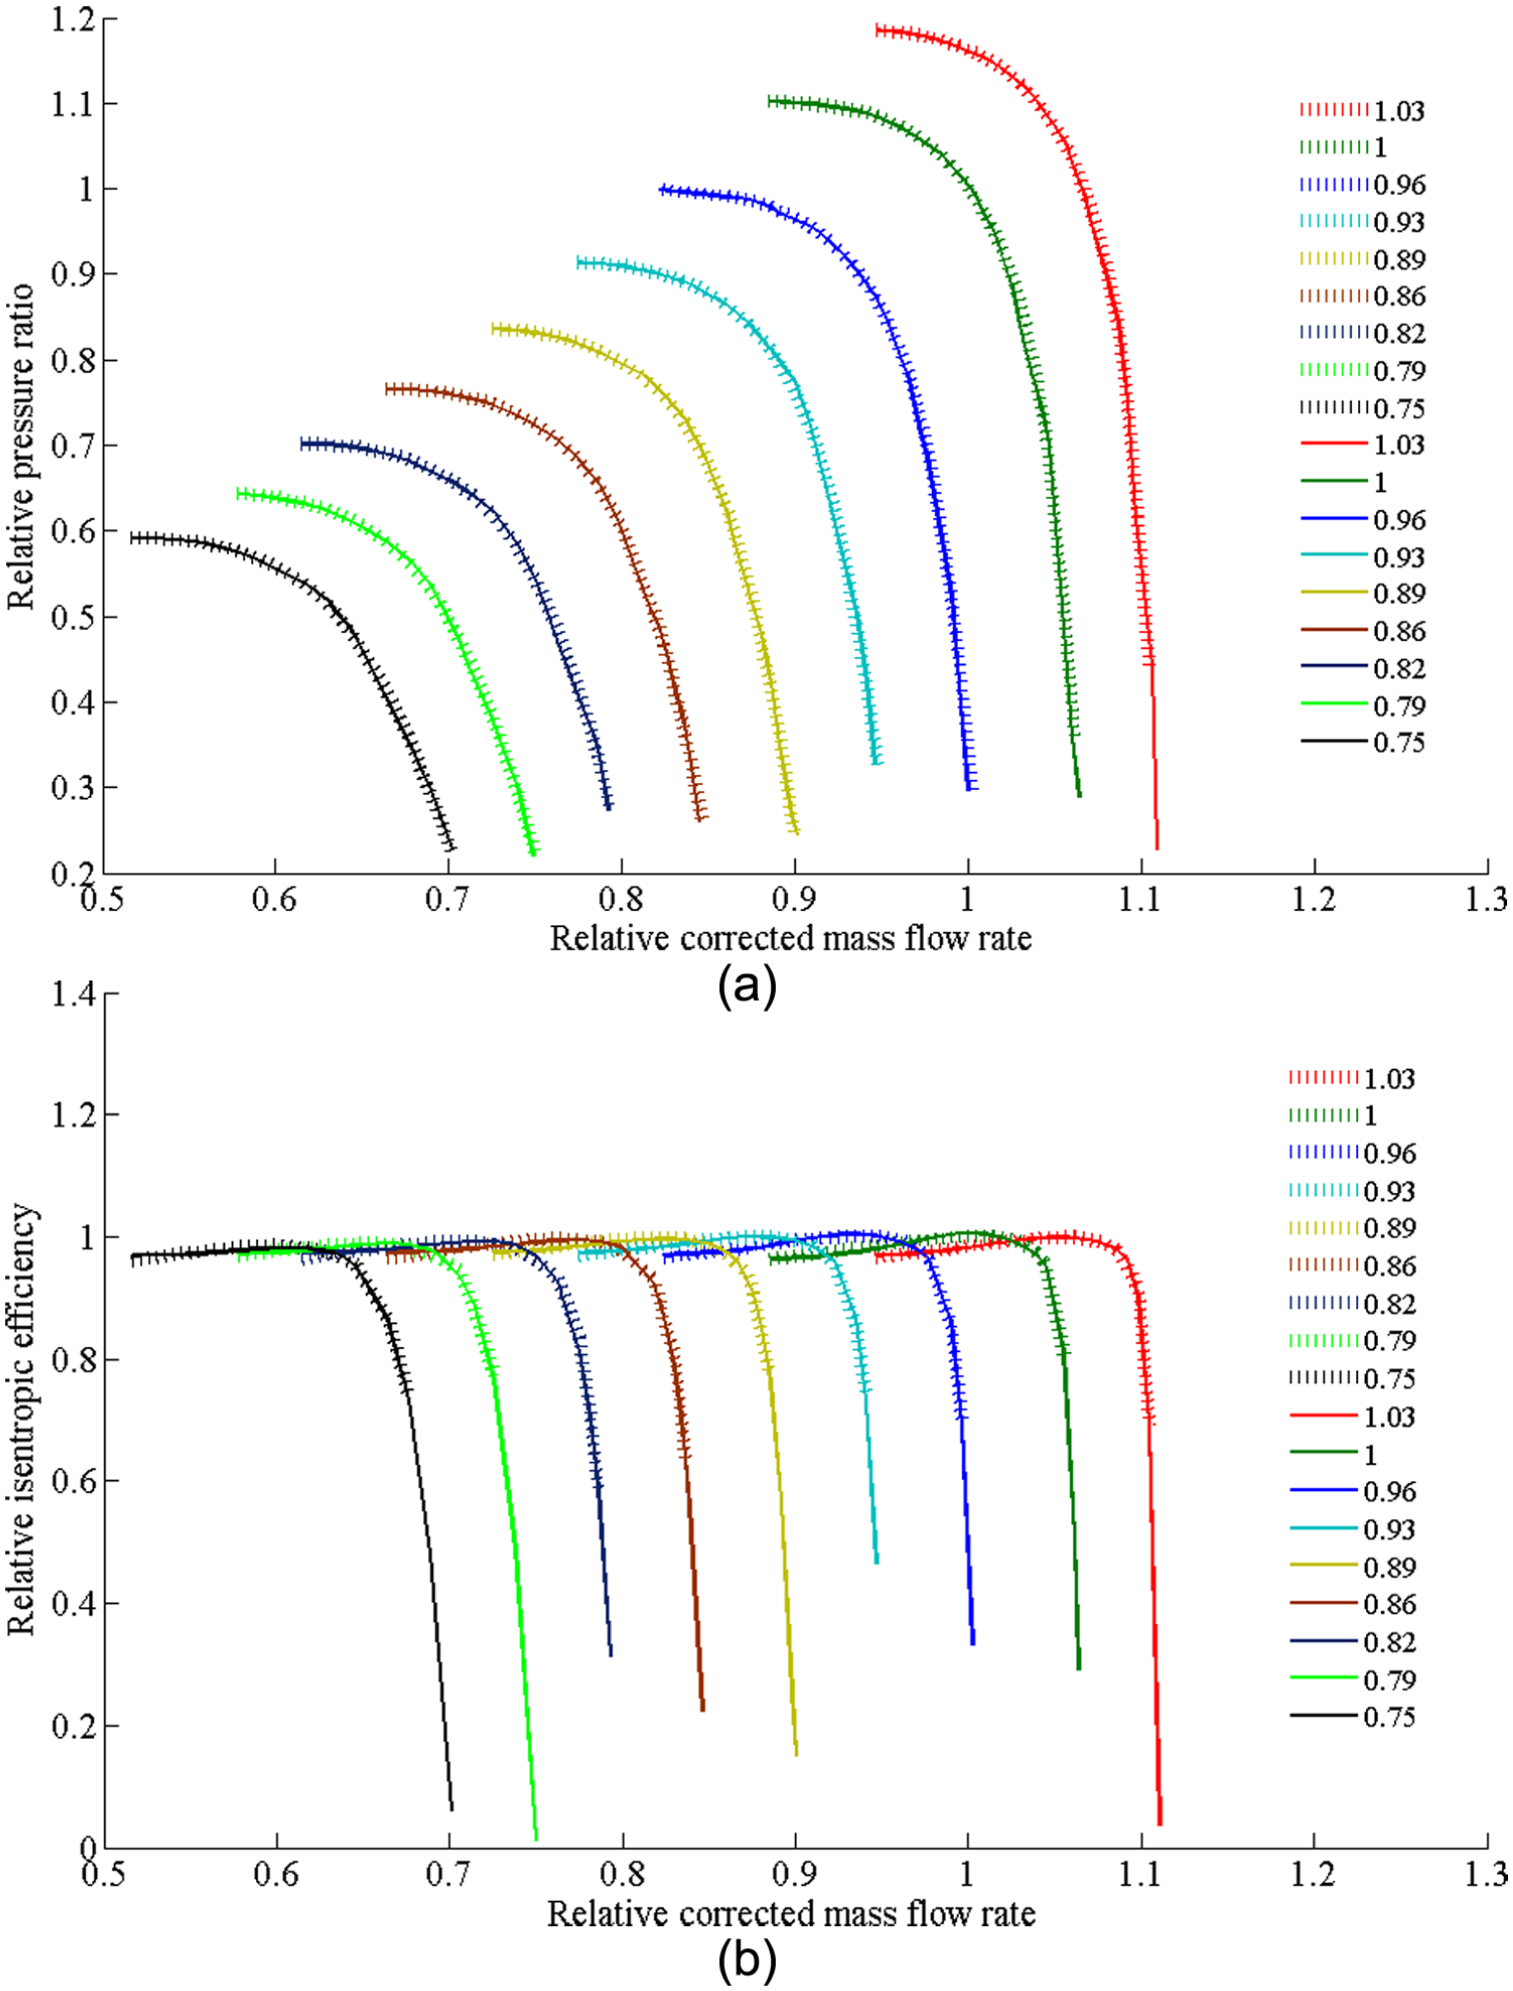
The compressor characteristic maps of LPC generated by the stage-stacking calculation based on compressor design specifications are shown in Figure 8. And the compressor characteristic maps of HPC are generated by the same way.

The compressor characteristic maps of LPC generated by the stage-stacking calculation: (a) flow character and (b) efficiency character.
Figure 8(a) shows the flow character of the relationship among the relative corrected spool-speed
The compressor characteristic maps of LPC fitted by PLS-R: (a) flow character and (b) efficiency character.
During compressor map adaptation, the objective function OF is minimized using the Nelder–Mead algorithm.27,28 The simultaneous adaptation of LPC and HPC characteristic maps in the engine performance model is performed based on the gas-path measurements shown in Table 1 from reference engine. Here six sets of gas-path measurements from reference engine with various load conditions at same ambient conditions are used to simultaneously tune the polynomial function coefficients of LPC and HPC characteristic maps internally (Figures 10 and 11). And then test cases with performance prediction and performance diagnosis are carried out to demonstrate the effectiveness of the proposed method in the following section.

HPT shaft rotational speed.

LPT shaft rotational speed.
Result and analysis
Test cases with performance prediction
Test cases with various load conditions at same ambient conditions
It is observed from Figures 9 and 12, the calculating error of the engine performance model before adaptation is rising when the operating point is gradually far away from the design operating point. After tuning the polynomial function coefficients of the compressor characteristic maps, the calculating error of the engine performance model can be reduced. The calculating results after adaptation match the measurements of the reference engine very well with the maximum relative error less than 1%. What is more, the calculating results of engine performance model before adaptation in Figures 8 and 9 also show the robustness of the stage-stacking calculation with the maximum relative error not more than 2%. The calculating errors produced by engine performance model before adaptation are mainly due to the necessary assumptions made to generate the overall compressor characteristic maps.

Relative error of measurable parameters with various relative load conditions at design ambient conditions.
Test cases with various ambient temperatures at same load conditions
It is observed from Figure 13 that the calculating errors of the engine performance model before adaptation are not evident with various ambient temperatures at nominal load conditions with the maximum relative error less than 0.35%, which also shows the robustness of the stage-stacking calculation. After adaptation, the calculating errors of the engine performance model are almost thoroughly eliminated.

Relative error of measurable parameters with various ambient temperatures at nominal load conditions.
From Figure 14, it can be seen that the calculating error of the engine performance model before adaptation is augmented with various ambient temperatures at 70% rated-load conditions with the maximum relative error more than 0.8%. After tuning the polynomial function coefficients of the compressor characteristic maps, the calculating errors of the engine performance model can be reduced. The calculating results after adaptation match the measurements of the reference engine very well with the maximum relative error less than 0.1%.
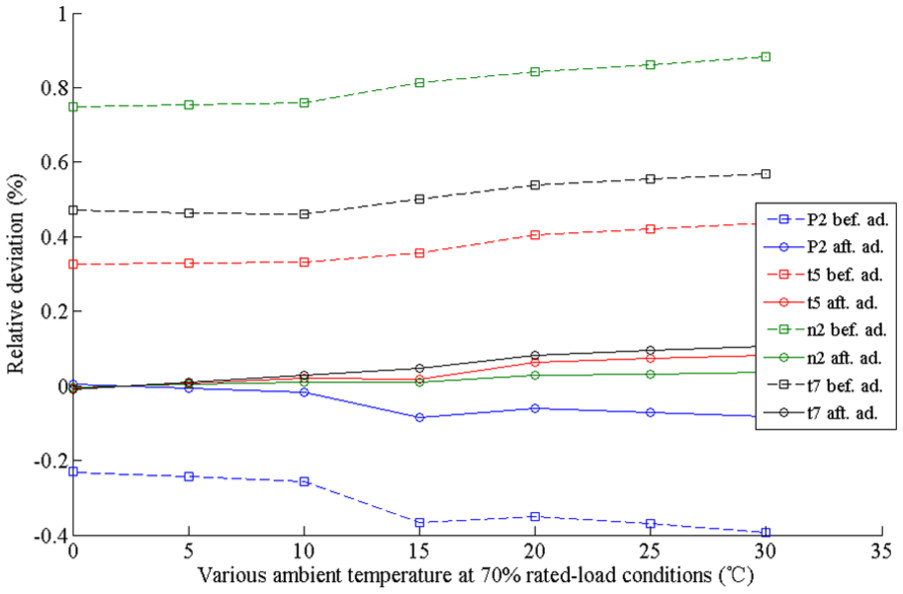
Relative error of measurable parameters with various ambient temperatures at 70% rated-load conditions.
Figure 15 shows the normalized values of initial and tuned polynomial function coefficients of LPC and HPC characteristic maps. Due to each polynomial function of flow character and efficiency character for LPC and HPC with the maximum power h of 6, there are totally 112 number of polynomial function coefficients, controlling the compressor map generalization and adaptation process. Here, the polynomial function coefficient from numbers 1 to 27 is

Initial and tuned polynomial function coefficients of compressor characteristic maps of LPC and HPC.
Test cases with performance diagnosis
After compressor map adaptation by gas-path measurements from a clean/healthy/new reference engine, the compressor maps in the engine performance model match the real ones in the reference engine during a wide range of off-design conditions. The adapted engine performance model can then be taken as benchmark model for gas turbine performance diagnosis. Because that compressor fouling is the most common degradation in the practical operation, here two test cases of compressor fouling, which were simulated by shifting of LPC characteristic maps of the reference engine, were used to test the effectiveness of the proposed method in compressor performance diagnosis.
As measurement noise is inevitable in actual gas-path measurements and can produce a side effect on diagnosis, measurement noise is introduced in the simulated gas-path measurements to make the analysis more realistic. The maximum measurement noise for different gas-path measurements is according to the information provided by Dyson and Doel, 32 as shown in Table 4.
Maximum measurement noise.

To reduce the side effect of measurement noise on diagnostic analysis, multiple gas-path measurement samples are obtained in the simulation and a 30-point rolling average31 was used to obtain an averaged measurement sample before the measurements are input to the diagnostic system. The mathematical expression for the rolling averaging is shown in equation (20)

where
And the implanted compressor degradations and diagnostic results are shown in Table 5.
Implanted compressor degradation and diagnostic results.

LPC: low-pressure compressor; GPA: gas-path analysis.
From Table 5, it can be seen that the proposed method can obtain better diagnostic results compared with traditional GPA method. Because the test cases of compressor degradation are simulated by externally linear shift of LPC characteristic maps of reference engine, the diagnostic results obtained by traditional GPA method are also acceptable when the level of component degradation gradually becomes large.
Conclusion
In the paper, a novel component adaptation technique for both compressor performance modeling and diagnosis is proposed. Some meaningful conclusions have been obtained through application and analysis, as follows:
The proposed approach can be applied without any stage geometric knowledge of the targeted compressor or any empirical knowledge about similar compressor characteristic maps.
After tuning the polynomial function coefficients of the compressor characteristic maps, the calculating error of the engine thermodynamic model can be minimized. The calculating results after adaptation match the measurements of the reference engine very well during a wide range of off-design conditions. And thus the corresponding expression mode of compressor characteristic maps may replace simple lookup tables and/or externally linear-scaled or quasi nonlinear-scaled maps in any engine thermodynamic model.
The proposed approach can effectively tune compressor characteristic maps for both compressor performance modeling and diagnosis with full consideration of the nonlinearity of the compressor behavior through internal adapting the fitting polynomial function coefficients based on gas-path measurements from target engine.
In this study, we focus a component map adaptation method for gas turbine compressor modeling and diagnosis, on the assumption that turbine model, combustor model, and auxiliary system model are accurate enough. The engine thermodynamic model for a three-shaft marine gas turbine established in our previous works is regarded as the reference engine, with its compressor characteristic maps obtained from experimental rig. The proposed method can be applied to any type of industrial gas turbine engine with axial-flow compressor. In a real situation, all engine components are deteriorated. The proposed approach can be extended to all main gas-path components in the gas turbine and further validation of the effectiveness of simultaneous diagnosis of all main gas-path components by the proposed approach should be carried out in the future work.
Footnotes
Appendix
Handling Editor: Jan Torgersen
Declaration of conflicting interests
The author(s) declared no potential conflicts of interest with respect to the research, authorship, and/or publication of this article.
Funding
The author(s) disclosed receipt of the following financial support for the research, authorship, and/or publication of this article: This research is supported by the National Natural Science Foundation of China (no. 61603239) and Shanghai Municipal Science and Technology Committee (no. 16020500700).