
Abstract
The flow pattern in the volute of a squirrel cage fan is complicated and non-axisymmetric. In this article, the original volute profile of a squirrel cage fan was cut to control and reshape this non-axisymmetric flow structure. An experimental study was conducted to investigate the effects of the cut volute profile on the fan aerodynamic and acoustic performance. The results showed that cutting the volute profile with a relative cut position of 90° and a secondary clearance of 0.02D2 could enhance the fan total pressure at the volume flow rate of 0.4QBEP by about 7% without affecting the noise level. High-precision steady computational fluid dynamics simulation was also carried out to reveal the flow mechanism of the performance improvement. The results indicated that cut volute profile caused an impeller-across flow structure in the vicinity of the second clearance and re-organized the circumference distribution of the impeller flow status. Both the impeller working capability and the overall flow losses of the cut fan increased compared to the original one but the increment of the former was greater. This explains why fan pressure improved under low-flow conditions.
Introduction
The squirrel cage fan is a kind of centrifugal fans with a large number of short chord forward-curved blades. Compared with other types of fans of the same size, squirrel cage fans are relatively quiet 1 and are thus widely applied in heating, ventilation, and air conditioning (HVAC) applications. However, the structure of such systems is usually complicated, which brings additional resistance to the fan and causes the fan operating in a relatively low flow rate. It is necessary and meaningful to improve the fan performance under such a low flow rate condition.
Kind and Tobin 2 tested the flow field in a squirrel cage fan by five-hole probes, and the results showed that the impeller flow status under low flow rate conditions seems to be different from those under high-efficiency conditions. Kawaguchi et al. 3 conducted a visualization experiment on the impeller flow field using a spark tracing method, and obvious reverse flow was captured in blade passages near volute tongue when the fan flow rate was low. Adachi et al. 4 measured the velocity magnitude and direction at the inlet and outlet of a series of impellers, and the results showed that the impeller outflow was non-uniform along the circumferential direction and a suppression of flow could be recognized near volute tongue. Cho et al. 5 measured the location and scope of the impeller-across flow by particle image velocimetry (PIV) and figured out that this flow structure could have a great impact on the fan performance and noise. All the studies above have shown that the actual flow around the squirrel cage impeller is highly complex and non-uniform, especially under the low flow rate conditions.
Previous researchers have attempted to obtain better performance by controlling this kind of non-axisymmetric flow behavior. Fukutomi et al. 6 and Wang et al. 7 designed the fan inlet nozzle eccentrically, which improved the fan’s aerodynamic performance by affecting the effective flow region of the impeller and weakening the flow vortex in the blade channels at particular positions. Wen et al. 8 further proposed an elliptical inlet nozzle to improve fan aerodynamic and acoustic performance. On the other hand, studies have focused on the design and improvement of the volute. Qi et al. 9 improved the design method of the volute profile using a non-uniform distribution of flow parameters on the volute inlet circle and achieved a better fan performance. Samarbakhsh and Alinejad 10 designed a half-cone volute to adapt the impeller outflow velocity distribution along the axial direction and achieved a higher pressure and efficiency. All the existing methods for controlling the particular flow field of the squirrel cage fan are similar: They involve manipulating the non-axisymmetric flow field by non-axisymmetric geometry structures. In this study, the original volute profile was cut to form a non-axisymmetric volute structure for achieving better performance than the conventional logarithmic spiral profile.
Research on the cut volute profile (CVP) is scarce. Hayashi et al. 11 compared several profile schemes and concluded that cutting the profile did not affect the performance, but the results from Wen et al. 12 indicated that the cut profile results in a reduction in total pressure and efficiency. These opposite conclusions might have been caused by the differences in profile design parameters and fan operation conditions between the two respective studies. The results of researches in this field are far from sufficient to draw any definite conclusion on how the CVP affects fan performance.
In this study, various CVPs with different geometry parameters were designed and investigated. Experimental tests were conducted to search the optimal CVP which would improve aerodynamic performance while keeping the noise level unchanged. Three-dimensional (3D) numerical simulations were also carried out to obtain the internal flow field of both original and modified fans, which helps to elucidate the effects of the CVP on fan performance and flow behavior.
Description of test fans
Original fan
The fan investigated in this article is a squirrel cage fan used in range hoods. Figure 1 shows the configuration of the original fan, and the main geometry parameters are given in Table 1. The rotating speed of the test fan is constant at 920 r/min, while the corresponding volume flow rate, total pressure, and efficiency at the best efficiency point (BEP) are Qv = 823.4 m3/h, Pt = 200.6 Pa, and η = 46%, respectively.

Configurations of the tested squirrel cage fans.
Geometrical parameters of the test squirrel cage fan.

Except for the fan, there are many components in the range hood for filtering liquid oil droplets in the cooking lampblack (such as lampblack baffle, and oil filter), which bring additional fluid resistance to the fan and reduce the fan flow rate. Moreover, all the range hoods in a building are connected to an exhaust pipe system. At mealtime, the synchronized running of a large number of range hoods will increase the backpressure in the exhaust pipe, which leads to a further reduction in each fan’s flow rate. A higher fan pressure helps the range hood to overcome the backpressure of the exhaust pipe system and discharge cooking lampblack efficiently. Therefore, pressure enhancement at low flow rate conditions is the primary goal in optimizing range hood fans.
Figure 2 shows the aerodynamic performance curves of the original fan. The static pressure of the fan decreased and total pressure gradually increased as volume flow rate decreased. The highest efficiency was obtained at a flow rate of Qv = 823.4 m3/h. The entire range of volume flow rate was divided into three regions for the convenience of discussion. Regions with flow rate lower than 0.8QBEP, between 0.8QBEP and 1.2QBEP, and greater than 1.2QBEP are defined here as low-flow, high-efficiency, and large-flow conditions, respectively. As the previous analysis, the tested fan was designed to operate under high-efficiency conditions but the actual operating point is likely to be located in the low-flow region. To this effect, fan performance under low-flow and high-efficiency conditions was the focus of this article.

Aerodynamic performance curves and operating condition definitions.
Modified fans with CVP
The volute profile of the original fan is a one-dimensional, logarithmic spiral profile that can be expressed as follows

where R2 is the outside radius of the impeller, and φ and αs are the scroll angle and spread angle of the volute profile, respectively.
Measurement from the work by Jiang et al. 13 showed that a large amount of air return to the volute through the impeller–tongue clearance under the low flow rate condition. Gong et al. 14 believed that a small tongue clearance could reduce separating losses and improve fan performance when the fan flow rate is low. However, the unsteady coupling between the airflow and the tongue is the main noise source in a centrifugal fan.15,16 A small tongue clearance is good for the fan aerodynamic performance but will also increase its noise. Therefore, a secondary clearance was constructed downstream to the tongue in this study by modifying the volute profile, instead of reducing the tongue clearance directly. In this way, the volute–impeller clearance could be reduced without impact the noise produced by the original volute tongue. The volute profile was modified, as shown in Figure 3. This modification is just like cutting a part of the original profile off, so we refer to the modified profile as a “CVP” from here on.
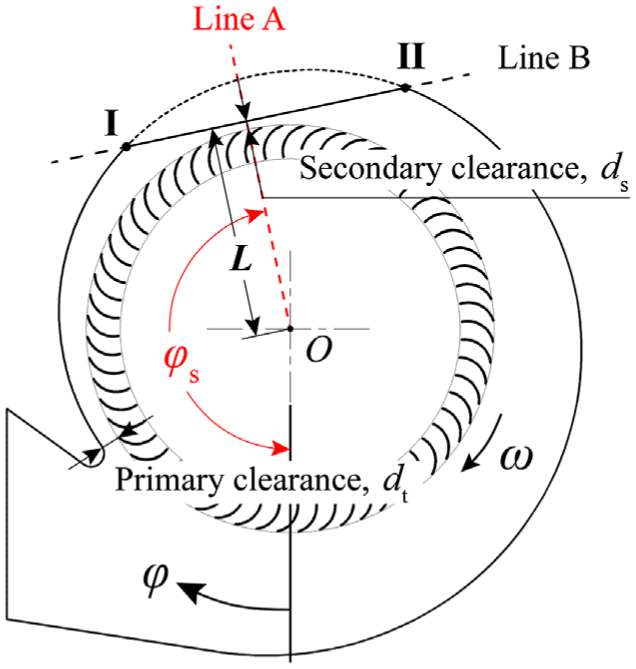
Schematic diagram of CVP.
As shown in Figure 3, positioning line A was drawn at a scroll angle of φs to determine the cutting position. Cutline B was then drawn perpendicular to line A at a distance of L from the center. Line B and the original profile intersect at points I and II, which divides the original volute profile into three segments. The mid-segment between points I and II was cut off and replaced by the cutline segment while keeping the first and the third segments unchanged; these three segments together form the CVP.
There is a new relative small clearance ds = L − R2 between the impeller and the cut profile, which is referred to here as the “secondary clearance,” while the impeller–tongue clearance is the “primary clearance.” Obviously, the scroll angle of the cut position φs and the secondary clearance ds determine the shape of CVP. The equation of the cut profile can be expressed as follows

where φ1 and φ2 are the scroll angles of segment points I and II, respectively.
CVP schemes with different cut positions φs were designed as shown in Figure 4. The cut position was given in the form of a relative scroll angle, which can intuitively express its relative position from the tongue

where Δφ = 30°i, i = 1, 2, 3, 4.

Cut volute profile schemes of different circumference cut positions: (a) Δφ = 30°, (b) Δφ = 60°,(c) Δφ = 90°, and (d) Δφ = 120°.
To further investigate the impact of secondary clearance ds on the performance and noise level, ds was gradually enlarged from 0.01D2 to 0.04D2 in each cut position. The scheme with the cut position Δφ and secondary clearance ds = εD2 was named as “Cut-Δφ–ε.”
All cut profiles were obtained by adding different plastic blocks into the original volute as shown in Figure 5. Each block was accurately fixed on the inner wall of the volute and constituted the mid-segment of the CVP. The blocks were manufactured by 3D printing technology, so the cut location Δφ and secondary clearance ds could be controlled precisely. The width of each block was equal to the volute width bv, while its length was dependent on its placement.

Manual manufacturing of cut volute profile: (a) plastic block installation position and (b) plastic block.
Investigate approach
Experimental apparatus
Both the aerodynamic performance and the A-weighted sound pressure level (SPL) of the original and modified fans were measured in our experiments. The aerodynamic performance was tested on an experimental platform referenced to international standard ISO 5801-1997: Industrial fans—performance testing using standardized airways. Figure 6 shows a sketch and the photograph of the experimental facility. 17 The outlet of the tested fan was connected to the facility, and the fan flow rate was controlled by a throttling device. The static pressure below the cell straightener was sensed by averaging four pressure taps located at 90° apart around the measuring duct.

Aerodynamic performance experimental setup.(a) Sketch of experimental system: 1—tested fan, 2—transition piece, 3—cross straightener, 4—diffusion duct, 5—cell straightener, 6—pressure taps, 7—throttling device. (b) Photograph of the experimental facility.
The volume flow rate of the test fan Qv was calculated by the following equation

where the parameters Δp, ρ, α, and d are the static pressure obtained by the pressure taps, the density of air, the coefficient of the throttling device, and the diameter of the throttling device, respectively.
The total pressure Pt, static pressure Ps, and total pressure efficiency η of the test fan can be calculated based on the experimental data by the following equation

where A represents the area of the fan outlet, k is a constant determined by the area ratio between sections A and B, and W is the overall power consumed by the tested fan.
The measurement uncertainties of the fan performance are affected by the accuracy of the pressure transducer as well as the way data are obtained. According to the introduction of the experimental facility, the accuracy of the pressure transducer is within 1% of the measured value. The measurement at each flow rate condition lasted for over 5 min to ensure that the fan flow field was stable. The performance data were calculated every 10 s and were averaged by 2 min before the final record. Therefore, the uncertainty of the aerodynamic performance measurement is estimated to be less than 1%.
The A-weighted SPL of test fans was measured under different operating conditions directly on the aerodynamic performance experiment platform, using a BSWA MP201 0.5-in free-field microphone with an accuracy of ±0.1 dB. The electric signals from the microphone are amplified and then processed by DH5922N dynamic data acquisition and analysis system. The microphone was set 1 m from the center of the inlet nozzle as shown in Figure 7. The background noise in the test room was measured to be about 50 dB, which is much lower than the noise of tested fans and thus exerted no influence on the comparison between measured results of different schemes.

Measurement position of microphone.
Numerical method
The 3D steady simulations were performed in a commercial computational fluid dynamics (CFD) software Fluent to obtain the flow field in the fans. As shown in Figure 8, the entire fluid region was divided into one rotating impeller region and four static regions. Both the inlet and outlet zones had been extended appropriately. The meshes of stationary regions in this model were composed of a polyhedral grid and the impeller meshes were formed by a structured hexahedral grid. Figure 9 shows the detailed mesh model of the fan. As the flow structures entering and exiting the impeller were the focus of this study, the mesh near the blades was appropriately refined as shown in Figure 9(c).

Geometrical model of the squirrel cage fan: 1—hemisphere inlet, 2—volute, 3—impeller, 4—outlet connector, 5—cylinder outlet.

Mesh model of the squirrel cage fan: (a) entire model, (b) tongue blade region, and (c) mesh section.
In this article, the inlet boundary condition was set as Mass flow rate, while the outlet boundary was Outflow to simulate the free outlet condition. The inlet airflow was supposed to be normal to the sphere inlet and fully developed, and the turbulence intensity and turbulence viscosity ratio are 5% and 10%, respectively. In addition, moving reference frame (MRF) was employed to exchange the information at the rotor–stator interface, which achieves a frame change across the interface without a relative position change. 18
The steady flow field was simulated by solving incompressible Reynolds-averaged Navier–Stokes equations, while the SST k–ω turbulence model 19 was used to calculate the turbulent viscosity reference to previous studies.20,21 The minimum grid spacing on solid walls was kept less than 5 × 10⁻³ mm to evaluate the viscous fluxes at the walls. This minimum grid spacing gives y+< 5 at the walls which satisfy the requirement of the SST k–ω turbulence model in low Reynolds number simulations. 18 The SIMPLE algorithm was used to perform the pressure–velocity coupling. Second-order upwind discretization was adopted for convection terms and central difference schemes for diffusion terms.
Mesh precision plays a crucial role in the process of numerical simulation. The grid number directly affects the calculation accuracy and time required to complete the computation. To ensure a reasonable mesh model, grid-independent studies were, respectively, performed on the impeller grid and stationary region grid. Figure 10(a) shows the variation of BEP static pressure with the mesh cell number in the impeller region. The grid with 7.9 million elements was fine enough to maintain constant pressure as cell number increased. Then, we refined the mesh of the stationary regions gradually to matching the impeller grid of 7.9 million cells, and the BEP pressure varied as shown in Figure 10(b). It is illustrated than the pressure nearly did not change when the grid number of stationary regions increased to about 4 million. Table 2 summarizes the cell number in each region of the final grid model.

Influence of mesh size on fan static pressure at best efficiency point: cell number in (a) impeller and (b) static regions.
Grid number of each region and entire model.

The experimental and numerical performance curves at both 920 and 1200 r/min are compared in Figure 11. The deviation between calculated pressure and experimental data is less than 10% of the measured value, which was common in the previous studies.12,22 To the knowledge of authors, this deviation was mainly induced by geometric differences between actual fan and simulation model. On the one hand, complicated geometry structures (such as motor and motor brackets) were simplified or even omitted in the simulated model to improve the mesh quality. On the other hand, blade deformation may occur since the blades were made of metal with a small thickness of 0.4 mm. The blade outlet angle of the actual fan might be less than the designed value which was adopted in the simulation model, which would weaken the fan performance and further increased the deviation between the experimental and the simulated data. Besides, the deviation was also caused by the errors of both the numerical simulation and the experimental test. Despite the deviation exists, the change trend of calculated pressure was still consistent with the experimental data well. The numerical result of the fan flow field will be analyzed qualitatively in this article.

Comparison of performance curves by numerical calculation and experimental measurement.
Results analysis and discussion
Effects on performance
Figure 12 shows the aerodynamic performance curves of four cut profile schemes with different cut positions. It was showed that higher pressure at low-flow conditions could be achieved by cutting the volute profile. The percentages in the improvement of the fan total pressure were calculated as follows
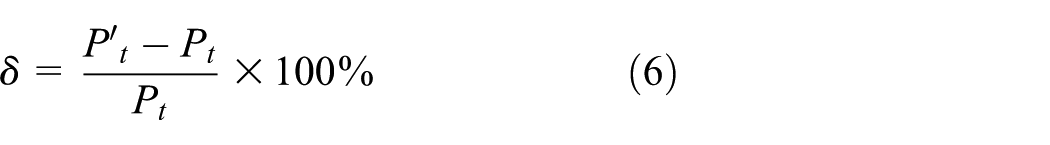
where
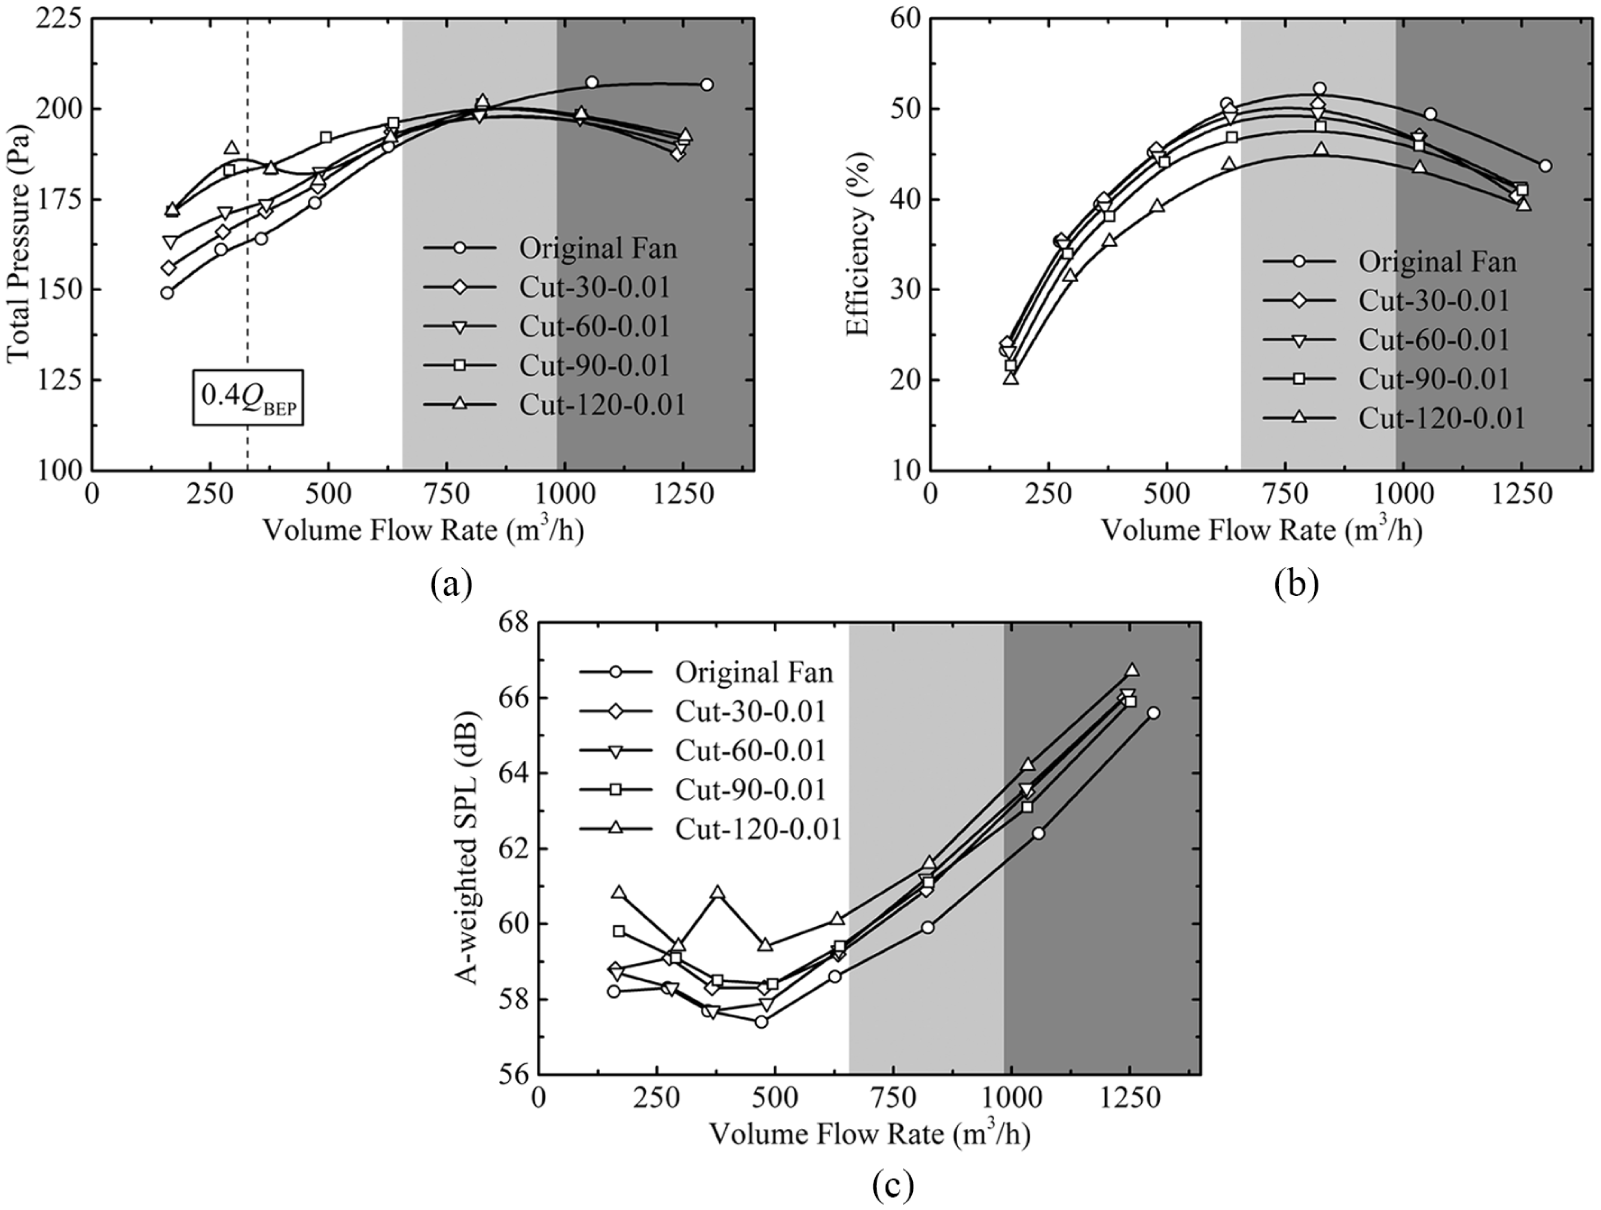
Aerodynamic and acoustic performance of CVP schemes with different relative cut positions Δφ: (a) total pressure, (b) total pressure efficiency, and (c) A-weighted SPL.
As shown in Figure 12(a), the total pressure of the fan was improved for about 12% in the flow rate of 0.4QBEP. In exchange, the pressure under the large-flow condition decreased lightly. As mentioned above, our concern was fan performance under high-efficiency and low-flow conditions. Thus, it was acceptable for us to sacrifice parts of pressure under large-flow conditions in exchange for an improvement in fan pressure under low-flow conditions.
Figure 12(b) shows the efficiency curve of each scheme. The modified fans were less efficient than the original fans. It is worth noting that the efficiency steeply declined when the relatively segmented position changed from Δφ = 90° to Δφ = 120°.
SPLs of each fan are shown in Figure 12(c). All modified fans showed poor acoustic performance, likely due to the small secondary clearance ds of 0.01D2. The sound level gradually increased as the relative scroll angle of cut location Δφ increased, and the noise level of the Cut-120-0.01 scheme was the highest.
The experimental results above indicated that CVP could enhance the fan pressure under low-flow conditions accompanied by reduced efficiency and increased sound level. The Cut-90-0.01 scheme and Cut-120-0.01 scheme showed marked pressure enhancement; considering that the efficiency degradation of the Cut-120-0.01 scheme is unacceptable, the relative scroll angle of Δφ = 90° was regarded as the optimal cut position to design a CVP.
Figure 13(a) and (b) shows the pressure and efficiency curves of schemes with different secondary clearance ds and constant Δφ = 90°. The results of the original fan are also provided as a reference. As clearance increased, the pressure enhancement under low-flow conditions diminished gradually and finally disappeared when ds reached 0.04D2. The pressure losses under large-flow conditions were only slightly affected. The efficiency curves were almost unaffected, but the overall change trend indicates that overall efficiency was improved as secondary clearance ds increased. Figure 13(c) shows the SPL of the various schemes, where the noise of the fan gradually decreased as ds increased. When the clearance increased to 0.02D2, the noise level under low-flow conditions was almost equal to the original level. Combined with the performance results above, it is indicated that larger clearance would reduce fan noise but would also diminish the pressure increment of low-flow conditions. As the optimal scheme, the Cut-90-0.02 scheme could enhance the fan pressure for about 7% in 0.4QBEP while maintaining an acceptable level of noise.

Aerodynamic and acoustic performance of CVP schemes with different secondary clearance ds: (a) total pressure, (b) total pressure efficiency, and (c) A-weighted SPL.
In summary, the performance changes brought about by the CVP are affected by two critical parameters: the relative scroll angle of the cut position Δφ and the secondary clearance ds. For a squirrel cage fan working under high-efficiency conditions, the aerodynamic performance is effectually maintained after applying this type of volute profile; this is in agreement with the conclusion made by Hayashi et al. 11 It was also found that even relatively small secondary clearance caused additional noise. For a squirrel cage fan working under low-flow conditions, the aerodynamic performance can be enhanced at the expense of efficiency; the noise caused by the secondary clearance is also controllable. In the volume flow rate of 0.4QBEP, the CVP scheme with a cut position of Δφ = 90° and secondary clearance of 0.02D2 could increase the fan total pressure by about 7% while maintaining the noise level unchanged.
This conclusion marks a departure from previous experimental results in which this type of profile reduced pressure at all flow rates. 12 According to our preliminary results, positive effects on the fan performance are only possible when the cut position and secondary clearance are within a specific range. We speculated that the Δφ and ds of the cut schemes investigated by them exceeded this effective range, thus negatively affecting fan performance.
Effects on flow field
Based on the numerical method described above, the steady flow field in the original fan and the Cut-90-0.02 scheme were calculated. In the following, the Cut-90-0.02 scheme was named as the cut fan for short. Flow behavior in a squirrel cage fan is non-uniform along the axial direction. The airflow is unable to turn radial immediately behind the inlet nozzle and separates near the shroud. 23 Therefore, the mid-span section of z/b = 46% was selected to demonstrate the changes in internal flow caused by the CVP. Figure 14 shows the locations of the cross sections.

Cross section selected for flow field analysis.
The section flow field of the original fan and the cut fan is shown in Figures 15 and 16. The fans operated at the volume flow rate of QBEP. In the original fan, as shown in Figure 15(a), the flow direction in the inlet area was mostly radial, and each blade channel of the impeller exhibited well intake conditions. The velocity at the impeller outlet was not absolutely uniform along the circumferential direction, as there was a high-speed area at the circumferential position upstream of the volute tongue. A slight reverse flow phenomenon can also be observed at the position of the volute tongue (area A). Compared to the original flow field, the most significant change of the flow field in the cut fan was concentrated in the vicinity of the secondary clearance. The airflow in the volute was forced to cross the impeller reversely before the secondary clearance (area B) and re-enter the impeller after (area C), forming pronounced impeller-across flow behavior. The blade channel velocity in area C and areas downstream of area C increased a lot, making the flow pattern around the impeller more non-axisymmetrical.

Cross-sectional flow field at QBEP: (a) original fan and (b) cut fan.

Pressure field in the vicinity of the secondary clearance and velocity vectors in the blade channels at QBEP: (a) original fan and (b) cut fan.
Figure 16 illustrates a close-up of the pressure field in the vicinity of the secondary clearance as well as the velocity vectors in the blade channels. As analyzed before, the air entered the impeller radially in the original fan. The direction of the intake airflow did not match the blade inlet angle, resulting in a large angle of attack. Flow separation on the blade suction surface occurred at the leading edge, forming a vortex at the suction surface, which could be observed in each blade channel shown in Figure 16(a).
The airflow across the impeller caused by the CVP is shown clearly in Figure 16(b). The contraction of the cut profile at the upstream of the secondary clearance resulted in a high-pressure region in the volute. Under the effect of the pressure gradient, volute airflow passed through the blade channels reversely and back to the inlet of the impeller. Obvious backflow could be observed in blade channels near area B. Meanwhile, the volute expanded rapidly after the secondary clearance, which created a negative pressure area at the impeller exit region (area C). The intake airflow, including the backflow from area B, passes through the impeller here. The impeller-across airflow entered the impeller tangentially, reducing the angle of attack in area C significantly, and the flow status in these blade channels was also smoother.
Figure 17 shows the flow field of the original fan and the cut fan at 0.4QBEP. The flow behaviors under low-flow conditions were pretty different from those under high-efficiency conditions. Larger reverse flows occurred in area A, which used to be the main outflow area when the fan worked under high-efficiency conditions. This portion of airflow crossed the impeller and re-entered between areas B and C. Figure 17(b) shows the flow field in the cut fan at the same conditions. The re-entry region moved forward from the original position to area C, and the velocity in blade channels downstream of area C is also higher.

Cross-sectional flow field at 0.4QBEP: (a) original fan and (b) cut fan.
Figure 18 shows a close-up of the pressure field in the vicinity of the secondary clearance as well as the velocity vectors in the blade channels. As in QBEP, CVP caused a backflow at area B. The airflow returning from the volute tongue and the airflow returning from area B both enter the impeller at area C, resulting in a smooth flow status in blade channels at area C.

Pressure field in the vicinity of the secondary clearance and velocity vectors in the blade channels at 0.4QBEP: (a) original fan and (b) cut fan.
Figure 19 shows the distribution of the velocity radial component at impeller exit surface. The location of the volute tongue and the secondary clearance are marked by red lines. In both QBEP and 0.4QBEP, the velocity distribution in tongue reverse region between 0° and 60° did not change a lot, while the velocity distribution varied near the secondary clearance, a reverse region near 120°, and a high velocity re-entry region near 180° could be observed on each side of the red line of secondary clearance in the cut fan. The re-organization of the impeller outflow by the CVP is apparent. Compared to the original fan, the impeller outflow in the cut fan increased in the entire impeller downstream of the secondary clearance.

Distribution of the velocity radial component at impeller exit surface.
According to the analysis above, the flow status of the impeller along the circumferential direction was re-organized markedly by CVP. However, the impact of these changes on the overall workability of the impeller is still unknown. In the previous study, average pressure at a series of critical flow sections was used to explain the energy transformation in the fan. 12 Figure 20(a) illustrates the definition of the corresponding flow sections in our investigation. Sections 3, 4, and 5 represent the impeller inlet, the impeller outlet, and the volute outlet, respectively. Mass-weighted averaged total pressure and static pressure on these sections at 0.4QBEP are shown in Figure 20(b), and the difference between the total pressure and the static pressure represents the dynamic pressure on the section. In the original fan, total pressure and dynamic pressure increased significantly between sections 3 and 4 due to the impeller’s impact on the air. When airflow passed the volute, the total pressure decreased slightly due to the flow resistance of the volute, and most of the dynamic pressure had been converted to static pressure. The variation of pressure with sections in the cut fan is similar to the original fan. On the one hand, the increment of both the total pressure and the dynamic pressure between sections 3 and 4 is greater than the original fan, which suggested that the overall working ability of the impeller was enhanced. On the other hand, the pressure drop in the volute also increased, which indicates that an unsmooth sectional area transition of the cut volute, after all, still caused additional flow losses.

Pressure at different sections. (a) Section definition: 1—inlet, 2—volute inlet section, 3—impeller inlet, 4—impeller outlet, 5—volute outlet; (b) averaged static pressure and total pressure.
The total pressure between sections 3 and 4 was defined as Pt_imp, which presented the working ability of the impeller. The overall total pressure drop of the static fluid regions was defined as Pt_loss, which was the sum of pressure drop between each two adjacent sections (except the inlet and outlet section of the impeller)

Figure 21 shows Pt_imp and Pt_loss of both fans under different conditions. It was shown that the impeller of the cut fan could transmit more energy to the air. However, this part of energy could not be efficiently recovered in the volute, and the total flow losses in the cut fan also turned to be greater than the original fan.

Working ability rise and pressure losses brought on by cut volute profile in different volume flow rates. (a) rise of impeller working ability Pt_imp, (b) rise of overall total pressure drop Pt_loss, and (c) comparison of ΔPt_imp and ΔPt_loss.
The increment of Pt_imp and Pt_loss brought on by CVP was defined as ΔPt_imp and ΔPt_loss, respectively. The variation of Pt_imp and Pt_loss with the volume flow rate was shown in Figure 21(c). Under low-flow conditions, ΔPt_imp was greater than ΔPt_loss and thus was beneficial to the fan performance. As volume flow rate increased, ΔPt_loss increased gradually, while the ΔPt_imp decreased. The two curves have a cross point near the volume flow rate of 850 m3/h. On the right side of the cross point, the increment of the impeller working capability ΔPt_imp was no longer sufficient to compensate for the additional flow losses brought on by the CVP, which is why the fan pressure decreased under large-flow conditions.
Conclusion
In this study, the volute profile of a squirrel cage fan was cut to control and reshape the non-axisymmetrical flow behavior in the volute. The effects of the CVP on fan performance and flow field had been experimentally and numerically investigated. For the squirrel cage fan studied in this article, the following conclusions had been obtained:
Experimental results indicated that CVP could enhance the fan pressure under low-flow conditions but at the same time led to pressure decline under large-flow conditions. The P–Q performance curve of the cut fan thus became flatter than that of the original fan. Besides, CVP would also lead to other negative effects such as efficiency reduction and noise deterioration. However, experimental results showed that the reasonable design of the cut position and cut depth could maximize the effect of pressure enhancement while controlling the negative effects within the acceptable ranges. In the volume flow rate of 0.4QBEP, CVP with a relative cut position of 90° and a secondary clearance of 0.02D2 improved the fan total pressure by about 7% without affecting the noise level.
Comparison between the simulated flow field of the original fan and the cut fan illustrated that flow behaviors in the volute changed a lot. The secondary clearance created by CVP interrupted the continuous flow field in the volute. Airflow in the volute thus reversely passed the blade channels at the upstream of the secondary clearance and then re-entered the impeller at the downstream, which formed a unique impeller-across flow structure. The distribution of impeller pattern along the circumference direction turned to be more non-axisymmetrical and the velocity at impeller exit surface increased.
By analyzing the average pressure at a series of critical flow sections along the flow direction, the re-organization of impeller flow status caused by CVP could not only enhance the working ability of the impeller remarkably but also led to additional flow losses. The fan pressure decreased under large flow rate conditions because the additional flow losses are greater than the increment of impeller working ability. When the flow rate was low, the impeller pressure rise enhancement exceeded the additional pressure losses, which led to the improvement in fan pressure.
The volute cutting strategy and the specific scheme parameters in this article are worthy of reference when it is necessary to increase the pressure of squirrel cage fan under low flow rate conditions.
Footnotes
Acknowledgements
Great appreciations were expressed to the partners in Fotile for providing experimental platform and assistance. The authors also appreciate all the other scholars for their advices and help in the process of improving this article.
Handling Editor: Chun-Liang Yeh
Declaration of conflicting interests
The author(s) declared no potential conflicts of interest with respect to the research, authorship, and/or publication of this article.
Funding
The author(s) disclosed receipt of the following financial support for the research, authorship, and/or publication of this article: This research was supported by National Key Research and Development Program of China (2017YFC0211505) and the Fotile Kitchen Ware Corporation.