
Abstract
This study presents an experimental investigation into the behavior of lightweight aggregate concrete columns confined with transverse steel reinforcement. Twelve reinforced specimens were tested under monotonically increasing axial compressive load. Test variables considered in the study include the amount of transverse steel and the tie configuration. The results indicated that the crack pattern of confined lightweight aggregate concrete columns exhibited significant differences with the normal weight concrete specimens expressing that the failure planes passed through the coarse aggregates or occurred at the interface between the coarse aggregate and cement paste. In addition, the brittle behavior of lightweight aggregate concrete can be significantly improved by reasonably selecting the tie configuration and adding the amount of lateral steel resulting in an excellent ductile behavior. Columns confined by rectangular hoops with cross ties provide sufficient axial load–carrying capacity and ductile behavior when compared with those of specimens confined by other tie configurations during the test. An analytical model that considers the confinement effectiveness factor (λt) and coefficient k was proposed to predict the peak stress and the corresponding strain of the specimen. The model demonstrates good predictive capability when it is compared with selected models.
Keywords
Introduction
Lightweight aggregate concrete (LWAC) involves several accepted advantages including better durability, higher fire-resistant capacity, and lower permeability, and it effectively reduces dead load and dimension of elements and improves seismic resistance capacity of building structures.1,2 Therefore, it is widely used in bridge engineering and high-rise building with good prospects for applications. However, the lower elastic modulus and significant shear brittle character of LWAC restrict its application in main vertical bearing components such as columns. In addition, the toughness and ductility of the vertical bearing components play an important role in preventing sudden collapse of building structures. Therefore, it is generally recommended that it is necessary to provide a reasonable lateral confinement to effectively improve the toughness and ductility of confined columns.
Over the last four decades, several studies focused on examining the behavior of lateral confined normal weight concrete (NWC) columns that are subjected to concentric loading. The concrete compressive strength,
There is a scarcity of published experimental results on the axial compressive behavior of confined LWAC columns. Currently, extant studies do not adequately investigate the stress–strain behavior of confined LWAC. Martinez et al. 12 tested 27 LWAC columns confined by circular spirals under concentric loading and established relationships between the lateral confined force and the peak stress, peak strain, and ductility ratio. Basset and Uzumeri 13 determined the behavior of confined high-strength LWAC in full-size columns by considering the effects of selected variables, such as longitudinal steel distribution and tie configuration, tie steel spacing, amount of tie steel, and amount of longitudinal steel, on confinement effectiveness. Bjerkeli et al. 14 studied strength, ductility, and creep behavior of confined LWAC columns under long-term load and indicated that the behaviors of confined LWAC columns are significantly different from those of unconfined specimens. Khaloo and Bozorgzadeh 15 proposed calculation formulae for peak stress and peak strain and also established a stress–strain model based on an experiment that tested eight high-strength LWAC columns confined with composite elliptical spirals. Furthermore, Hlaing et al. 16 analyzed the influence of concrete strength and the lateral reinforcement ratio and revealed that reducing the tie spacing and increasing the stirrup diameter effectively improved the deformation capacity of confined specimens. Finally, a formula for calculating the elastic modulus of confined LWAC was deduced. A comprehensive overview of extant literature indicates that there are relatively few experimental investigations examining the axial compressive behavior of confined LWAC column. Most previous studies involved modifying theoretical analyses from the NWC specimens, and thus, they lack adequate testing support and a clear theoretical basis.
This study reviews the preparation and testing of 12 confined LWAC columns that are subjected to short-term monotonic concentric loading. Test variables include lateral reinforcement ratio and tie configurations. Test results provide data to determine the axial compressive behavior of confined LWAC columns and mainly include failure modes, load-carrying capacity, ductility, stress–strain behavior, and strains of lateral stirrups. Furthermore, an analytical model is proposed to predict the behavior of the specimens and provide references for the theoretical analysis of the confined LWAC columns.
Experimental program
Test specimens
The specimens tested included 12 confined columns with a square cross section corresponding to 250 mm × 250 mm × 750 mm and were divided into four series denoted as A to D to distinguish among the four different configured columns (Figure 1). The concrete cover of each specimen was designed with a thickness of 15 mm. Table 1 summarizes the details of the specimens, and Figure 2 shows the lateral reinforcements used in each specimen. The specimens are identified in Table 1 by the first letter A–D that represents the cross-sectional tie configurations with the following letters H or S to refer to the hoop or spiral lateral reinforcement, respectively. Subsequently, the first numbers 1.97 or 2.80 refer to the lateral reinforcement ratio and the last numbers define the tie spacing.

Cross-sectional dimensions for specimens: (a) series A, (b) series B, (c) series C; (d) series D.
Details of the test specimens.

Ag denotes the total cross-sectional area of specimen; Ac denotes the confined area bounded by the centerline of lateral reinforcement.

Reinforcements used in the confined LWAC specimens: (a) series AH, (b) series AS, (c) series BS, (d) series CH, (e) series CS, and (f) series DH.
The longitudinal reinforcements for series A, B, and D were maintained at a constant ratio of 1.51%, while the corresponding ratio for series C was 1.45%. Two different lateral reinforcement ratios were utilized, namely, (1) 1.97% for normally confined concrete and (2) 2.80% for sufficiently confined concrete. The center-to-center spacing of each specimen is selected as shown in column six of Table 1 to uniformly maintain the two levels of lateral reinforcement ratios among the four groups of confined columns.
Materials
The LWAC used in the study was designed with observed wet densities ranged from 1952 to 1977 kg/m3 with corresponding oven-dried densities ranging between 1800 and 1827 kg/m3. Coarse aggregate used in the mix consisted of expanded shale with a cylinder compressive strength of 10.5 MPa while the fine aggregate consisted of normal weight natural sand obtained from a local river. The maximum sizes of coarse and fine aggregates corresponded to 16 and 5 mm, respectively. In addition, ordinary Portland cement 42.5R, fly ash, high-range water-reducing admixture (HRWRA), and tap water were also used in the mixture. The mixture proportion of concrete is shown in Table 2. It is necessary to sufficiently pre-wet the expanded shale aggregates prior to mixing to mitigate the effects of the water absorption and desorption properties on the concrete mechanical capacities. Three 100-mm cubes and six 100 mm × 100 mm × 300 mm prisms were reserved for each specimen from the same batch to obtain tube compressive strength (fcu), tensile strength (ft), and elastic modulus (Ec) of the concrete as listed in Table 3.
Mix proportion of LWAC.
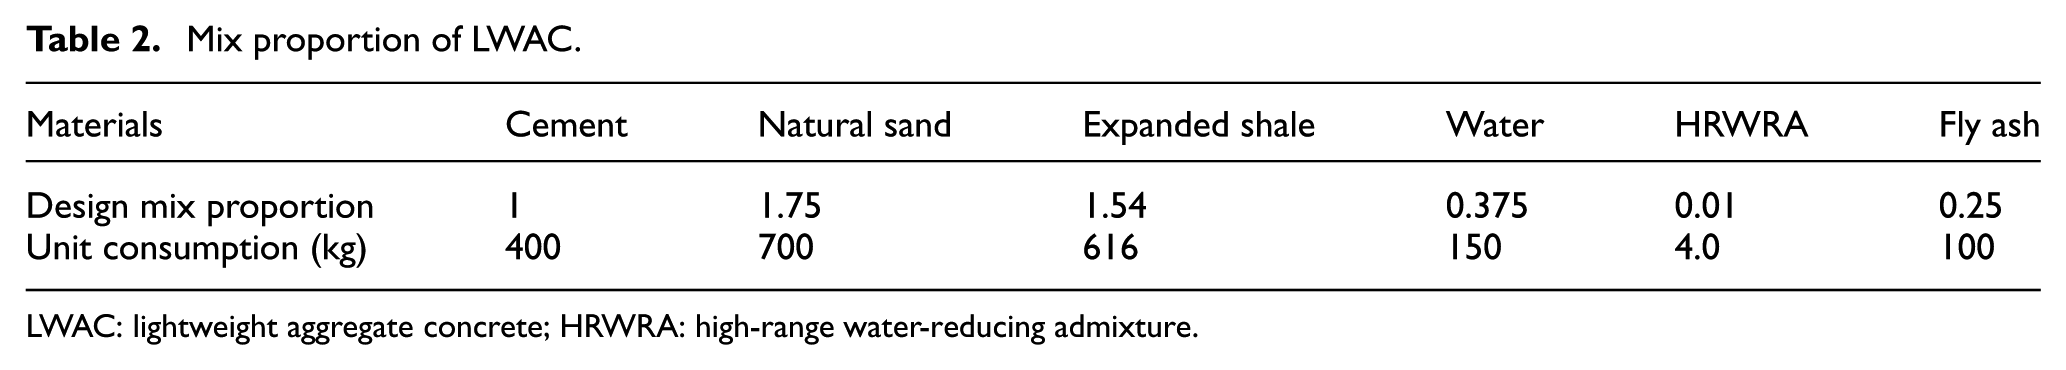
LWAC: lightweight aggregate concrete; HRWRA: high-range water-reducing admixture.
Material properties of LWAC.

LWAC: lightweight aggregate concrete.
Figure 3 illustrates the details of the reinforcement configuration. The longitudinal reinforcements consisted of twelve 10-mm-diameter hot-rolled deformed bars for series A, B, and D columns and eight 12-mm-diameter bars for the series C columns. Plain bars with diameters of 8 and 6 mm were used as transverse steels for series A and B and series C and D, respectively. The average longitudinal and lateral steel properties obtained from a minimum of three tensile tests are listed in Table 4.

Specimen dimensions and reinforcement details.
Tested mechanical properties of the reinforcements.

Instrumentation and measurements
The test setup is shown in Figure 4, and all specimens were tested using a 5000-kN capacity universal testing machine under a displacement-controlled mode at a loading rate of 0.1 mm/min. Specifically, both ends of the column were capped with a layer of fine sand with a thickness of 3 mm to ensure a uniform load distribution on the cross section of the column. A capping device composed of a 20-mm thickness, and a 150-mm height steel plate was mounted on the upper end of column to enhance the local confinement and prevent premature crushing of concrete (as seen in Figure 4). In addition, a spherical hinge was located at the bottom end of the column to guarantee that all specimens were under the concentric compressive loading. The test was terminated when the specimen reached collapse mode of failure or the axial load–carrying capacity decreased to 60% of the maximum load.

Test setup and instrumentation details (a) schematic of loading device (b) location of LVDTs and strain gauges (c) end capping device.
Three electric-resistance strain gauges with a length of 60 mm were horizontally mounted on the mid-height of each column surface with 100-mm spacing to evaluate the swelling and deformation capacity of concrete at the elastic stage. Two other identical strain gauges were vertically fixed on the middle portion adjacent to the aforementioned horizontal strain gauges to record the specimen local strains prior to concrete cracking. Four linear variable differential transformers (LVDTs) were instrumented at four sides of each specimen to measure the axial displacement within a given gauge length of 450 mm and to ensure the axial loading of the columns. The transverse steel strains were typically monitored in the range of five to seven locations over a central 450-mm gauge length using strain gauges with a length of 5 mm. The distribution of reinforcement strain gauges is shown in Figure 5. All the strain data were collected by a high-velocity DH3820 data acquisition system.
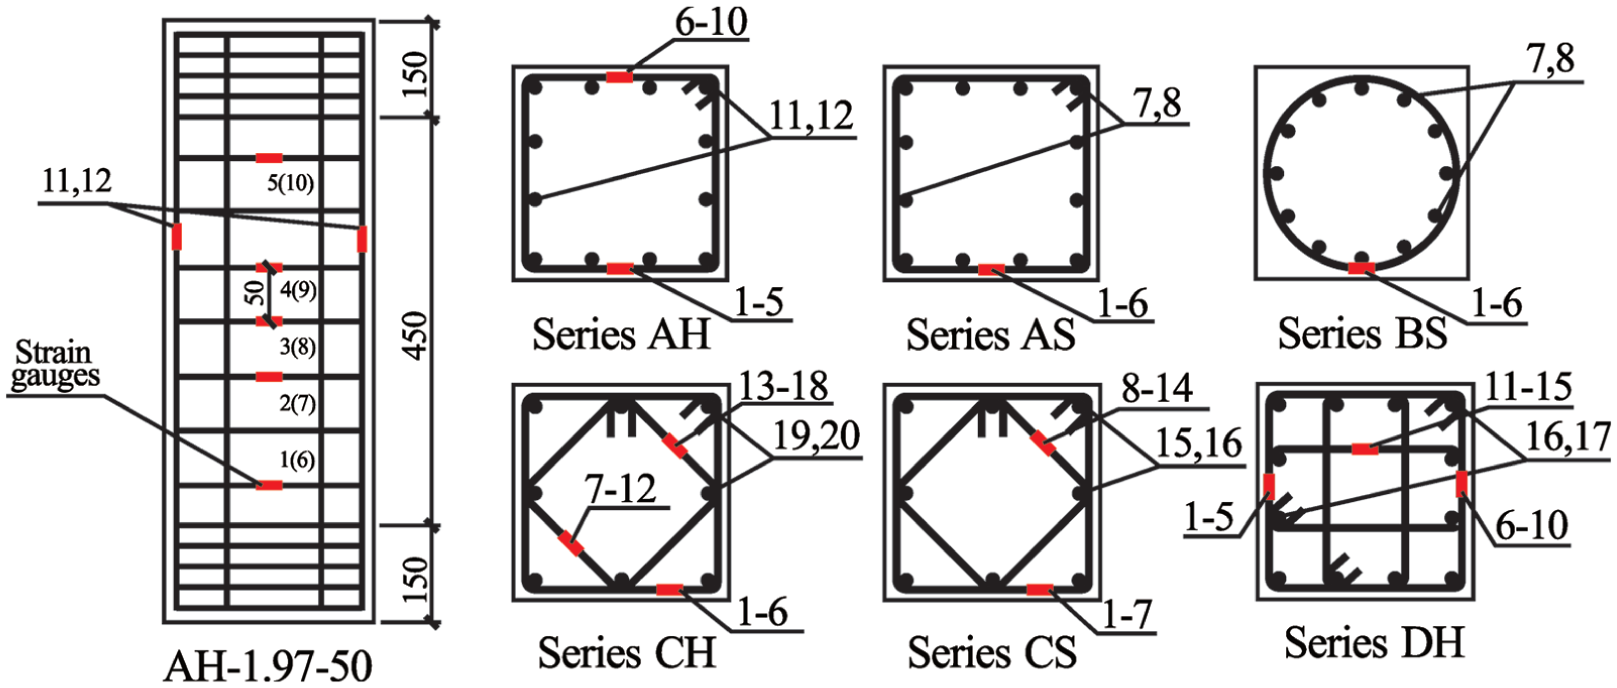
Locations of the steel strain gauges.
Experimental results and discussion
General observation and failure modes
A similar behavior was observed for each specimen at the initial loading stage. At this stage, the axial compressive load was mainly sustained by the concrete and longitudinal bars, while the lateral confinement made little contribution. The concrete cover was visually free of cracks. The lateral reinforcement strains and Poisson’s ratios of the LWAC specimens were relatively small, and this was in the linear elastic stage. Vertical cracks were initiated when the load increased, and the cracks enlarged along the corner longitudinal bars, and this was followed by spalling of the concrete cover. Subsequently, the specimens reached the ultimate state. Typical specimens, namely, CH-1.97-55 and BS-1.97-50 were selected to analyze the crack patterns and the failure appearance of these two specimens at three different loading stages as shown in Figure 6.

Typical failure modes—(a) specimen CH-1.97-55: (A) load drops to
Prior to the load of 1300 kN (approximately 58% of the peak load, Ptest), specimen CH-1.97-55 was in the elastic loading phase, and an obvious phenomenon did not occur at the concrete surface. This was followed by a crisp sound of concrete cracking that indicated that minor internal cracks were gradually formed. When the load increased to 1600 kN (approximately 72%Ptest), the first crack appeared with a width of 0.2 mm and a length of 1 cm on the upper end of the corner of the specimen surfaces B and C. Until the load continuously increased to 1850 and 2100 kN (that is equal to 83%Ptest and 95%Ptest, respectively), vertical cracks appeared with a length of 5 cm distributed along the corner longitudinal bars on the surfaces A and B of the specimen, respectively. Subsequently, the cracks on the surface A expanded further up and down along the vertical direction, while the cracks on the surface B developed along the diagonal direction. A louder cracking sound was heard, and it was accompanied by the spalling of concrete cover at one or two spots of specimen and the yielding of longitudinal steels. After the specimen reached the peak load (2215 kN), several cracks occurred at the middle height of the surface C and D and extended rapidly upward into a penetrating inclined crack. The axial load–carrying capacity of specimen gradually decreased. The continuous loading led to the formation of X-shaped or H-shaped penetrating cracks on the surfaces A and B, and the cracks met at the corner of specimen. Until the load dropped to 1772 kN (80%Ptest), a major portion of concrete cover broke off, and the lateral expansion of core concrete increased due to a thrust by the buckled longitudinal bars. The core concrete between the adjacent lateral steels was gradually crushed, which resulted in a slight reduction of spacing between lateral steels. Simultaneously, the lateral expansion of transverse steel reinforcement became more apparent due to the axial shorting of the confined column. However, no anchorage failure occurred for the transverse steel reinforcement during the test. At the end of the test, a sharp drop in the axial load occurred when three lateral hoops fractured at the corner bending part. However, the axial load was stabilized at approximately 60% of the maximum load because the remainder of the lateral hoops continued to provide a residual confinement.
With respect to the specimen BS-1.97-50, the failure process at the elastic stage was similar to that of specimen CH-1.97-55. However, at the middle loading stage, the first crack was observed at the middle height of specimen, and this was followed by rapid widening and inclined propagating. Following this, a shear failure plane was discovered at an angle of 45° with respect to the horizontal, and the internal spirals were ruptured resulting in a significant decrease in the axial load–carrying capacity.
Stress–strain relationship
Table 5 shows a summary of the test results, where
Test results for each specimen.

Confined concrete compressive strength,

where A denotes gross cross-sectional area of the column; Acov denotes total area of the concrete cover; As denotes total cross-sectional area of longitudinal bars; and σcov(ε) and σs(ε) denote the stresses of the concrete cover and longitudinal bars, respectively, that are determined by the stress–strain curves obtained from the corresponding standard tests. It should be noted that after the longitudinal bar buckling occurred, the stress σs(ε) was taken as the yield strength of longitudinal reinforcement. The ratios of
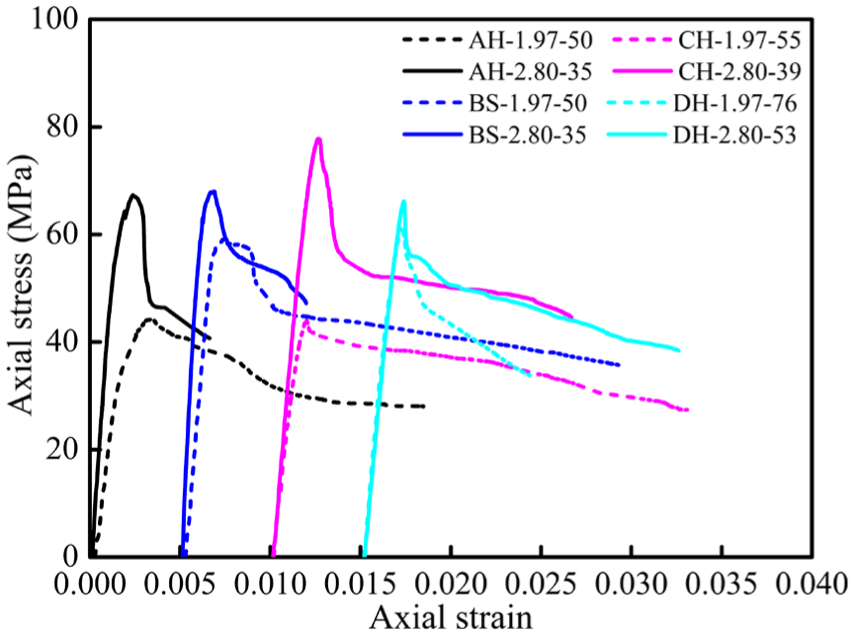
Figure 7 shows the stress–strain curves of specimens CH-1.97-55 and CH-2.80-39. As shown in Figure 7, the stress–strain curves are almost linear with a steep slope prior to the specimen cracking. The axial stress increases faster than the axial strain. When the axial load increased to 80%Ptest, then the growth rate of axial stress gradually decreased due to the cracking of the concrete cover. Simultaneously, the confined columns exhibited obvious elastic–plastic deformation behavior. The peak stresses of specimens were reached when the load continuously increased. It should be noted that with respect to the specimens with an identical tie configuration, the peak stress and the corresponding peak strain increased with increases in the lateral reinforcement ratio. Generally, higher confinement leads to higher axial load, but slightly decreased ductility of confined LWAC columns. After the peak load point, the specimen axial stresses decreased approximately by 10%–15% due to the sudden spalling of concrete cover, and the stress–strain curves entered into the descending branches. Furthermore, the lateral deformation of core concrete increased faster, and the confinement contributed by the lateral reinforcements became more effective. At the end of the test, the degradation rates of axial stresses decreased, and the slopes of the curve falling branches were relatively mitigated.

Stress–strain curves of the specimens.
Effect of lateral reinforcement volumetric ratio
Figure 8 demonstrates the effect of the amount of tie steel on the behavior of the specimens. In each group, there are two levels of lateral reinforcement ratios, namely, 1.97% and 2.80%. With regard to the lateral reinforcement ratio increased from 1.97% to 2.80%, the enhancements in peak stresses were approximately 53%, 41%, 15%, 67%, and 8.5% for series AH, AS, BS, CH, and DH specimens, respectively. The significant enhancements in peak stresses are attributed to the fact that reducing the tie spacing and simultaneously increasing the amount of lateral steels effectively enlarged the confined area and improved the lateral restraint force of core concrete.
Effect of the lateral reinforcement volumetric ratio.
With respect to specimens with identical tie configuration in each group, the lateral reinforcement ratio did not exert a significant effect on the ascending part of stress–strain curves because the confining effects were not obvious prior to the concrete cracking. A comparison of the specimens in group D shows that increasing the lateral reinforcement ratio is an effective approach to mitigate the descending branch of stress–strain curves. Therefore, it is recommended that the value of lateral reinforcement ratio in the component design should be appropriately increased to effectively improve specimen ductility and prevent the occurrence of brittle failure.
Effect of tie configurations
The confinement effect is highly dependent on the tie configuration, and the confined concrete area can be effectively enlarged by reasonably choosing a configuration of the longitudinal bars and lateral steels in the columns. The hatched areas in Figure 9 illustrate the effective confinement areas for series A–D specimens. Figure 10 compares the effects of various tie configurations (A, B, C, and D types) on the stress–strain curves under the same lateral reinforcement ratio. The longitudinal bars in group A, B, and D specimens were adopted as 12C10, while those in group C specimens were considered as 8C12. The corresponding longitudinal reinforcement ratios were 1.51% and 1.45%, respectively.

Effectively confined area of core concrete: (a) series A, (b) series B, (c) series C, and (d) series D.

Effect of the tie configuration.
The axial strain ductility ratios ε0.85/εcc of specimens AH-1.97-50 and AS-1.97-50 corresponded to 2.43 and 15, respectively. This indicated that the LWAC confined by rectangular ties was allowed for larger lateral deformations. With respect to identical lateral reinforcement ratios, the column confined by the rectangular spirals revealed an obvious enhancement in specimen ductility. However, as seen from Figure 9(a), this type of tie configuration did not provide a reasonable lateral confinement for the core concrete due to the insufficient effective confinement concrete area. It may be said that the improvement of the axial load–carrying capacity was insensitive to the rectangular spirals configuration.
With respect to series C, the axial strain ductility ratios ε0.85/εcc of specimens CH-1.97-55 and CS-1.97-55 corresponded to 7.25 and 1.03, respectively. However, the specimen CS-1.97-55 was constructed using compound-diamond-spiral lateral reinforcements and showed an enhancement of 60% with respect to the load-carrying capacity. This could be due to the inconsistent deformations of internal and external layer spiral reinforcements for specimen CS-1.97-55, which resulted in an ineffective collaboration between these two layer reinforcements and an insufficient confinement with respect to the core concrete. Therefore, it was observed that the specimen CS-1.97-55 behaved in a less ductile fashion with a sharp decrease in the load.
Comparisons of the four-types of tie configurations indicate that the specimens using D-type configuration obtained a significant confinement for the core concrete and exhibited greater strength and ductility enhancement when compared with those of the other specimens.
Strains in lateral reinforcements
Figure 11 shows the distribution of the lateral reinforcement strains along the column height when the specimens reached their peak stresses and with a 15% decrease in the peak stress. At the initial loading stage, the lower lateral steel strains were attributed to the smaller expansion of the core concrete. The confining effects of ties in the column become increasingly obvious after the concrete cover cracking. With respect to the confined LWAC columns in this study, the occurrence and development of cracks were significantly delayed when compared to those in the case of the NWC specimens. The main causes of this phenomenon include higher interfacial strength between the aggregate and cement and better bond-anchorage properties between the steel reinforcement and LWAC. Consequently, the ties in most of the specimens except BS-2.80-35 did not reach their yield point at the maximum load stage. Following this, the strains of the lateral steels at the failure zone quickly increased due to the large-area spalling of the concrete cover and the formation of failure planes. The stirrups across the failure planes yielded at this stage until the axial load dropped to 85% of the peak load. With respect to the specimens with smaller lateral reinforcement ratio, the core concrete prematurely suffered from crush damage due to insufficient confinement provided by the lateral reinforcements.

Strains in the lateral reinforcements (a) series A (b) series B and series D (c) series C.
Modeling the behavior of specimens
Analytical modeling
Several studies indicate that the compressive stress–strain curves are significantly influenced by the amount, yield strength, and spacing of the lateral reinforcements as well as the tie configurations. Therefore, the strength and ductility of the confined specimens can be effectively enhanced by an increase in the lateral reinforcement amount, improvement in the lateral reinforcement yield strength, and reduction of the lateral reinforcement space. In addition, the reasonable selection of tie configurations has the same effect as the aforementioned measurements. Therefore, the confinement effectiveness factor (λt) and a coefficient k were introduced to quantitatively evaluate strength and ductility of confined LWAC columns. The confinement effectiveness factor (λt) considers the effects of the amount and strength of lateral stirrups. Coefficient k reflects the efficiency of reinforcement arrangement and is equal to unity when the confinement pressure is near-uniform as observed in the case of closely spaced circular spirals, which corresponds to the highest efficiency. An empirical expression was developed for k by performing a regression analysis of test data for normal-strength concrete as follows

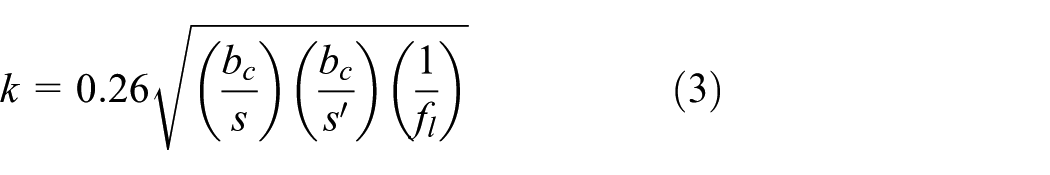
where ρt denotes volumetric ratio of the lateral reinforcement, fyt denotes yielding stress of the lateral stirrups, bc denotes center-to-center spacing of the lateral stirrups, s denotes lateral tie spacing, s′ denotes spacing of the longitudinal reinforcements, and fl denotes maximum confining pressure of core concrete when the stirrups yield. According to the equilibrium conditions (Figure 12), fl can be expressed as follows

where n is equal to 2, 2, 3.41, and 4 for sections A, B, C, and D, respectively.

Confining stress for each tie configuration: (a) series A, (b) series B, (d) series C, and (d) series D.
Combining with the relevant research results conducted by Martinez et al.
12
and Khaloo and Bozorgzadeh,
15
the relationships of the ratios


Relationship of
Comparison results
Equations (5) and (6) were used to calculate the peak stresses and the corresponding strains of confined LWAC columns tested in this study, respectively, and the prediction results were compared with the calculations of four classical models proposed by Richart et al., 17 Mander et al., 5 Razvi and Saatcioglu, 18 and Khaloo et al. 19 as shown in Table 6.
Different peak stresses and corresponding strain models for the confined concrete.

The comparisons between analytical and experimental peak stress and strain values are presented in Table 7 and Figure 14. The means of the ratio
Parameters and calculated results of the specimens.

AAE: average absolute error.

Test versus calculated values of
Conclusion
The test results of 12 square short-confined LWAC columns and the analytical modeling of specimen behavior indicate the following conclusions:
The results indicate that the failure process of confined LWAC columns is same as that of confined NWC specimens prior to the peak load point. However, after the peak load point, the concrete cover of the confined LWAC columns was cut off and entirely spalled off. A few cracks occurred across the aggregates or at the interface between aggregate and cement paste, and these are significant differences when compared with NWC specimens. Finally, X-shaped or H-shaped diagonal penetrating failure planes or shear failure planes at an angle of 45° with the horizontal axis were formed. Nevertheless, the developing law of stress–strain curves for LWAC specimens is also similar to that for NWC specimens.
The tie configuration significantly influences the strength and ductility of the confined specimens. Rectangular spiral stirrups (section A) effectively enhance the ductility of specimens although it does not provide reasonable lateral confinement for the core concrete and improve the specimen load-carrying capacity due to the insufficient effective confined concrete area. The use of the compound-diamond-spiral lateral reinforcement (section C) increases the load-carrying capacity of approximately 60%, compared to that of specimen CH-1.97-55, albeit without any benefit with respect to specimen ductility. This is attributed to an ineffective collaboration between the internal and external layer spiral reinforcements. Comparisons of the four types of tie configurations indicate that the specimens using the D-type configuration display a significant confinement for the core concrete and exhibit more strength and ductility enhancement when compared with other specimens.
The analytical model is proposed by combining the confinement effectiveness factor (λt) and a coefficient k, and it shows better accuracy and rationality in predicting the peak stress and peak strain of the confined LWAC columns.
Footnotes
Appendix 1
Handling Editor: Seung-Bok Choi
Declaration of conflicting interests
The author(s) declared no potential conflicts of interest with respect to the research, authorship, and/or publication of this article.
Funding
The author(s) disclosed receipt of the following financial support for the research, authorship, and/or publication of this article: This study was supported by the Research Fund for National Natural Science Foundation of China (Nos 51578072, 51578077, and 51708036), Natural Science Foundation of Shaanxi Province (No. 2017JQ5092), and the Fundamental Research Funds for the Central Universities (Nos 300102288401 and 310828175020).