
Abstract
The concentration of micron-size particles in used oil is generally obtained by atomic emission spectrometry. These accurate results can be considered as the most important index for real-time reliability evaluation including failure prediction and residual life assessment of power-shift steering transmission in tracked vehicles. Stochastic process and especially Wiener process can be applied in processing the oil spectral data. In this article, 50 used oil samples in total were collected and analyzed in sequence which covered 250 motor hours. The eigenvalue and mean value of elemental concentration in those samples were also revealed by linear regression analysis. Then, the increasing trends and the first hitting times for indicating elements were solved by simulating stochastic differential equations, which were based on the positive drift Wiener process. Comparing to the existing conditional maintenance time, the first hitting time increased about 27 motor hours more (13.7%). The results show that the maintenance frequency can be decreased by a longer time and finally can increase the cost-effectiveness ratio of maintenance.
Introduction
In recent years, the safety and reliability of complicated electro-mechanism systems such as power plant, transmission, and hydraulic machinery have aroused wide concern.1–5 Actually, there are various issues in complex system reliability, 6 as it is hard to determine due to the different quantitative analyses of the reliabilities of its components.
Failure is defined as omission of occurrence or performance, specifically failing to perform a duty or expected action, which occurs when the function cannot be performed or has a performance that falls outside the performance requirement. In more detail, failure can be ranged into two principle types which are manifested as degraded (gradual) failure and critical (sudden) failure. 7 In such failure studies, the time to failure is mostly observed on operating time or calendar time; however, it is often measured by the number of cycles to failure and combined scales.
To avoid any unscheduled breakdown and downtime, planned maintenance (PM) is performed to ensure that the equipment is operating correctly, performing based on predefined scheduled intervals. 8 Condition-based maintenance (CBM) is performed only after a decrease in the condition of the equipment has been observed. 9 Compared with preventive maintenance (PM), this increases the time between maintenance repairs, because maintenance is done on an as-needed basis.
Health condition monitoring based on oil analysis is seen as an appropriate tool for equipment to maximize its life and availability, to predict and prevent costly failures, and to reduce the frequency of unnecessary maintenance and servicing. 10 Oil analysis is performed during routine predictive maintenance to provide meaningful and accurate information on machine condition. 11 In this study, we have continuously collected oil samples from transmission fluids for the purpose of oil analysis. For tracking these oil analysis sample results over the life of the equipment, MOA II, an atomic emission spectrometer, was applied for measuring trace quantities of elements in transmission fluids.
Power-shift steering transmission (PSST) is an automatic power-shift transmission for heavy-duty vehicles, which is characterized by its high loading capacity. As shown in Figure 1, it is power shiftable and offers six forward and one reverse gears which can be shifted perfectly smoothly under hydraulic control.

Schematic diagram of the PSST.
The situation of wear in PSST is complex, including multiple friction pairs such as wet clutches, transmission gears, sealing rings, bearings, and conflux planetary gear train. 12 Friction and wear of parts can produce metal particles of all shapes and sizes, which are uniformly distributed in transmission fluids as contaminants. Spectral data of used oil samples, which contains the concentration of 30 maximum elements, can be considered as one of the most important analyzable data for optimizing the scheduled maintenance intervals. Moreover, there is no actual prescription or threshold of maintenance intervals for PSST specified in any standards. At present, most time, scheduled maintenance provided by historical investigation, similar equipment experience, or expertise was too conservative to adapt for the current requirements.
The remainder of this article is organized as follows: section “Literature review” provides a literature review. The spectral data of used oil samples are introduced in section “Oil sampling and analysis.” In section “Preprocessing using regression analysis,” we pre-analyzed the oil data with linear regression. The data modeling and its results are shown in section “The Wiener process.” Section “Results and discussion” presents the outcomes of the investigation.
Literature review
Lots of research works have already been reported on the application of Brownian motion, oil data processing, and optimization of scheduled maintenance intervals. Since not all previous research is applicable for this case, the methods, results, and their achievements are reorganized in this section into the following groups: (1) oil spectral data processing; (2) the progress and application of Brownian motion; and (3) maintenance interval optimizing.
For power transmission system, oil contamination caused approximately 70% of in-service failures, of which 50% are resulted from wear-related problems. 13 Oil-based condition monitoring methods include atomic emission spectrometer, scanning electron microscopy, particle counter, optical microscope, and ferrography. Kim et al.14,15 used real multivariate spectrometric oil data coming from the failing transmission units of 240-ton heavy hauler trucks to estimate the parameters of the state and observation processes by the expectation–maximization algorithm. Oil spectral data contain more than 20 observed metal elements, which have internal correlations in varying degrees. Wang and Zhang, 10 Liu et al., 12 and Loutas et al. 16 introduced the principal component analysis (PCA) to extract representative uncorrelated variables by pre-analyzing the original data. The outcome of statistical analyze will be used in our investigation to reduce the number of dimensions for oil spectral data.
As a type of stochastic-based data-driven method, Wiener process has gained much attention in recent years. It finds applications in a large number of mathematical sciences. 17 Tang et al. 18 present the effects of model mis-specification of linear Wiener processes for the remaining useful life (RUL) estimation. Through examining the statistical manner of the collected vibration data, Çağlar et al. 19 also indicated that the dataset reflects the properties of a nonstationary random process, and it can be expressed by the Wiener process model (WPM) as a statistical approach. Among these models, the Wiener process with positive drift is a favorable candidate due to its mathematical properties and physical interpretations. 20
Maintenance scheduling of stochastically failing systems is decided based on experience, manufacturers’ recommendations, characteristics of monitored variables, or reliability analysis. 21 Zhang et al. 22 established a double-Wiener-process degradation model to present nonstationary feature of the degradation of mechanical components. Samrout et al. 23 expounded the proportional hazard function to integrate the effect of corrective maintenance (CM) while planning for the PM policy. Coolen and Dekker 24 present a two-phase model for the economic evaluation and optimization of the interval between successive condition measurements.
As the oil data including amount of variables, it will be first estimated in a statistical regression analysis for model parameters. Then, we will apply Wiener process with positive drift to predict the first hitting time (FHT) of certain metal particle concentrations and, therefore, optimize the maintenance schedule.
Oil sampling and analysis
For the purpose of minimizing the disturbance from external environment of on-road test, a laboratory test bed (shown in Figure 2) for the PSST system is established to monitor the deterioration process or failure occurrence of system operation. It contains a v-type diesel engine as a power unit and bilateral symmetrical loads including inertia disks and loading piston pumps.

Life cycle test bed of the PSST.
It is important to ensure that procedures are used to minimize disturbance of the sample during and after the sampling process. Oil samples are typically drawn into a small, clean bottle which is sealed and sent to a laboratory for analysis. Despite highly trained and practiced site operators, error is still inevitable. For the purpose of ensuring a uniform error distribution of same batch of collected samples, the sampling and analyzing process must follow these guidelines:
Uniform sampling intervals: in order to collect more status information of equipment performance, sampling interval is determined to be 5 motor hours (Mh) by considering the common PM strategy;
If parts replacement or overhaul is performed on tested PSST, take an additional sample right after the service;
If maintenance is operated, such as oil change or oil replenishment, take two additional samples before and after the operation;
In case of appearing prognostic of failure, such as functional fault, abnormal vibration, or noise, take an additional sample straightaway;
For each time the test bed is normally started, sampling is performed after its stable running for at least 15 min;
For each time the test bed is normally shut down, sampling should be accomplished within 10 min;
Oil samples should be sent to machinery oil laboratory and analyzed by the same instrument afterward at the same day.
To simulate actual operation conditions, the tested PSST works under a cyclic loading as 50%, 75%, and 100% of actual loading at different gear stages for certain operation hours. Moreover, for collecting more details about metal particles, the sampling location is selected at the entry of fine-filter located upstream of the shifting valve.
By the end of the transmission performance test, the amount of used oil samples is 50 in total which are periodically collected from 0 to 248 Mh according to the time interval as nearly as 5 Mh. As requested, the whole set of samples is sent to laboratory for acoustic emission (AE) analysis. Due to space restrictions, part of the results for element concentrations is shown in Table 1.
Dataset of element concentrations from the used oil samples (unit: µg g−1).
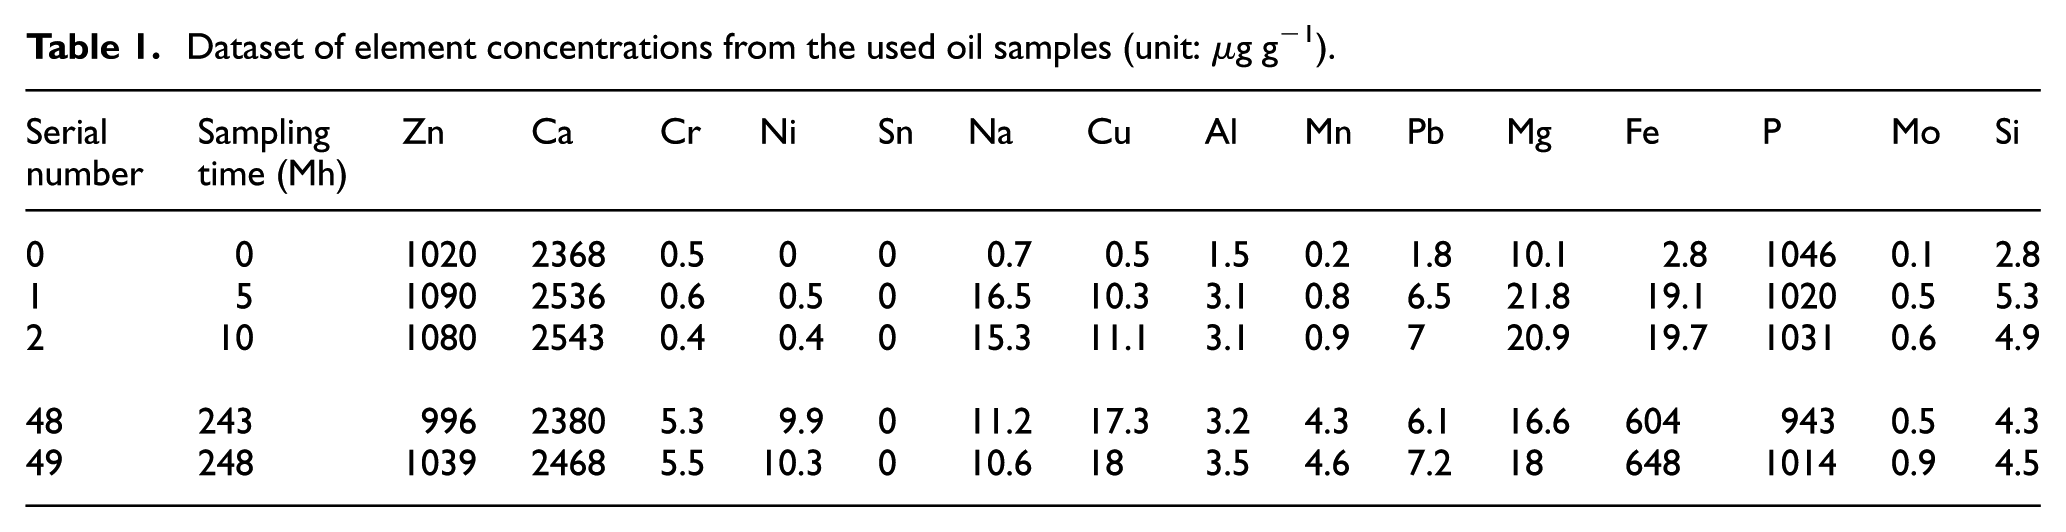
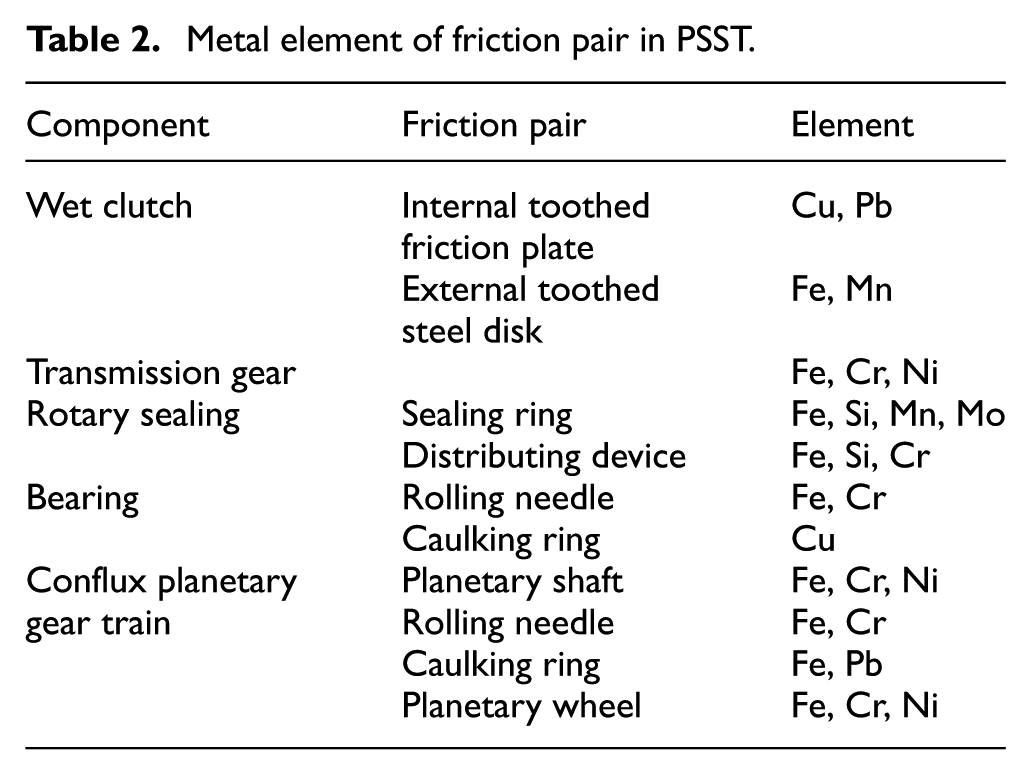
Although the above-mentioned dataset contains concentration values of multiple elements, there are three elements remaining as the indicators for deterioration and failure monitoring of the tested equipment, which is statistically processed by applying PCA method, as mentioned in Liu et al. 12 One of the oil paths is flowing through the wet clutch, transmission gears, rotary sealing, and bearing to conflux planetary gear train. The other went through the hydraulic shifting system. They both finally went back to the oil tank (Table 2). Fe represents integral wear level for the PSST, Cu represents wear level of friction plates, and Mo is a typical element that exists only in the cast iron sealing ring. Therefore, the selected indicators are iron, copper, and molybdenum, whose concentration curves are shown in Figure 3. Moreover, the statistical characteristics of the dataset have been listed in Table 3, including the mean value and the standard deviation.
Metal element of friction pair in PSST.

Concentration curves of the three indicators.
Mean value and standard deviation.

Preprocessing using regression analysis
By considering the randomness of the concentration values in oil spectral data, we assume that a scalar-dependent variable is denoted by

where
Consider a situation where the particles in used oil mostly come from wear debris and then we measure their quantities

Moreover, let

where
Linear regression can be used to estimate the values of

Linear dependence of Fe particles course.

Linear dependence of Cu particles course.

Linear dependence of Mo particles course.
The Wiener process
The growth rate of particle concentration can be considered as a diffusion process, which is a fundamental process for a series of time-dependent stochastic process. The process has formally been introduced by Norbert Wiener. It has primarily been used to describe Brownian motion of suspended particles in a liquid or a gas, 26 in which the path of a particle is erratic and frequently changes its movement direction. In general, a standard Wiener process has the following properties:
For
If
It can be seen that


As a special case, Wiener process represents a Gaussian distribution of diffusion process, which is also used to model the noise in practice. The statistical differential equation of Wiener process with positive drift is shown as
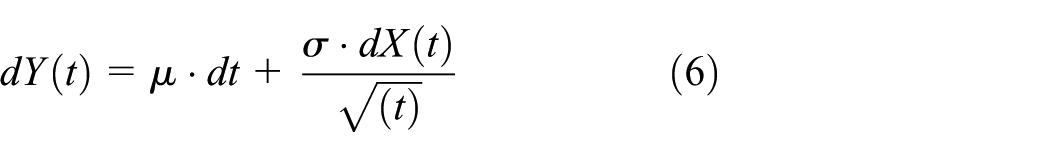
where drift term is denoted by
If the drift term

On the basis of Itô’s lemma,
28
assuming

Therefore

Hence

Since the particle concentration in the used oil samples due to deterioration of the equipment performance reminds very closely the random walk, it is strongly expected that the particle concentration can also be described by a Wiener process.
Results and discussion
In our investigation, the model of Wiener process has been solved by programing in R language. 29 And the predicted values for concentration curves of the elements iron, copper, and molybdenum are, respectively, shown in Figures 7–9. In these figures, the vertical dashed line at 170 Mh just indicates the corresponding maintenance time.
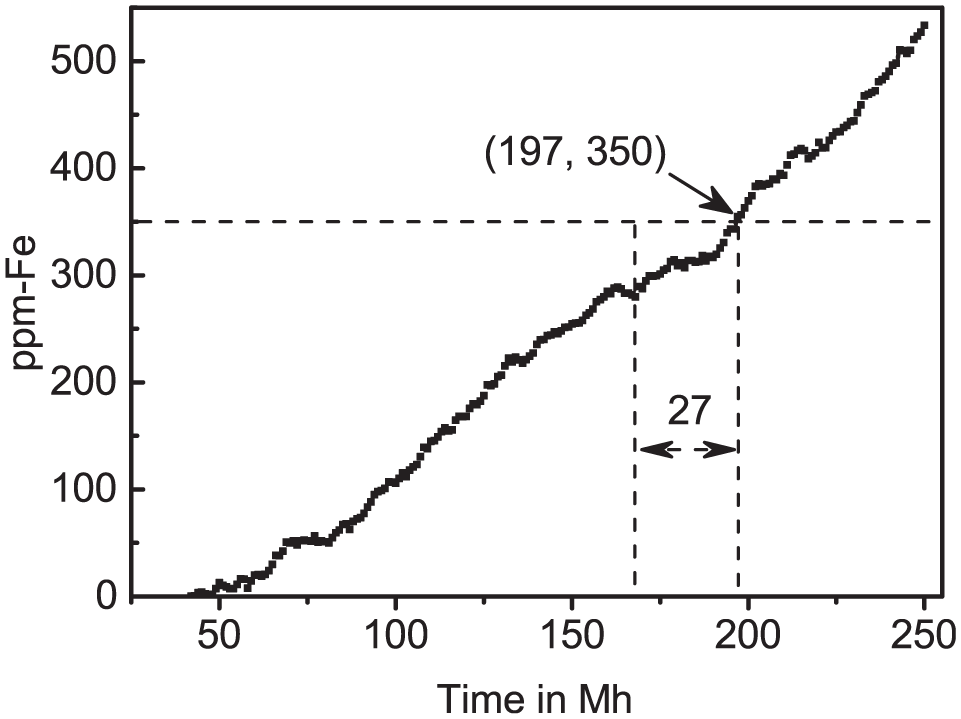
Predicted values for Fe particles.

Predicted values for Cu particles.

Predicted values for Mo particles.
As mentioned above, the PM-based maintenance interval is to ensure that the equipment is performing well based on predefined scheduled intervals. In previous research, 30 the threshold values for indicators have been given and then the PM interval for the PSST has also been formulated, as shown in Table 4. Using polynomial kernel principal component analysis (PKPCA) method in wear evaluation, the integral wear level that transformed into post-tertiary stage after working is at 170 Mh. Furthermore, in order to facilitate comparison, the FHT of the indicating elements and their CBM intervals are also listed in it according to the concentration curves of prediction results.
Comparison between the PM and the CBM.
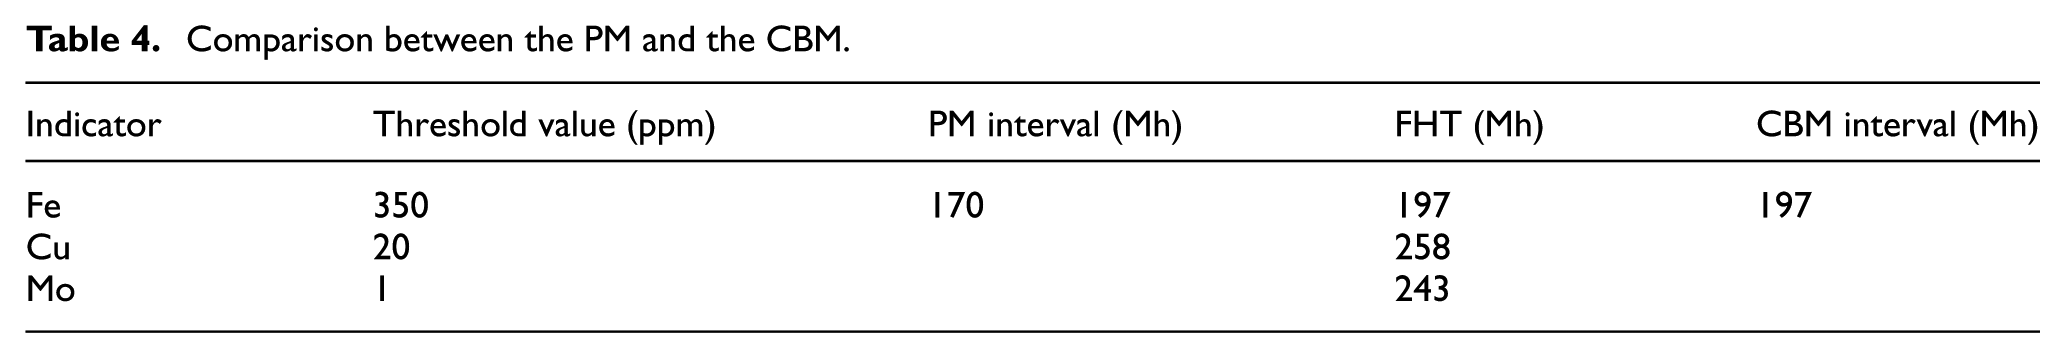
Under the same constraints of existing threshold values, the CBM interval corresponding to the FHT is 197 Mh, which is 27 Mh longer than the PM interval (170 Mh). As a result with the optimizing of maintenance interval, the maintenance frequency is reduced to 13.7%, which has the same effect to reduce the life cycle cost. It is noticeable that the critical (sudden) failure may emerge on the components in PSST if the necessary maintenance has not been performed by strictly following the maintenance schedule, such as exceeded the FHT of element Mo (243 Mh) or more serious element copper (258 Mh).
Conclusion
In this article, we introduced the Wiener process in processing the oil spectral data for optimizing the existing PM interval of the PSST. By meeting the expectations, the main results are acquired as follows:
As a pre-processing method, the linear regression analysis is proved in estimating the values of
In modeling the Wiener process with positive drift, the FHT values of indicators are estimated in optimizing the PM intervals.
The optimized interval is 27 Mh longer than the PM interval (170 Mh). Thus, the maintenance frequency is reduced to 13.7%, which has the same effect to reduce the life cycle cost.
The main aim and contribution of this article is to estimate and study the distribution of the FHT of a critical threshold and to determine the moment when the soft and hard failure occurs in a vehicle transmission.
Footnotes
Handling Editor: Noel Brunetiere
Declaration of conflicting interests
The author(s) declared no potential conflicts of interest with respect to the research, authorship, and/or publication of this article.
Funding
The author(s) disclosed receipt of the following financial support for the research, authorship, and/or publication of this article: This study was supported by the Advanced Program (40402010104) and the Innovation Program (VTDP-3503). And this project is supported by National Natural Science Foundation of China (grant no. 51475044).