
Abstract
The vibration of the handles of a vertical disc stump grinder causes significant damage to people who operate the machine for a long time. First, we tested the vibration of the handle of a vertical disc stump grinder. Second, we evaluated the allowable years of operating the vertical disc stump grinder according to the assessment standard ISO 5349 for human exposure to hand-transmitted vibration by the International Organization for Standardization. Third, we established a finite element model of the stump grinder based on the experience model of the engine and the power spectrum of the cutting force of the grinder. Finally, we proposed an optimization scheme for the vertical disc stump grinder according to the finite element model. The experimental results indicate that the output weighted acceleration of the existing handle of the vertical disc stump grinder is 47.89 m/s2 and the allowable years for operating the grinder are less than one. The simulation results indicate that the finite element model of the vertical disc stump grinder is useful for analyzing the vibration of the handle. The output weighted acceleration of the existing handle of the vertical disc stump grinder is 8.87 m/s2 after optimization, with the allowable years of operation increased to 3 years. Thus, the optimization scheme is feasible.
Introduction
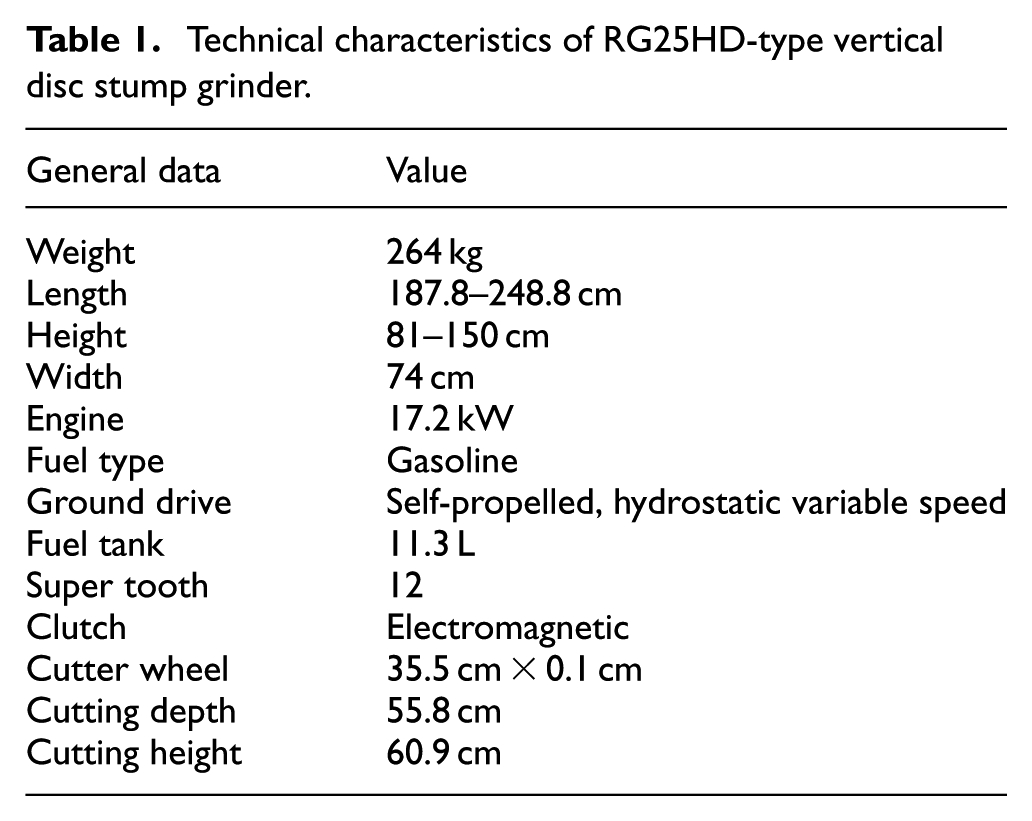
Most Chinese fast-grown and high-yield forests have entered a mature or over-mature period. In the forest harvesting residues, stump occupies a large proportion. And stump is widely used, such as be used for kraft pulp production, microbial industry, and manufacturing of wood plastic. 1 But because the stump is difficult to dig, in addition to a small amount of mining by the human, excavators, or bulldozers, most of them are left in the cutting-blank on natural decay. 2 This not only wastes resources, but also is not conducive to artificial or natural reforestation, and easily leads to the occurrence of forest diseases and insect pests. To this end, both at home and abroad are actively developing stump cleaning machinery, such as gear type rooter, lever type rooter, rope towed rooter, and a combination of lever and rope towed rooter.3–6 The common feature of these machines is to pull all the roots together, so the power is large, generally above 100 kW, which leads to a serious damage to the earth’s surface. Such as to pull out of Xing’an Larch stump in the diameter of about 400 mm and with horizontal root, the area of surface destruction will exceed 10 m2. And these machines require stump in small diameter, cleaning efficiency is low, and the price is expensive; therefore, these machines are failed to get the promotion and application of. However, the vertical disc stump grinder, which is a type of light-duty machine that is used to clean stumps and build caves, has been extensively employed.7–10 The machine can not only cut stumps to increase the soil fertility but also create a deep hole to facilitate reforestation and subsequent production. The RG25HD-type vertical disc stump grinder, which is produced by RAYCO (Wooster, OH 44691, USA) and powered by a V-shaped two-cylinder gasoline engine, is also extensively employed. Its technical characteristics are shown in Table 1. However, during the operating process of the machine, the change in the cutting force of the knife disc and the impact of the engine will cause vibration on the grinder. 11 Once operators perform a continuous operation for more than 1 h, they may experience distinct discomfort in their arms and their fingers may turn white.
Technical characteristics of RG25HD-type vertical disc stump grinder.
A specialized analysis of the vibration of the vertical disc stump grinder is not available. Thus, the vibration of the grinder handles should be tested and analyzed and its allowable working life should be evaluated according to the ISO 5349 standard “Mechanical vibration, guide for the measurement and evaluation of human hand contact vibration” by the International Organization for Standardization (ISO).12,13 The vibration system should be optimized to determine the allowable working life.
First, we tested the vibration acceleration of the handle when the grinder was performing cutting operations and evaluated the vibration situation of the handle according to the ISO standard. Second, we measured the torque of the cutter shaft using a wireless torque measurement system and acquired the input vibration of the engine of the grinder using a numerical simulation method. Third, the finite element model of the grinder was established on an ANSYS workbench, and the vibration of this model was optimized. Finally, the authors evaluated the vibration condition of the optimized grinder handle according to ISO 5349.
Vibration analysis and evaluation of the handle of the vertical disc stump grinder
Standard for measurement and evaluation of human hand contact vibration
The ISO 5349 standard “Mechanical vibration, guide for the measurement and evaluation of human hand contact vibration” provides the empirical safety value for a human contact vibration component. 14 This standard also provides the frequency of occurrence of vibration disease in hands for the condition of contact with a certain intensity of vibration and working years. We performed an evaluation of the vibration intensity of the grinder according to this standard to ensure that the optimized prototype can attain the standard of vibration.
ISO 5349 specifies that the vibration size should be expressed by the root-mean-square acceleration, and the frequency generally uses a 1/3 octave (the center frequency ranges from 6.3 to 1250 Hz). Considering the difference in the vibration sensitivity of the hand at different frequencies, we address the frequency division acceleration values in the entire frequency band. The estimated value of the vibration contact is generally based on the amount of daily contact. The standard uses 4 h as the basis for estimation. Formula (1) estimates the 1/3 octave analysis results for the corresponding weighted acceleration ah,ω

where kj is the 1/3 octave band weighting factor of item j in the standard, n is the number of 1/3 octave bands, and ah,j is the 1/3 octave band center frequency acceleration of item j.
The frequency of vibration will impact the human body at less than 315 Hz; thus, the study analyzed the 1/3 octave band of the handle of the grinder vibration to 315 Hz.
Vibration test and analysis of the handle of the vertical disc stump grinder
The vibration in the vertical plane of the operating handle is strong when operators are manipulating stump grinders. We selected a vibration perpendicular to the horizontal direction as the main analysis object in the vibration analysis of the stump grinder. 15 Due to changes in the wood structure in cutting stumps and the differences in the materials that are being cut, such as soil and stones, the handle vibration intensity will change. Therefore, we performed tests five times and chose the most intense vibration test result for the comparison with the standard.
This test uses an NEC San-Ei Instruments, Ltd., RA1100 multichannel data acquisition analyzer that is constructed in Japan as the vibration test collection system and uses the PCB356B08 three-direction acceleration sensor as the sensor. The acceleration sensor is attached to the handle by a special glue and connects to the analyzer via data transmission lines. The analyzer can be used to convert the collected signal into a real-time acceleration output.
The cutting test object for this test is the stump of a chinar. The operator can freely adjust the throttle size during cutting. The cutting test equipment and test procedure are shown in Figure 1.
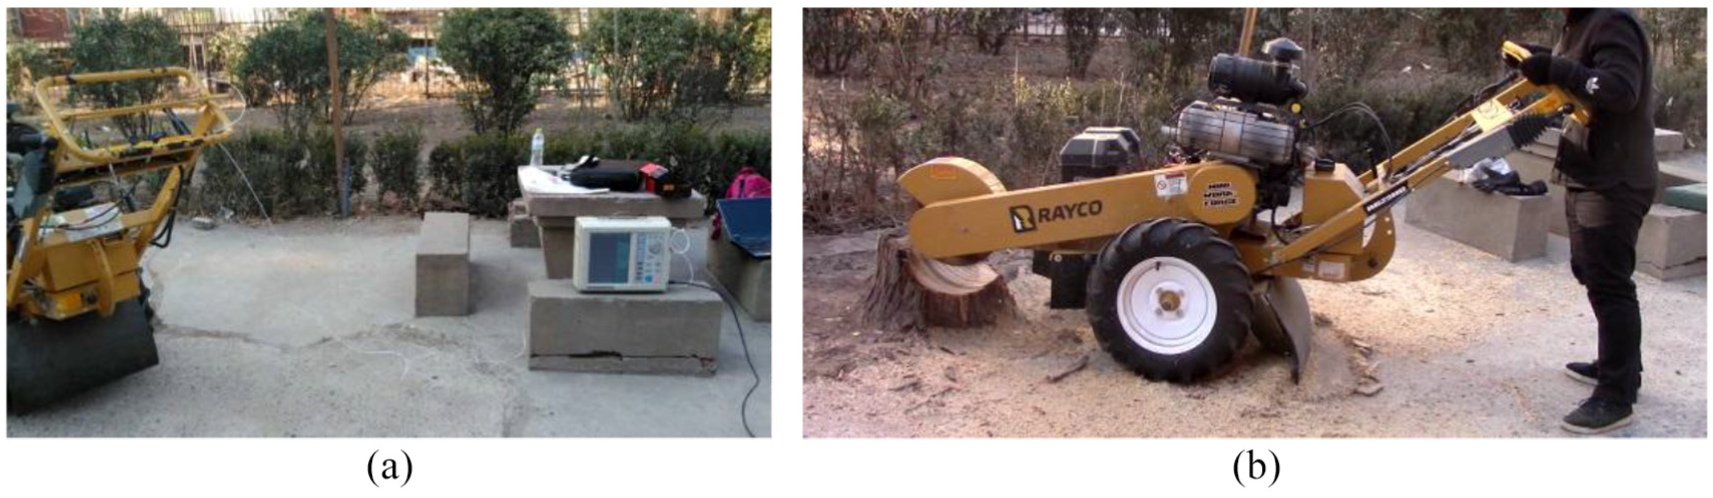
Experimental cutting equipment and cutting process: (a) experimental cutting equipment and (b) cutting experiment process.
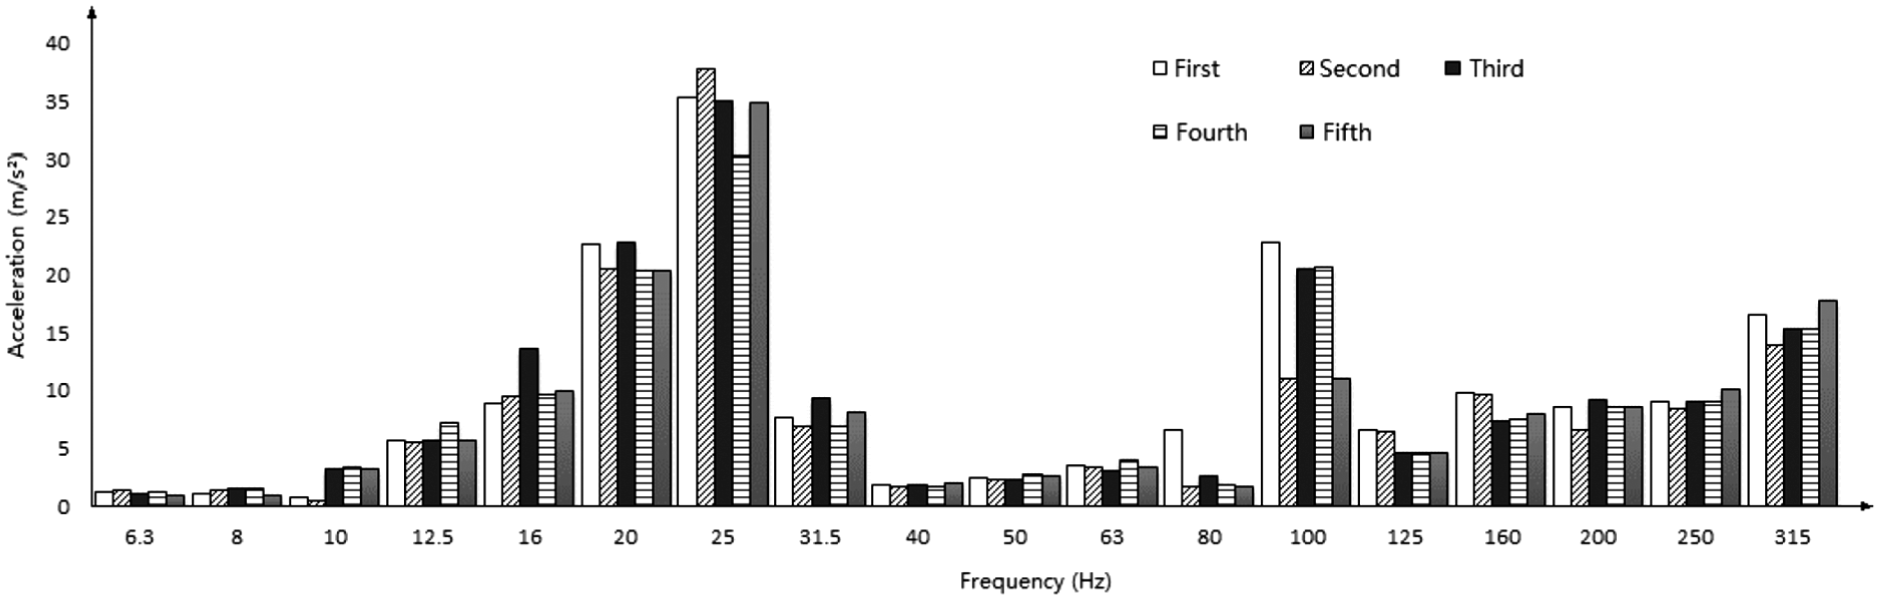
The authors set up the data acquisition channel of the data acquisition instrument and selected 2 kHz as the data acquisition frequency. The acquisition range extended from −500 to 500 m/s2. A total of five sets of cutting test data were collected; we estimated the power spectrum by the fast Fourier transformation (FFT)16–19 in the signal analysis tool SPTOOL in MATLAB. We calculated the acceleration values of the center frequency of the five measurements and plotted a cylindrical shape, as shown in Figure 2. The weighted acceleration of the 1/3 octave band from 6.3 to 315 Hz can be solved according to formula (1), and the weighted acceleration value of five measurements is shown in Table 2.
Center frequency acceleration of each frequency band.
Weighted acceleration values of five measuring cycles.

As shown in Figure 2, the handle of the grinder was prone to a larger acceleration at the frequency of 25 Hz during the operation, and the maximum acceleration could exceed 50 m/s2. As shown in Table 2, the maximum value of the weighted acceleration of the 1/3 octave vibration frequency band from 6.3 to 315 Hz was 43.342 m/s2. If the operator of this equipment works for 8 h and the direct contact vibration time is 4 h, according to the provisions of ISO 5349, with a 10% probability of the occurrence of vibration disease as the standard, the allowed time for the workers operating grinders is less than 1 year. This test measured the minimum value of the weighted acceleration to be 39.187 m/s2. According to the provisions of the standard, the permitted work time for the operator is less than 1 year. This analysis indicates that the vibration intensity of the operating grinder is large, which adversely affects the health of operators.
Finite element model of the grinder
First, the vibration finite element model 20 of the vertical disc stump grinder was established. We evaluated various vibration schemes in the simulation, which can prevent a large number of time-consuming performance tests and rapidly evaluate the performance of the vibration scheme. The vibration of the handle of the grinder is primarily attributed to the engine and the cutting disc. This study established a three-dimensional model 21 of a grinder designed by PROE modeling software and imported the model into the ANSYS Workbench through the general interface. In the finite element analysis, to improve the efficiency of the calculation, the model should be simplified, the scattered small parts should be removed, and the surface of the complex parts should be made smooth. To validate the accuracy of the simplified finite element model, we combined the experimental model and the finite element model to perform the model analysis of the handle of the frame grinder. The error analysis results for these two methods were less than 10%, which indicates the high reliability of the model.22,23
Numerical simulation of engine input excitation
Engine excitation is one of the main sources of vibration of the grinder. Due to the periodicity of the working process and the machine movement, the rotational inertia force of the reciprocating internal combustion engine and the reciprocating inertial force generated in the operation are periodic. If these forces cannot offset each other in the machine, the force to support will continue to change and form the vibration excitation to the outside. The inertial force of the engine can be obtained by force analysis. The V-type double cylinder horizontal shaft gasoline engine ECH740 produced by the United States Kohler Co. 24 was employed in this article. To analyze the centrifugal inertial force and reciprocating inertial force of the engine cylinder and solve the excitation force in the vertical direction, the formula Fx is used, which is as follows

where γ is the angle of the two-cylinder center, α is the crank angle, mr is the centrifugal mass of the engine crank link, mj is the reciprocating mass of the engine crank link, r is the crank radius, and λ is the crankshaft link ratio.
The engine parameters can be substituted into formula (2), and MATLAB can be used to solve and plot the engine excitation force curve. Due to changes in the load, the speed of the engine will continuously change in the actual operation. If the engine speed ranges from the maximum output torque speed to the rated speed, that is, between 2400 and 3600 r/min, the authors can plot the inertial force curves in this condition as shown in Figure 3.

Curve of the engine inertial force.
Figure 3 shows the total inertial force curve in the vertical direction of the V-type double cylinder engine, which is combined with the first-order reciprocating inertial force, centrifugal inertial force, and two-order reciprocating inertial force. Formula (2) and the curve in the previous section show that the total inertial force of the engine is a periodic force that is superimposed by many harmonic forces at different frequencies.
The spectral analysis function 25 can be applied in the signal analysis tool sptool in MATLAB, and the FFT method can then be used to estimate the power spectrum of the inertial force of the engine. The power spectral density curve of the engine inertial force is shown in Figure 4.

Density curve of engine inertial excitation force power spectrum.
As shown in Figure 4, the power spectral density curve was divided into two stages. In the frequency range of 0–140 Hz, the power spectral density varied from 20 to 40 dB, and the average value was approximately 30 dB. In the frequency range of 140–280 Hz, the power spectral density varied from −10 to 10 dB, and the average value was approximately 10 dB.
Torque test of the cutting disc in operation
The vibration input 26 produced by the cutting disc in operation is another main vibration source that causes vibration of the grinder. Because the cutting process is complex, the change in the cutting force is hard to determine by theoretical calculations. Therefore, we employed the dynamic test method to obtain the cutting force value of the grinder. This test employs the strain gauge wireless torque sensor ZRN-FS made by Beijing Zhong Ruineng Company with the strain gauges attached to the cutting shaft, and the test data are transmitted to the receiving device by a wireless transmitter.
The sensor is installed on the cutting shaft, the torque coefficient is calibrated with the shaft material, and the entire system is calibrated. The data collection module, the data transmission module, and the lithium battery are arranged on the cutter head, and the installation position of the sensor is shown in Figure 5.

Mounting position of the wireless torque sensor.
The choice for this test is the chinar tree stump, which is commonly employed for virescence. The tangential hardness of chinar is 378 kg/cm2, and the chord surface splitting strength is 33 kg/m. Chinar belongs to hard wood 27 according to the density classification. The height of the stump is approximately 280 mm, and the maximum cross-section diameter is 420 mm.
To obtain the cutting torque on the cutting shaft in operation and ensure the reliability of the measurement data, the authors conducted five cutting tests. Each measurement required a minimum of 20 s, and we ensured that each cutting feed was more than half of the cutter teeth (10 mm). In addition to recording the torque of the cutting disc, the vertical vibration of the handle was recorded in each cutting test.
The value obtained in the test is the cutting torque on the cutting shaft. The formula to acquire the cutting force on the cutting teeth is as follows

where Fq is the cutting force on the cutter teeth, and r is the cutter radius. Fq can be obtained using the measured torque Fq = T/r.
The tangential direction of the feed position during the cutting (the direction of force Fq) is shown in Figure 6.

Schematic of the cutting position.
The angle between Fq and the horizontal plane is α = 60°, and the size of Fq in the vertical direction is

The five-measured torque was calculated, and Fqr was obtained. By the analysis of the five cutting test results, these five trends of the power spectral density curve of the cutting force were approximately equal. The maximum value was obtained when the frequency approached zero, which was approximately 30 dB. The power spectral density curve of frequency was more stable after 10 Hz, with a change of approximately −20 dB.
Finite element vibration modeling of the vertical disc stump grinder
First, the import geometry model to the modal analysis (model) module in the ANSYS Workbench needs to be added. In the project, the material properties of the various components need to be defined: structural steel should be selected for the main frame, and the material for the cutter shaft, fuel tanks, and wheels should be selected and defined according to the design. Then, different mesh generation methods for different components should be employed, for example, the fuel tank, the battery boxes, and other regular geometry use the hexahedral mesh generation method. For irregular components, such as the frame and cutter, the meshing method for the hexahedral and tetrahedral combination should be used. The modal stumps should be solved, and the mode results should then be imported into the random vibration module on the workbench.
The initial condition is defined as no initial velocity, the initial temperature is ambient temperature, about 20°C, the equipment has gravity, and there is no other initial stress. The boundary condition is to fix the contact position between the tire and the ground. The location of the cutter’s entering cutting force is defined as the feeding location when the cutter cuts a stump. The cutting force of the cutter derived from the analysis of the power spectral density should be input into Excel data tables, and the direction should be defined as the vertical exciting force level. Then, the four bolt connections between the engine and the frame should be defined as the input positions of the engine excitation. The engine excitation force is also input in the form of an Excel data table, and the direction of the excitation force is defined as the vertical horizontal plane, which completes the finite element vibration modeling of the riser cutting machine.
The torque of the cutting disc of the fifth cutting test was input into the finite element vibration model of the riser cutting machine, and the vertical vibration of the handle was simulated and compared with the vertical vibration obtained in the cutting test to prove the reliability of the finite element vibration model of the root machine. 28 Figure 7 shows the first set of cutting data input into the finite element model to solve the root machine acceleration cloud. The closer the color is to red, the larger the acceleration value. The display of the cloud indicates that the maximum position of the vibration acceleration of the root machine appears in the handle held by the human hand. The acceleration of the remaining four groups is similar to the acceleration of the first group. The maximum position of the vibration acceleration is at the handle.

Output acceleration of the stump cutting machine.
From the acceleration cloud diagram shown in Figure 7, select the point O on the handle with the largest acceleration and derive its acceleration power spectrum curve in the Y direction, as shown in Figure 8.

Acceleration power spectrum curve at the origin.
From the acceleration power spectrum curve at point O shown in Figure 8, the maximum value of the power spectral density appeared near 25 Hz, and the power spectral value was 368.5 (m/s2)2/Hz. The acceleration power spectral density at point O in the root machine model is derived from the five analysis results, and the center frequency acceleration values of each octave band are solved and plotted as a column chart, as shown in Figure 9. The weighted acceleration values for solving the results of the five analyses are shown in Table 3.

Acceleration of the center frequency in the simulation results.
Weighted acceleration in the simulation results.

The acceleration value of the center frequency of the octave band in Figure 9 indicates that the acceleration values in the frequency bands of 20 Hz and below were less than 10 m/s2 and the center frequency acceleration values of each frequency band were not very different. The center frequency of the 25 Hz band had the largest acceleration value with a maximum value of 60 m/s2 or greater. The center frequency of the 40 and 100 Hz bands had a small peak at the center acceleration value, and the center frequency of the remaining bands was small.
The maximum acceleration of the simulation results was 47.89 m/s2. According to the hand-pass vibration evaluation standard ISO 5349, at this acceleration value, if the operator touches the vibration handle for 4 h every day, the worker’s rules allow the operating period to be less than 1 year. From the analysis results, the vibration of the grinder’s handle needs to be improved when it is operating.
Comparing Figures 2 and 9, the actual vibration test results are compared with the results of the doubled band analysis of the simulated part. The maximum acceleration of the measured result and the simulation result is in the frequency band with the center frequency of 25 Hz, and a small acceleration peak appears in the frequency band with the center frequency of 100 Hz. The simulated value is more distinct than the peak of the measured value, and the measured value is larger than the simulated value for the center frequencies of 16, 20, and 31.5 Hz. The acceleration value of the corresponding frequency band is significantly larger, which indicates that the acceleration power spectrum peak value of the simulation result is concentrated and appears to rapidly increase and then decrease, and the measured value is much smoother in the segment. For the minimum measured value of 160 Hz, the center frequency acceleration value of the large frequency band is larger than the simulation value; however, the influence of the smaller weighting coefficient on the result is smaller due to the weighted acceleration.
The weighted acceleration value of the five test results that are listed in Table 2 was 43.342 m/s2, which is smaller than the weighted acceleration of 47.89 m/s2. The weighted acceleration values obtained by comparison 5 are higher than the five simulation results. The difference was approximately 5 m/s2, which may be due to the loose connection of the vibrational energy in the actual transmission of the machine, the gap, and the external environmental impact of loss. According to ISO 5349, the weighted acceleration of the simulated value and the measured value are similar in terms of the allowable working time (less than 1 year). Therefore, the optimal design and subsequent random vibration simulation results in this model are credible.
Vertical disc stump grinder vibration optimization
The three main elements of the vibration are the source, transfer path, and controlled object. 29 To control vibration, corresponding measurements in the three links can be performed. Vibration control can be divided into the vibration damping treatment of the source, the vibration isolation and handling of the transmission path, the structural modification of the controlled object, and the damping vibration. The goal of the vibration optimization for the handle of the grinder is to reduce the weighted acceleration in the 6.3–315 Hz 1/3 octave band and allow operators to operate grinders over a period that exceeds 3 years.
To achieve a better damping effect, this study proposed the following optimization scheme: (1) move the engine to the knife dish (500 mm), (2) install a rubber spacer between the engine and the engine block, (3) arrange the rubber spacer between the cutter head bearing seat and the frame,30,31 and (4) wrap a protective cover over the operating handle of the grinder. The study combines the scheme for the overall optimization of the model: (1) move the engine to the knife dish (500 mm) in the 3D model of stump grinder and modify the dimensions of inner and outer covers of pulleys with assembly relation of engine output shaft, (2) add the spacer to 3D model of stump machine in PROE, and set the rubber material parameter as the same as that of the general rubber isolator after importing into workbench: material density is 500 kg/m3, Young modulus is 7.85 Pa, and Poisson’s ratio is 0.47, (3) add the isolation rubber pad between the cutter shaft bearing seat and frame in PROE model, and set the material parameter in workbench, (4) add the handle protective sleeve to the stump grinder model, the protective sleeve is made of a larger density of plastic foam, polystyrene foam (Expanded Polystyrene) with a density of 25kg/m3, and set the mechanical parameter in workbench: material density is 25 kg/m3, Young’s modulus is 7.75 Pa, and Poisson’s ratio is 0.11. Then reflect the general optimization of the design in the finite element model of the grinder and set up the incentive value to conduct a random vibration analysis to solve the acceleration cloud image of the model of the grinder, as shown in Figure 10.

Vibration output acceleration after optimization.
The cloud images indicate that the maximum acceleration in the Y direction of the total optimized grinder appears in the handle. Select the point Q on the protective cover and export its acceleration power spectrum curve, as shown in Figure 11. The authors imported the power spectral density value into MATLAB, solved each acceleration of the center frequency in the 6.3–315 Hz 1/3 octave band, and compared the results with the corresponding simulation analysis values prior to optimization. The column chart is shown in Figure 12. The weighted acceleration obtained according to formula (1) was 8.87 m/s2.

Curve of the acceleration power spectrum at point Q.

Center frequency acceleration in different frequency bands after optimization.
The acceleration power spectrum curve at point Q shows that the acceleration value was significantly lower than the acceleration value at O within the frequency band; no distinct peak value appeared. The maximum acceleration power spectrum density appeared at approximately 5 Hz, which was 8.3495 (m/s2)/2/Hz. From the results of the comparison of graph 12, the center frequency of each frequency band after optimization is more stable, which indicates that the distribution of vibrational energy in each frequency band is even. The acceleration in the frequency band with the center frequency at 125 Hz is the maximum acceleration, and the acceleration in the remaining five frequency bands from 40 to 100 Hz becomes higher than the former.
After using this type of optimization scheme for the handle, the output of the weighted acceleration was 8.87 m/s2 compared with 46.091 m/s2 without optimization, which was reduced by 80.8%. According to the vibration evaluation standard ISO 5439, 32 if the operator is in contact with vibration for 4 h each day with the vibration intensity weighted acceleration of 8.87 m/s2, his allowed operation time is approximately 3 years, which achieves the optimization goal.
Conclusion and discussion
This study tested and analyzed the vibration acceleration of the handle of the grinder in root cutting machine operations while the operator’s hand is in the direction perpendicular to the horizontal plane in the cutting operation. The maximum weighted acceleration was 43.342 m/s2 in the 1/3 octave band of 6.3–315 Hz according to the ISO 5349 standard “Mechanical vibration, guide for the measurement and evaluation of human hand contact vibration,” which allows operators to operate this machine for less than 1 year.
We established a vibration finite element model of the grinder and input the excitation of the engine and cutting disc into the random vibration analysis module of the ANSYS Workbench to obtain the vertical acceleration power spectral density of the handle. The maximum weighted acceleration of the simulation results in the 6.3–315 Hz 1/3 octave band was 47.89 m/s2, which proves that the model is reliable and can be employed in grinder vibration optimization.
This article proposed a grinder vibration optimization scheme and acquired the weighted acceleration of the handle as 8.87 m/s2 via simulation of the optimal design scheme. The allowable working life of an operator for the condition of contact with the vibration for 4 h each day increased to 3 h each day according to the ISO 5349 standard “Mechanical vibration, guide for the measurement and evaluation of human hand contact vibration,” which indicates that the effect of vibration optimization is achieved.
Footnotes
Handling Editor: Davood Younesian
Declaration of conflicting interests
The author(s) declared no potential conflicts of interest with respect to the research, authorship, and/or publication of this article.
Funding
The author(s) disclosed receipt of the following financial support for the research, authorship, and/or publication of this article: This work was supported by the state forestry administration 948 project (2013-4-20).