
Abstract
This article combines a value-at-risk model with fuzzy theory and proposes a model using chance measure based on the value-at-risk model named chance-value-at-risk (ChVaR). The proposed model considers two measures, probability measure and credibility measure. The objective of this model is to determine the best route schedule that minimizes the risk at certain probability levels and credibility levels. For the proposed model, the correctness of its founding is proven. A detailed solution procedure is presented and tested to solve the ChVaR model. To verify the applicability of the model, two different scale cases are given: the first case indicates that the model can provide a satisfactory solution within a relatively small error range, and the second case routes the path of hazardous material transportation in Changchun, China. According to different probability levels and credibility levels, the ChVaR model provides different paths and multiple alternative choices for a decision maker. This point is important in practical scenarios.
Keywords
Introduction
According to the definition by the US Department of Transportation Pipeline and Hazardous Materials Agency, hazardous materials (hazmat) are materials or substances that are capable of posing an unpredictable risk to the health and property of citizens and to environmental safety when they are transported on roads. According to law GB13690-92 of China, “Commonly Used Classification of Dangerous Chemicals and Mark” hazardous materials can be divided into nine categories: explosives, compressed and liquefied gases, flammable liquids, flammable solid substances that are susceptible to spontaneous combustion and substances that emit flammable gases when wet, oxidizing substances and organic peroxides, poisons and infectious substances, radioactive substances, corrosives, and miscellaneous dangerous substances. The transport of these materials on roads is a low-probability, high-potential-risk event. The statistics data from the China Transport Administration 1 indicate the number of tons of hazardous materials that are transported by roadway is increasing due to the development of the social economy. The percentage of imported hazardous materials in domestic imported material is increasing with the addition of 1000 types of materials every year. Numerous researchers and experts have spent more than three decades in this field and made a series of achievements.
Erhan Erkut 2 is a pioneer who proposed several risk measurement models and conducted a series of improvements and supplements in Erkut and Ingolfsson, 3 the majority of which are discussed in Erkut et al. 4 Zografos and Androutsopoulos 5 are also first-class researchers, whose main research is the hazardous materials logistics problem, especially the warehouse location problem and emergency response problem. All models of hazardous materials are divided into two categories: route scheduling modeling and time scheduling modeling. The objective of the former model is to find the optimum route that satisfies the shortest distance and least cost. If the problem includes the vehicle routing factor, then the old problem, referred to as the vehicle routing problem (VRP), is applicable. The objective of the latter model is to successfully distribute the hazardous material to customers within the specified time, 6 thus easily improving customer satisfaction. Almost all variables in the above-mentioned models are deterministic.
Due to advancements in fuzzy theory in the last 15 years, these models are expanded by referring to the fuzzy variables with some degree of credibility measure for the hazardous materials problem. Zhao and Verter presented a bi-objective model based on the location routing problem. The two objectives of the model were to attain the minimum total environment risk and total cost. 7 Wei et al. 8 also considered the cost and risk as fuzzy variables and employed the chance-constrained programming model proposed by Li. 9 Its innovation is that it did not expect to achieve the two objectives simultaneously, but to seek a balance between the two objectives in an uncertain environment. Among the experts from China, Zhou et al. 10 proposed a new multi-objective model based on a reserving lane. Ma constructed a new framework to optimize the route that involves multiple factors, such as total risk, total operation time, and the total number of sensitive people. However, this framework requires numerous surveys and many experts. 11 In contrast to Ma, Wang et al. 12 created a route schedule that satisfies three constraints in an uncertain environment. In addition to time scheduling modeling, Meiyi et al. 13 optimized the start time and dwell time to achieve the greatest customer satisfaction.
These studies indicate that the combination of fuzzy theory and hazardous material transportation is reasonable. In the last 10 years, the value-at-risk (VaR) model was frequently applied in this field. Sarykalin et al. 14 defined the VaR model and presented mathematical properties, statistical estimation stability, and optimization procedures. VaR was initially applied in the financial field. It combines financial theory with mathematical statistics and employs a single index to measure the market risk of a portfolio. As a statistical concept, VaR is digital which refers to the situation when an institution experiences normal market volatility. Its financial products may encounter the largest potential loss value due to future price fluctuations. Kang et al. 15 introduced the VaR model to generate route choices for a hazmat transportation network at a specified risk confidence level.
Toumazis and Kwon have done significant work on the application of the VaR model, and their major contribution is integrating the conditional value-at-risk (CVaR) to be more applicable in solving the extreme events. Besides the research using the CVaR model to optimize the time schedule, they also employed it to mitigate risk in hazardous material transportation in a time-dependent vehicular network. Their work indicated that the optimal route differed if the departure time differed. Both optimizations are appropriate for a given origin–destination pair. 16 Toumazis and Kwon 17 also promoted a worst-case CVaR model within a time-dependent vehicular network to choose optimal routes and departure times. He reduced the risk only in the probability space, which did not involve a fuzzy environment. This article introduces the fuzzy theory into the VaR model, describes the consequence once an accident occurs, and provides the decision makers with the optimal choice within the acceptance range.
Monte Carlo simulation is a common and traditional approach to solve uncertain phenomenon. Pet-Armacost et al. 18 used it to conduct accident probability analysis for the unknown reason, which could cause an accident whether the tank uses a relief valve or not. Kazantzi et al. 19 also employed this approach to optimize transportation networks to achieve minimum cost based on a variety of reasons (e.g. large spill, small spill, and large leak). However, it is not applicable to this article because the research objective is different. It optimizes route planning according to the result of risk (i.e. accident consequence). Meanwhile, there is no specific reason analysis such as leaks and the data are derived from mathematical statistics. Furthermore, Monte Carlo simulation works for the random events, while the method proposed in this article focuses on fuzzy events. The credibility measure is analogous to the probability measure in random environments.
This article is organized as follows: section “Credibility theory” introduces related definitions and theorems about credibility theory. Section “chance-value-at-risk (ChVaR) modeling for hazmat transportation” proposes a new model named ChVaR and completes the proof process. Section “Solution procedure” describes the algorithms in the model. Section “Case study” provides two different scale examples to explain the proposed model. At the end of this article, a brief conclusion is presented.
Credibility theory
Zadeh 20 first addressed the term “fuzzy” in contrast to traditional mathematics, fuzzy theory can yield better solutions to uncertain problems. It describes a problem via a membership function that is analogous to a probability function of a stochastic event. Zadeh also defined two measures: possibility and necessity. Both measures satisfy the properties of normality, nonnegativity, monotonicity, and semicontinuity. The only shortcoming is that they cannot satisfy the self-dual property. Due to its importance and the practicality of the self-dual property, Liu and Liu 21 proposed a new measure named the credibility measure, whose objective was to compensate this shortcoming. Thus, the theory of credibility measure satisfies not only the normality and monotonicity axioms but also the self-dual and partial maximality axioms. Since credibility theory is employed in this article, a brief introduction to related definitions and theorems is given.
Definition 2.1
Let
The triplet
Definition 2.2
Let

Definition 2.3
Let
Definition 2.4
Assume that

Theorem 2.1 (Credibility inversion theorem)
Let

Definition 2.5
Let

is referred to as the α-pessimistic value to
For example, assume that a triangular fuzzy variable

If

Definition 2.6
The fuzzy variables

for any set
Theorem 2.2 (Zadeh’s extension principle)
Assume that

Definition 2.7
Let

ChVaR modeling for hazmat transportation
Parameter definitions
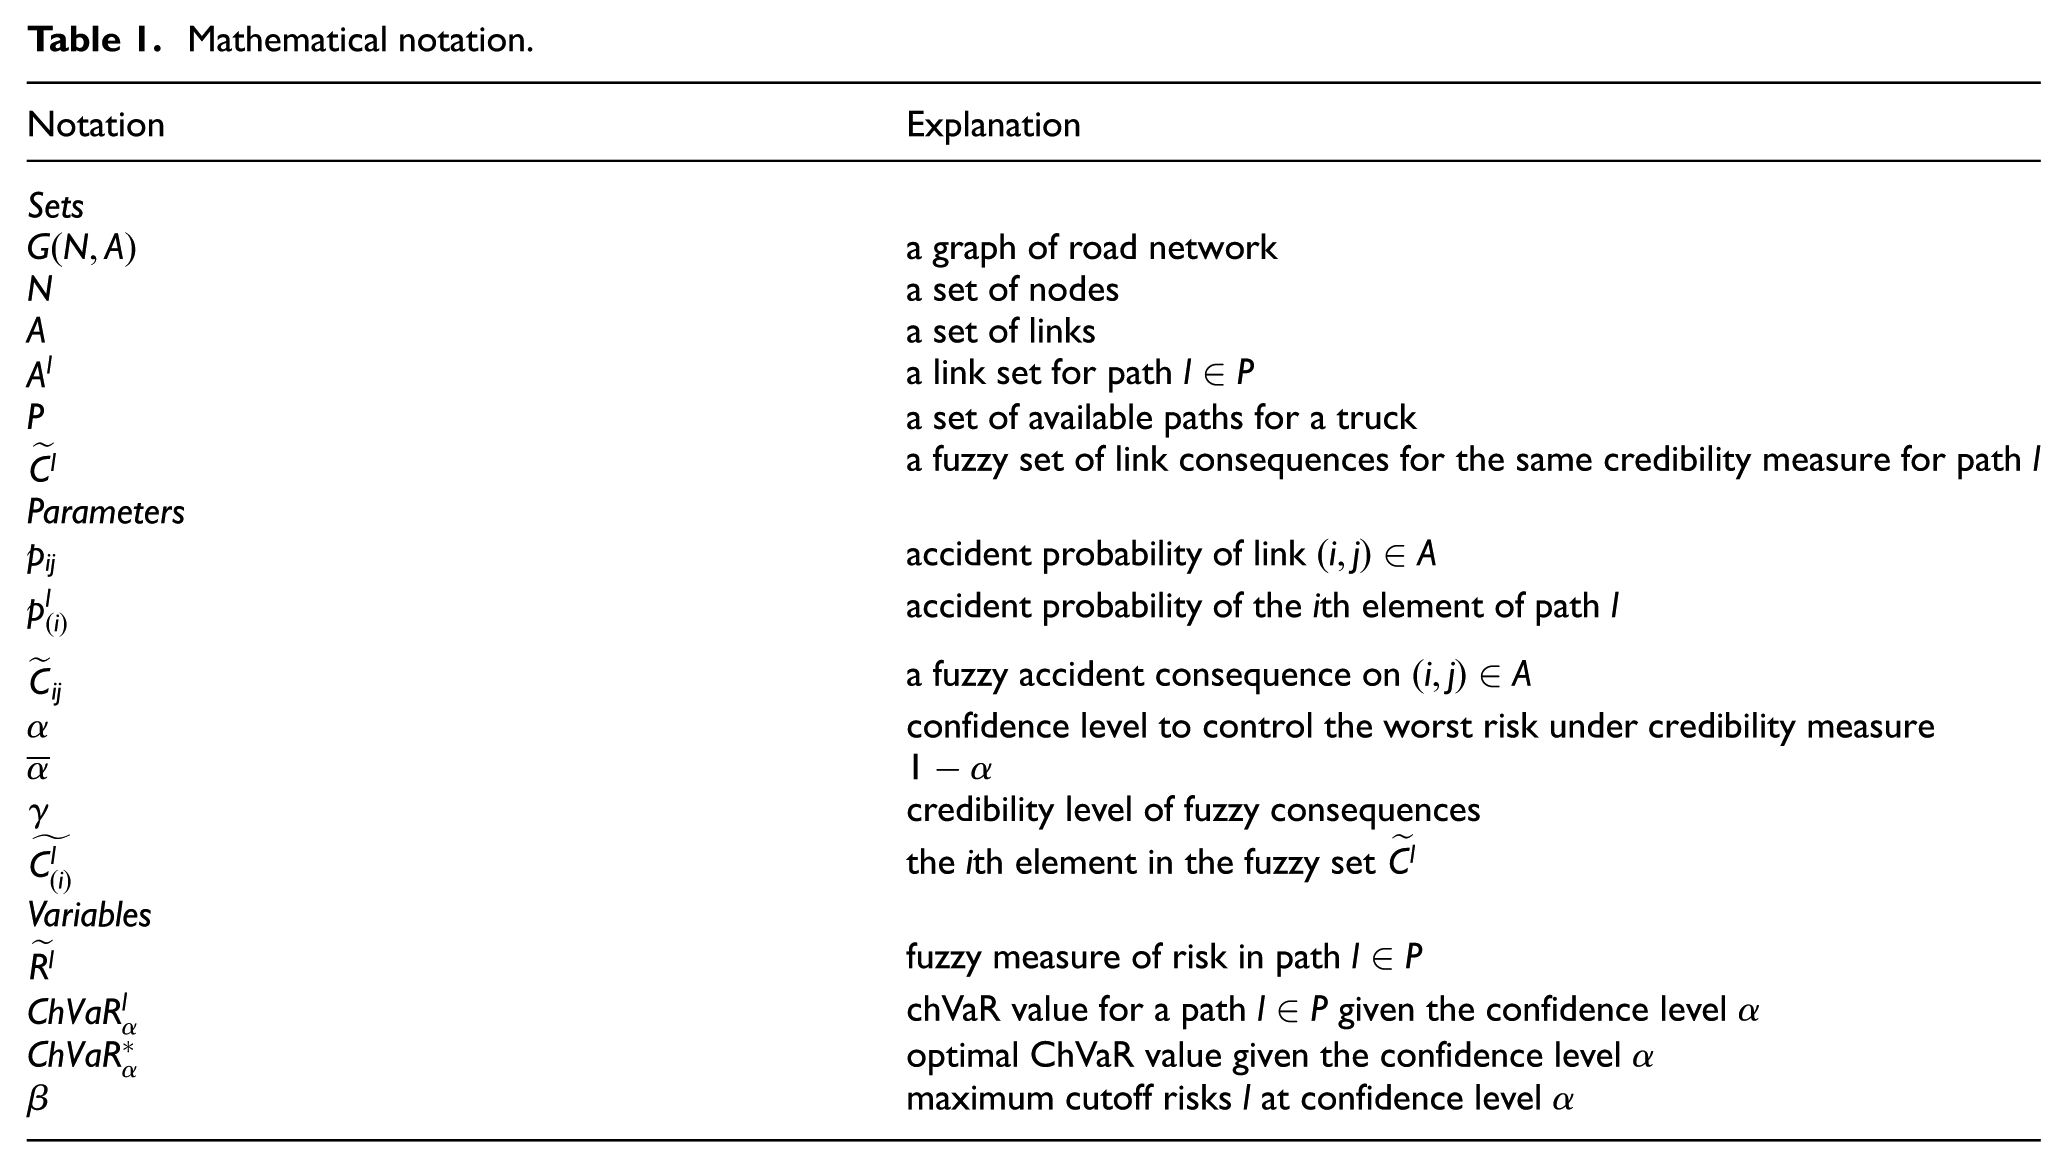
The route schedule model can serve two groups: local citizen and government. Each chooses a different path because of different interests. The model proposed in this article can give reasonable solutions. A transportation network is defined as
Mathematical notation.
ChVaR definition of hazmat route
VaR definition of hazmat route
The notation of the VaR model has been employed in the financial field. The main goal is to minimize the investment risk, which is a type of risk management. Kang et al.
15
extended the VaR model to the hazardous material transportation field and aimed at a single trip for a risk optimization problem. The risk that occurs on the hazardous material transportation path is considered to be a random variable. For an arbitrary path, the VaR value is defined as the minimum risk value, where the probability of risk that is larger than the minimum value is less than

ChVaR definition of hazmat route
After Zadeh 28 proposed the notion of the necessity measure and the possibility measure, the credibility measure was proposed by Liu and Liu. 24 Traditionally, the possibility measure is considered to be parallel to the concept of the probability measure. However, in fuzzy set theory, the credibility measure serves the role of a probability measure. The ChVaR model proposed in this article is a distortion function of the VaR model for the credibility measure. The new model introduces fuzzy variables; thus, the random variable of the probability measure can be converted into a chance measure of fuzzy random variables.
The advantages of applying the distortion function of the VaR model to hazardous material transportation are as follows:
First, fuzzy variables are introduced in the VaR model to provide a detailed description of random events. Compared with the probability measure, the credibility measure utilizes a membership function to describe fuzzy events. It is more appropriate for an actual situation.
Second, to obtain the optimal solution, the credibility measure is more reliable than the probability measure from the perspective of the definition of the credibility measure. If the credibility measure of an event is 1, the event is destined to occur. However, even if the probability measure of an event is 0.9, it may not occur.
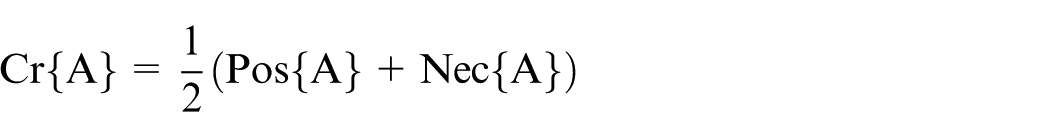
Third, the credibility measure is the average of the possibility measure and the necessity measure. Compared with the probability measure, the credibility measure has a self-dual property and is more convincing, which increases a person’s self-perception of risk.
Formula (1) is equivalent to the following
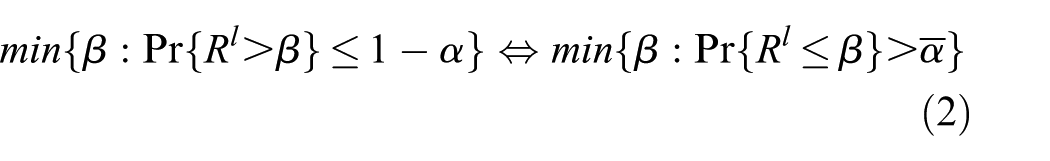
According to Erkut and Ingolfsson, 29 the risk during hazardous material transportation on a path is defined as the transportation accident probability multiplied by the number of people affected, that is

where
To improve equation (2), this article proposes a new model, which is defined as follows

We set


For a certain probability, the model will choose a path with the least risk that satisfies a certain chance measure that is less than a certain value; that is, on the level of the credibility measure
Modeling of the hazmat ChVaR problem

Proof
We note that if the credibility level

The cumulative distribution function of

where
According to

which completes the proof.
Solution procedure
In this section, we propose two algorithms to solve equation (7). In the process of analyzing the model, many factors should be considered, such as the time of traversing a path and the cost of a specified route. However, to some degree, these factors are in direct proportion to the total length of a path. Since the risk is influenced by many aspects, including the length, we primarily consider the length and the risk.
Algorithm 1
Before we reformulate this problem, we need to perform the following two-step preprocess:
First, using a shortest path algorithm, such as Dijkstra’s algorithm or the K-shortest path algorithm, we need to obtain a series of paths that can provide a decision maker with multiple choices.
Second, based on the first step, we must perform an investigation to attain the number of influenced people and the accident probability for each arc of each available path, which can be derived from statistical data.
After these two steps, we can apply equation (7) for any optional shortest path according to the range of influenced people and the probability of accidents, using all arcs to obtain the distribution of fuzzy random variable, namely the risk. Model (6) includes two layers: the outer layer is a probability problem and the inner layer is a credibility problem. The outer layer problem can be solved by the traditional method, using a random sample from the sample space according to the probability distribution of Pr, whereas the inner layer can employ fuzzy simulation to acquire the pessimistic value at a certain credibility level. It returns the level of risk within the specified probability. The fuzzy simulation is introduced in section “Algorithm 2.”
The previously mentioned procedure can be summarized as follows:
Step 1. According to the length of the arcs, use a shortest path algorithm, such as Dijkstra’s algorithm or the K-shortest path algorithm, to obtain a series of optional routes.
Step 2. For each route, from Definition 2.7, we can easily obtain the distribution of the fuzzy random variable, which is risk, via traversing the influenced people of all arcs and the probability of accidents.
Step 3. According to the probability distribution of Pr, take a random sample
Step 4. Use the fuzzy simulation to calculate the pessimistic value
Step 5. Sort the array
Next, we introduce the fuzzy simulation in Algorithm 2.
Algorithm 2
If

Since
The fuzzy simulation can be described as follows:
Step 1. Initialize a small real number
Step 2. Randomly generate vectors
Step 3. Calculate the minimum and maximum values
Step 4. Set
Step 5. If
Step 6. If
Step 7. Return
The algorithm in this article is designed according to the physical structure of the proposed model. When calculating the credibility measure of fuzzy variables in the inner layer, the fuzzy simulation algorithm is proposed by the definition of credibility measure by Professors B Liu and K Iwamura, 31 since every time of the fuzzy simulation is a mass of repetitive process which obeys a certain random distribution, so the calculation of the probability measure in the outer layer is decided by the distribution of the statistic results. Hence, according to the order value, the proposed algorithm can correctly provide a feasible solution to equation (7).
Case study
In this section, we employ two cases to illustrate the feasibility of our proposed model. The first case is a small-sized network, and the second case is a middle-scale network.
Case 1
This case is presented in Figure 1. The network includes 9 nodes and 12 arcs. Six paths are available from the source node (node 1) to the destination node (node 9). The six paths are listed in Table 2.

A small network for the hazmat ChVaR problem
Optional path.

To better understand the ChVaR model, we examine how the probability measure and the credibility measure influence the ChVaR value. For example, the path

Optional path
The risk from traversing the path has the following distributions

We use Algorithm 1 to calculate the ChVaR value for different probability levels and different credibility levels, and the results are as follows (Table 3).
Results of optional paths.

Next, we list the conclusions that we observe from Table 3:
First, different ChVaR values exist for different probability and credibility measures. For example, for the path
Second, for an appointed route, such as the probability and the credibility measure increase, the ChVaR values also increase.
Finally, the best path has the least risk value among all candidate paths. When
These results are gained by simulation. Next, we use the algorithm in Kang et al.
15
Using

Several probability measures are selected to compare the exact values with the simulation results and record the results in Table 4.
Comparison of the results of VaR and ChVaR models.

In Table 4, the probabilities are 0.8000, 0.9000, 0.9326, 0.9584, 0.9855, and 0.9967. The exact values from the VaR model are 310, 487, 507, 600, 733, and 797. The simulation results are 309.9985019, 486.9956307, 506.9956301, 599.9969755, 732.9946567, and 796.9985433. The relative errors range from 0.15% to 0.54%, which implies that the fuzzy simulation can obtain a satisfactory approximation for the model.
Case 2
To verify the effectiveness of the algorithm and better understand the practicability of the model, we utilize the transportation network in Changchun City, China, and simplify the main roads of the cities. The topological graph is shown in Figure 3 consisting of 51 nodes and 82 arcs. The incident probability and the number of influenced people for each arc are obtained from the Jilin Province Transportation Administration Bureau. The data are provided in Appendices 1 and 2.

Graphical representation of node 1 to node 51.
Using Algorithm 1, we obtain the results shown in Table 5. The second column contains the alternative routes obtained by the k-shortest path algorithm, the third column contains the total distances of the route, and the fourth to the seventh columns contain the ChVaR values under different probabilities and credibility measures.
Corresponding ChVaR values at different levels (Len = Length).

As shown in the table, using the k-shortest path algorithm, 10 optional shortest paths are presented, namely

Graphical representation of routes.
On the other hand, the three best paths are P 3 , P 7 , and P 5 because their ChVaR values, namely, risk, are the smallest among the 10 optional paths. Comparing the best and the worst routes, we can clearly know that there is little difference in the distances of these paths, but the risk of the best path is almost half that of the worst path. The decision makers can choose a reasonable path according to their preference standards. From the last three graphs of Figure 4, we know that the optimal routes are located near the suburbs of the city. These routes avoid crowded areas to some degree, which improves public satisfaction regarding hazardous material transportation.
Conclusion
This article demonstrates new ideas that modify the VaR model. The new model ChVaR introduced fuzzy variables and is better adapted for hazardous materials. The objective of the proposed model is to minimize the total potential risk. This model is applied to a practical case of hazmat transportation in Changchun, which is China’s road network, at several probability and credibility levels. Although the definition of the ChVaR model is simple, it shows an advantage in optimizing and reducing the risk on the road. The model is important to decision makers because it provides a flexible framework for decision makers with different optimal routes at different probability and credibility levels. However, the model cannot be applied in a large-sized network. Future research will consider additional real-life factors, such as the total cost impact to risk, and explore an efficient algorithm to solve the model.
Footnotes
Appendix
The number of influenced people (0 denotes no direct arc between nodes).

| C | 2 | 3 | 4 | 5 | 6 | 11 | 13 | 14 | 15 | 16 | 26 |
|---|---|---|---|---|---|---|---|---|---|---|---|
| 1 | (10,80,90) | (5,20,40) | 0 | 0 | 0 | (10,50,90) | 0 | 0 | 0 | 0 | 0 |
| 2 | 0 | (15,90,100) | 0 | 0 | (60,70,80) | (40,70,90) | 0 | 0 | 0 | 0 | 0 |
| 3 | (15,90,100) | 0 | 0 | 0 | 0 | (20,50,60) | 0 | 0 | 0 | 0 | 0 |
| 4 | 0 | 0 | 0 | (40,60,70) | 0 | 0 | 0 | (30,90,110) | (60,100,110) | 0 | 0 |
| 5 | 0 | 0 | (40,60,70) | 0 | (40,60,70) | 0 | 0 | 0 | 0 | 0 | 0 |
| 6 | (60,70,80) | 0 | 0 | (40,60,70) | 0 | 0 | 0 | 0 | 0 | 0 | 0 |
| 11 | (40,70,90) | (20,50,60) | 0 | 0 | 0 | 0 | (40,80,120) | 0 | 0 | 0 | 0 |
| 13 | 0 | 0 | 0 | 0 | 0 | 0 | (50,90,150) | 0 | 0 | 0 | |
| 14 | 0 | 0 | (30,90,110) | 0 | 0 | 0 | (50,90,150) | 0 | (40,80,140) | (30,70,100) | (50,90,150) |
| C | 26 | 28 | 29 | 30 | 38 | 39 | 40 | 46 | 47 | 48 | 51 |
| 15 | 0 | (50,90,150) | 0 | 0 | 0 | 0 | 0 | 0 | 0 | 0 | 0 |
| 16 | (35,75,105) | 0 | 0 | 0 | 0 | 0 | 0 | 0 | 0 | 0 | 0 |
| 26 | 0 | 0 | 0 | (100,120,160) | (60,120,160) | 0 | (80,100,120) | 0 | 0 | 0 | 0 |
| 28 | 0 | 0 | (50,70,90) | (110,125,170) | 0 | (70,90,100) | 0 | 0 | 0 | 0 | 0 |
| 29 | 0 | (50,70,90) | 0 | (120,130,160) | 0 | (60,70,80) | 0 | 0 | (60,90,110) | 0 | 0 |
| 30 | (100,120,160) | (110,125,170) | (120,130,160) | 0 | (130,160,180) | (60,90,120) | (30,60,80) | 0 | 0 | 0 | 0 |
| 38 | (60,120,160) | 0 | 0 | (130,160,180) | 0 | 0 | (90,140,180) | 0 | 0 | 0 | 0 |
| 39 | 0 | (70,90,100) | (60,70,80) | (60,90,120) | 0 | 0 | (80,100,130) | (80,100,130) | 0 | 0 | 0 |
| 40 | (80,100,120) | 0 | 0 | (30,60,80) | (90,140,180) | (80,100,130) | 0 | (60,100,130) | 0 | 0 | 0 |
| 46 | 0 | 0 | 0 | 0 | 0 | (80,100,130) | (60,100,130) | 0 | (50,80,100) | (30,70,90) | 0 |
| 47 | 0 | 0 | (60,90,110) | 0 | 0 | 0 | 0 | (50,80,100) | 0 | (30,70,90) | 0 |
| 48 | 0 | 0 | 0 | 0 | 0 | 0 | 0 | (30,70,90) | (30,70,90) | 0 | (10,30,60) |
Handling Editor: Fakher Chaari
Declaration of conflicting interests
The author(s) declared no potential conflicts of interest with respect to the research, authorship, and/or publication of this article.
Funding
The author(s) received no financial support for the research, authorship, and/or publication of this article.