
Abstract
Aiming at connatural limitations of extreme learning machine in practice, a new fault diagnosis method based on wavelet packet-energy entropy and fuzzy kernel extreme learning machine is proposed. On one hand, the presented method can extract the more efficient features using the wavelet packet-energy entropy method, and on the other hand, the sample fuzzy membership degree matrix U, weight matrix W which is used to describe the sample imbalance, and the kernel function are introduced to construct the fuzzy kernel extreme learning machine model with high accuracy and reliability. The experimental results of rolling bearing and check valve are obtained and analyzed in MATLAB 2010b. The results show that the proposed fuzzy kernel extreme learning machine method can obtain fairly or slightly better classification performance than the traditional extreme learning machine, kernel extreme learning machine, back propagation, support vector machine, and fuzzy support vector machine.
Keywords
Introduction
The extreme learning machine (ELM) is proposed to obtain faster training speed and better generalization performance in the research process of single-hidden layer feed-forward neural network (SLFN). 1 ELM, as a kind of rapid development and effective machine learning technique, has became the focus and hot topic in many fields since it has been proposed.2,3 This work mainly focuses on the ELM application in fault classification field. Liu et al. 4 have proposed the extreme support vector machine (E-SVM) by substituting ELM kernel for SVM kernel to obtain better results. But the widespread application of ELM in classification field should attribute to the significant research that the classification problem based on ELM can be turned into the optimization problem in theory. 5 Since then, ELM has been rapidly developed and applied in the field of fault diagnosis.6–8 Hu et al. 9 proposed a multi-stage ELM to diagnose the faults of the hydraulic tube and improve the accuracy of clustering. In this method, the input data sets were divided into several stages. And then, every stage was analyzed using ELM independently. Compared to individual ELM, this method can obtain better performance. Xu et al. 10 have presented an extension sample classification-based extreme learning machine ensemble (ESC-ELME) method to achieve higher accuracy and faster response in the complex process of fault diagnosis. Yet, essentially, ESC-ELME is an integration of multi-ELMs. Sharma et al. 11 proposed multi-classes ELM method to monitor the external faults of excited induction motors and compared its performance with multilayer perceptron neural network. The results revealed that ELM algorithm is quite faster and it can reduce the computational load.
However, in actual production process, the inherent limitations of ELM hinder its wide application. These limitations include but are not limited to (1) how to determine the number of neurons, the transfer function of the hidden layer, and the parameters of ELM? and (2) how to choose the sensitive features by combining with the suitable data processing algorithm to construct the ELM model? To address these questions, the improvement of ELM is one of the most important and difficult points in the research and application of ELM.1–2 Razavi-Far et al. 12 have proposed an adaptive incremental ensemble of ELM for fault diagnosis of multiple bearing defects. The proposed method contains two major units of data processing and decision-making. The method received time-domain feature subsets chunk by chunk, incrementally trained a set of ELMs to classify bearing defects, allowed the ELM to cross check, and adjusted their decision to diagnose new classes of defects. Yang et al. 13 developed a new ELM optimized by quantum-behaved particle swarm optimization (QPSO) to diagnose faults of the gas turbine fan engine. The QPSO has been used to select optimal network parameters including the number of hidden layer neurons and the norm of output weights. The results shown that the proposed method was a more reliable and suitable method than conventional neural network and other ELM methods for the defect diagnosis of the gas turbine engine. Luo et al. 14 proposed a hybrid system, named as hybrid gravitational search algorithm-ELM, to diagnose the fault of rolling element bearings. And the real-valued gravitational search algorithm (RGSA) has been employed to optimize the input weights and bias of ELM, and the binary-valued gravitational search algorithm (BGSA) has been used to select important features from a compound feature set in this method. Lu et al. 15 developed a novel method, named as dual reduced kernel extreme learning machine (DR-KELM), to improve the sparsity of KELM, which incorporated traditional greedy forward learning algorithm into backward learning algorithm to gain more sparsity and reduce testing time further. The application of DR-KELM in aero-engine fault diagnosis also demonstrated its superior performance with more sparse structure. Wu et al. 16 proposed a new fault diagnosis method based on improved extreme learning machine (IELM) to solve the weakness (weak generalization ability, low diagnostic rate) of traditional fault diagnosis with feed-forward neural network algorithm. By introducing principal component analysis, the proportion of each input parameter has been determined according to the contribution rate of each of input vector, and it has been regarded as weight parameter of ELM. Chen et al. 17 have presented an optimized KELM to diagnose the fault of photovoltaic arrays. In this method, the Nelder–Mead simplex method has been employed to optimize the parameters of KELM which directly affect the classification performance. The experimental results also shown that the proposed method has improved the reliability, efficiency, and safety of photovoltaic power station. Rauber et al. 18 have systematically compared the classification performance of the ELM with alternative classification models, such as SVM, decision tree, and random forest. And the developed method has been applied to diagnose the fault of complex motor pump system and achieve better result. Mao et al. 19 have proposed an online sequential prediction method for imbalanced fault diagnosis problem based on ELM. This strategy can effectively reduce the information loss when dealing with data imbalance problem. Yao et al. 20 have combined the multi-scale intrinsic mode function permutation entropy with ELM to propose new intelligent approach for the fault diagnosis of bearing. The method derived more fault information and extracted multidimensional features from the time–frequency domain to reflect the bearing conditions from different perspectives. Wong et al. 21 have shown a new application of ELM in the real-time fault diagnostic system for rotating machinery, and the system has been successfully developed to monitor the component conditions of the gas turbine generator. Different from this viewpoint of network structure, Zhao et al. 22 put forward to improve the limitation of many hidden nodes in traditional ELM from the point of view of data structure. Moreover, according to variable conditions, an intelligent fault diagnosis method based on local mean decomposition–singular value decomposition (SVD) and ELM has been proposed by Tian et al. 23
With the fast development of the ELM, it has obtained certain research and application achievements. However, ELM has still broad space for development in the aspects of theory and application, such as data imbalance, data outlier, data missing, massive data, and nonlinearity. Therefore, a new fault diagnosis method based on wavelet packet-energy entropy (WPEE) and F-KELM is proposed. At the first step, a compound feature sets consisting of energy distribution coefficient and energy entropy are extracted using WPEE. And then, a novel F-KELM is proposed by combining fuzzy membership degree matrix U and weight matrix W. At the same time, the particle swarm optimization (PSO) algorithm is applied to optimize the parameters of F-KELM. Finally, the comparison tests between the proposed method and the state-of-the-art methods (ELM, KELM, SVM, F-SVM, etc.) are carried out. According to the analysis of the experimental results, the important contributions and the conclusions are summarized as follows:
The sensitive and transient features are extracted using the WPEE method in massive data to improve the recognition accuracy and reliability of the subsequent classification models.
The kernel function is introduced in the data processing to deal with these issues, including sample nonlinear mapping, the number of neurons and the output matrix H of the hidden layer. According to the input and output sample properties, the proper kernel function is selected to calculate the output matrix H.
The sample membership degree matrix U and the weight matrix W which is used to describe the sample imbalance are introduced to construct the F-KELM classification model with high accuracy and reliability. It can not only obtain the similar performance with the original ELM, KELM, back propagation (BP), SVM, and F-SVM but also solve the above-mentioned problems in original ELM.
The remainder of the article is organized as follows. Section “Background theory” outlines the principles of wavelet packet decomposition, ELM, KELM, and F-KELM. The specific implementation process of the proposed method is given in section “Fault diagnosis method based on WPEE and F-KELM.” The experimental results are analyzed in section “Performance evaluation.” Section “Conclusion” ends this article with conclusions and future work.
Background theory
Wavelet packet decomposition
Wavelet packet analysis can decompose and reconstruct a signal with little loss of information. Compared to wavelet analysis, wavelet packet analysis can not only decompose the low-frequency part but also achieve secondary decomposition of the high-frequency part. So, its signal analysis ability is stronger. 24
The subspace
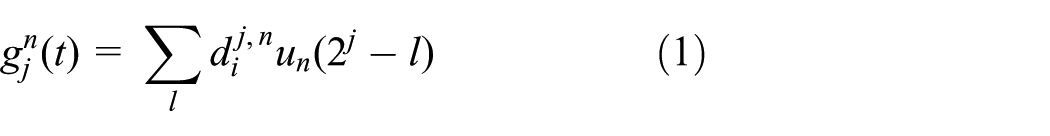
Using wavelet packet decomposition algorithm, we can calculate


where
Using wavelet packet reconstruction algorithm, we can calculate

where
ELM
The typical structure of the ELM is shown in Figure 1.

Typical structure of the ELM.
The principle of ELM is briefly described according to Figure 1. A detailed description of ELM refers the study of Huang and colleagues.1,25 Given N training samples

where H = [h1(x), …, hL(x)] is the output matrix of the hidden layer, in which L is the number of neurons in the hidden layer; β is the output weight; and Y is the target vector. The calculation of H is the core of ELM model. There are many efficient methods to solve the above problems, such as SVD and generalized inverse.2,26,27
At the same time, we can also see that the essence of the ELM is similar to the BP neural network with single hidden layer. The major distinction between the BP neural network and the ELM is that ELM can obtain the faster training speed by randomly given bias b of the hidden layer and the connection weight matrix w.
KELM
Actually, the solution of original problem can be turned into a classification optimization problem in ELM. From the perspective of optimization, the realization principle of ELM is also similar to SVM and least squares support vector machine (LSSVM). The ultimate goal is to obtain the minimum training error and the largest classification margin, named as generalization capability. According to the optimization structure of SVM, 27 the optimized mathematical model of ELM can be formulated

where
Based on the Karush–Kuhn–Tucker (KKT) theorem, the optimal solution of equation (6) is solved and the detailed solution procedure has been described in the study of Huang and colleagues.1,2,5 Combining equation (5) with equation (6), the optimal solution of equation (6) is given as

where
Given the new testing samples, the output of ELM is Y′ = sign h(x)β. According to equation (7), the output Y′ can be expressed as follows
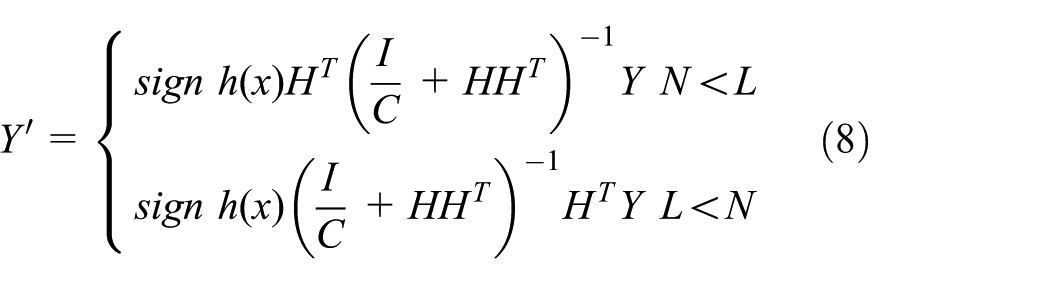
According to the kernel function mapping theory, 28 ELM model based on kernel function, named as KELM, is shown in equation (9)

where
Discussion of the F-KELM
The kernel function is introduced to turn the choice problem of hidden layer neurons into kernel-function feature mapping in KELM. KELM can overcome the adverse effects of the choice problem of hidden layer neurons, but it cannot solve the problem of data imbalance, data outlier, and data missing. Therefore, a new classification model, called as F-KELM by combining fuzzy membership degree with weight factor and ELM, is proposed. The advantages of the proposed method are shown as follows:
The weight matrix W is used to solve the problem of data imbalance.
The membership degree matrix U can effectively solve the uncertainty problem of dataset category.
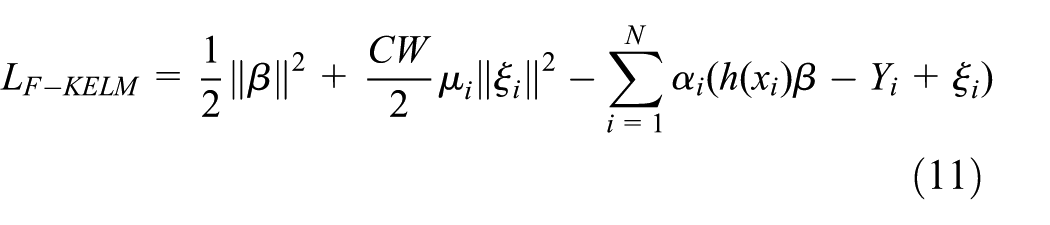
The theoretical solution process of the F-KELM is also illustrated in the case of binary classification. Given dataset ([Xi,Yi], i = 1, …, M) is a binary classification. In other words, “Yi = + 1” denotes positive sample. Conversely, “Yi = −1” is a negative sample. The estimation of the weight matrix W satisfies the following principles: W is given smaller value when Xi comes from the high-proportion data sample and vice versa. At the same time, the sample fuzzy membership degree matrix U is also used to describe the uncertainty problem of the sample category. equation (6) can be converted into the following expression

Based on KKT theorem, equation (10) is equivalent to solving the following dual optimization problem
where ai is the Lagrangian multiplier. The optimality conditions based on the KKT are described as follows
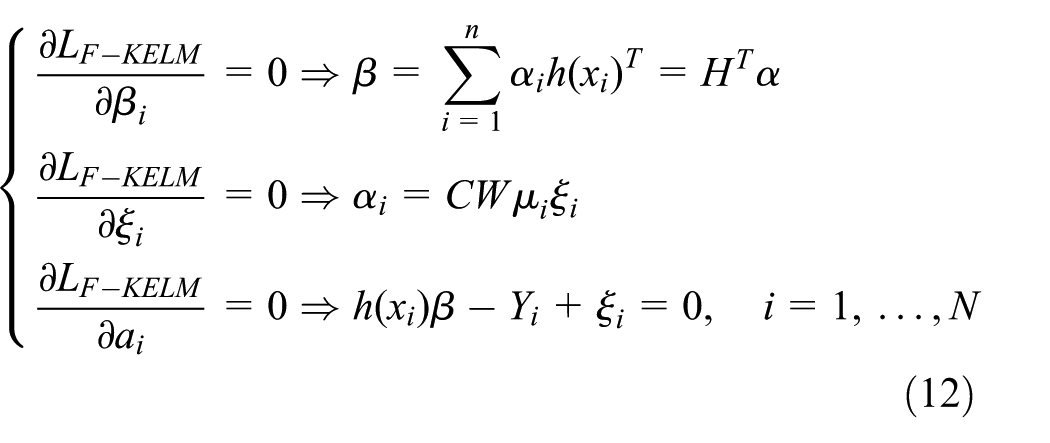
and equation (12) can be equivalently written as

where fuzzy membership degree matrix


For m-category cases, the predicted category label of a test set is the index number of the output node, which has the maximum output value

Fault diagnosis method based on WPEE and F-KELM
The implementation process of the proposed method is shown in Figure 2, including vibration signal pre-processing, feature extraction, and pattern recognition. The normalization of signal is realized in the pre-processing process. The feature extraction and pattern recognition are the important key parts of the proposed method and will be discussed in detail.
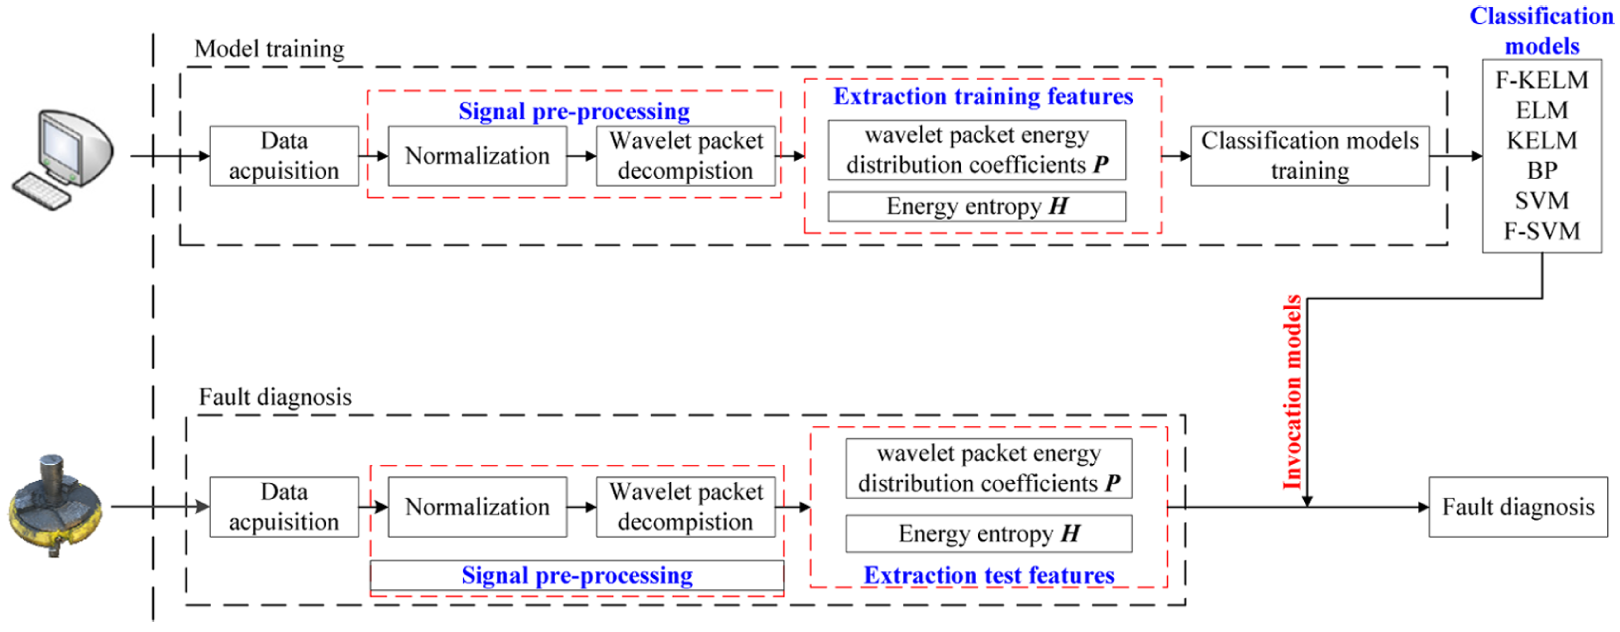
Implementation process of the proposed method.
Feature extraction
When a fault occurs, the stiffness of mechanical structures around the fault must change, which can produce an impulse or shock. This impulse may further result in the variation of collected vibration signal. The amplitudes and distributions of these time-domain signal may be changed. Therefore, time-domain statistical features can be extracted from their time-domain waveforms to reflect the mechanical faults. Moreover, frequency spectrum, as a most widely used analysis tool, can reflect the frequency components and distribution of a signal. So, it is vital for fault diagnosis to extract some indicators in the frequency domain. With the advent of time–frequency analysis techniques such as typical wavelet transform and empirical mode decomposition, some effective features can be extracted from time–frequency distribution of a signal and overcome some limitations of features, which are extracted from time domain and frequency domain. In time–frequency domain, the feature extraction makes full use of the advantage of wavelet packet and energy entropy in this article. The energy distribution coefficients and energy entropy of the third-layer wavelet packet decomposition coefficients are extracted as characteristic parameters of the subsequent classification models. 30 Based on the above considerations, the features shown in Table 1 are extracted to construct fault diagnosis models and the validity of the proposed features is compared with time-domain and frequency-domain features.
Statistical features under different domains.

In Table 1, x(n) is a signal series for n = 1,2, …, N and N is the number of data points.
In order to better describe the WPEE features, the implementation processes of feature extraction are described as follows:
Step 1—Signal decomposition and reconstruction. The vibration signal of rolling bearing or check valve is decomposed into three layers with wavelet packet decomposition method, respectively. In this article, “db10” wavelet is the basic wavelet packet base function.
Step 2—Constructing feature vectors. The feature vector T = [P30, P31, …, P37, H] is composed of wavelet packet-energy distribution coefficient P3i and energy entropy H. And then, P3i and H can be calculated by equations (17) and (18)

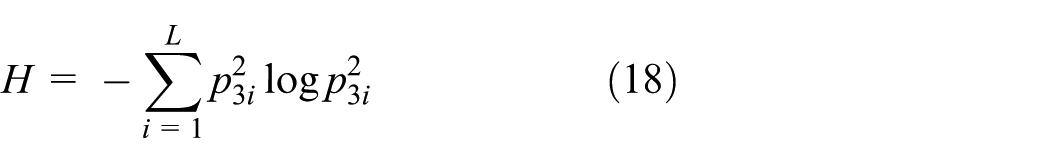
where E3i is the energy of the third-layer decomposition nodes, P3i represents the wavelet packet-energy distribution coefficient which is calculated by the reconstructed signal of the third-layer decomposition coefficients, and L denotes the number of the third decomposition node signals.
Construct classification model
The ELM, KELM, F-KELM, BP, SVM, and F-SVM classification models are established to carry out comparative experiments and illustrate the effectiveness of the presented method. In the aforementioned six classification models, the selection of classification model parameters, which is the key of these classification models, will be elaborated as follows.
Selection of hidden layer neurons
In constructing process of ELM model, the choice of hidden layer neurons can refer the BP neural network. So, the number of hidden layer neurons L has approximation relation with the number of input layer neurons N, namely,
Fuzzy membership degree matrix U
The clustering method based on density function is employed to calculate the fuzzy membership matrix U. The detailed solving process of matrix U has been demonstrated in the study of Wang et al. 29
Imbalance weight matrix W and kernel function parameters
In F-KELM, PSO method is introduced to optimize parameters W and
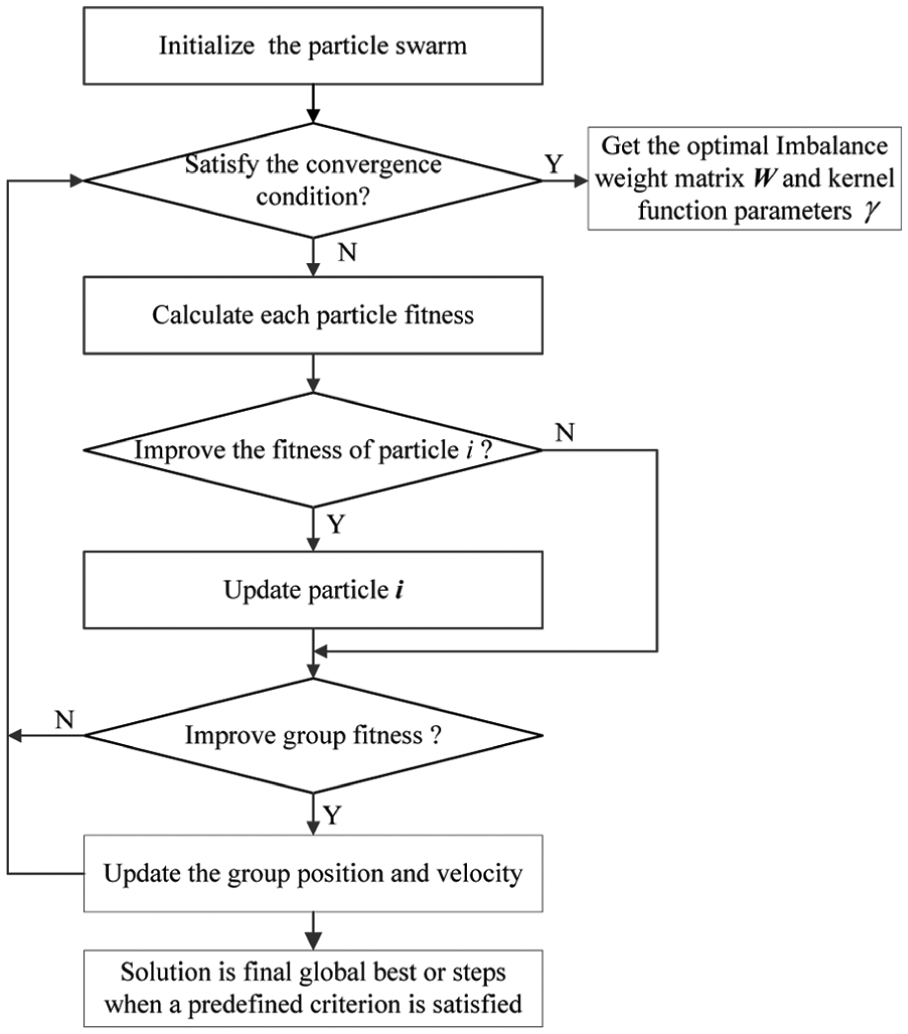
Flowchart of the particle swarm optimization.
In the canonical PSO, each particle i has position zi and velocity vi that is updated at each iteration according to equation (19)

where w is the inertia weight described in the study of Rajeswari et al.,
31

The inertia weight w (which is a user-defined parameter), together with c1 and c2, controls the contribution of past velocity values to the current velocity of the particle. A large inertia weight biases the search toward global exploration, while a smaller inertia weight directs toward fine-tuning the current solutions (exploitation). Suitable selection of the inertia weight and acceleration coefficients can provide a balance between the global and the local search. 31 The PSO algorithm is composed of five main steps:
Step 1. Initialize the position vector z and associated velocity v of all particles in the population randomly. Then, set a maximum velocity and a maximum particle movement amplitude in order to decrease the cost of evaluation and to get a good convergence rate.
Step 2. Evaluate the fitness of each particle via the fitness function. There are many options when choosing a fitness function, and trial and error is often required to find a good one.
Step 3. Compare the particle’s fitness evaluation with the particle’s best solution. If the current value is better than previous best solution, replace it and set the current solution as the local best. Compare the individual particle’s fitness with the population’s global best. If the fitness of the current solution is better than the global best’s fitness, set the current solution as the new global best.
Step 4. Change velocities and positions using equations (19) and (20).
Step 5. Repeat steps 2–4 until a stopping criterion is satisfied or a predefined number of iterations is completed.
Performance evaluation
Fault diagnosis of rolling bearing
Dataset description
The rolling bearing datasets 32 of Case Western Reserve University in the United States are used to verify the validity and reliability of the proposed method. The acceleration sensor is installed on the drive end of the motor without load. The data sampling frequency fs is 12 KHz. The experimental datasets are composed of the vibration signal of the normal condition and three different kinds of fault/defect bearing. The defect diameter is 0.007 and 0.021 in, respectively, and the fault depth is 0.011 in.
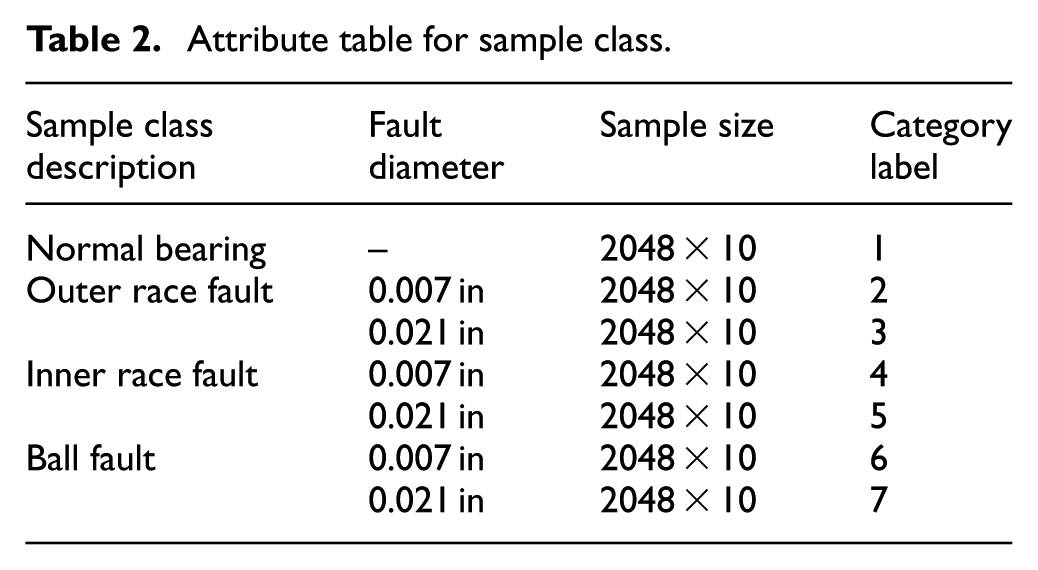
The length N of data sample for each of operating state is 20,480, and then it is divided into a 2048 × 10 matrix. Then, the data of seven different kinds of fault property constitute a 2048 × 10 × 7 sample matrix. In the training process of the model, the 2048 × 6 × 7 samples are randomly selected as the training datasets, and the remaining 2048 × 4 × 7 samples are the test datasets. The feature vectors T_train of WPEE is a 9 × 42 training sample matrix, and the feature vectors T_test is a 9 × 28 test sample matrix. Moreover, the detailed sample attributes are shown in Table 2.
Attribute table for sample class.
Feature extraction
According to the definition of feature extraction in section “Feature extraction,” the WPEE features of rolling bearing can be calculated. The partial features (not all features) extracted by WPEE are shown in Table 3.
Wavelet packet-energy entropy features.

Bold values represent the sensitive/effective features for different operating states.
Comparing the normal bearing with the fault bearing, the operating conditions will be easily distinguished based on the feature parameter P, but it cannot identify the bearing faults in different degrees. However, the bearing faults in different degrees can be distinguished efficiently by combining P with H in this article. It has fully demonstrated that the feature extraction method based on WPEE is effective and reliable. Similarly, in the experiment of check valve fault recognition under sample balanced distribution, taking the above features as the training and test samples of F-KELM, the classification results of different features are shown in Figure 4.

Classification results of different features: (a) time-domain features, (b) frequency-domain features, and (c) WPEE features.
According to the results shown in Figure 4, the presented WPEE features in this article can better describe the state characteristics of check valve and achieve better classification results. Figure 4 also confirms that the effectiveness and feasibility of the extracted features are verified.
Parameter setting of classification model
According to the data description in Table 2, the parameters of the above-mentioned classification models are set based on the following criteria: (1) the number of neurons L of hidden layer in ELM is equal to 19; (2) the initialization parameters of PSO, including acceleration factors c1 and c2, are searched in the range {0, 2}. The empirical values c1 and c2 are assigned as 2. The sample size is searched in the range {20, 40}. r1 and r2 are random numbers in the range {0,1}. The maximum iterations and initial velocity of population are assigned as 300 and 3, respectively. The inertia weight is equal to 0.9, and the update weight of population is 0.6.
Experimental results of balanced sample distribution
In order to verify the effectiveness of the proposed method, the performance of the presented F-KELM method is compared with ELM, KELM, BP, SVM, and F-SVM, respectively. Figure 5 displays the classification results of six different classification models in seven different kinds of running condition for rolling bearing. In the case of balanced sample distribution, the following conclusions can be drawn from Figure 5: (1) the classification accuracy gradually increases and even above 100% in F-KELM and F-SVM algorithm; (2) when the parameters of BP model are consistent with the parameters of ELM model, the classification difference of the two algorithms is not very evident; (3) the classification results of ELM and SVM show that the experimental result of ELM is consistent with the result of SVM in this experiment. This may be related to the fact that ELM is essentially the fusion of BP and SVM. At the same time, when the kernel function is introduced to solve the selection problem of the hidden layer neurons in ELM, the classification accuracy of ELM algorithm can be further improved; (4) in both ELM and SVM algorithms, the introduction of fuzzy mechanism is helpful to improve the classification accuracy.
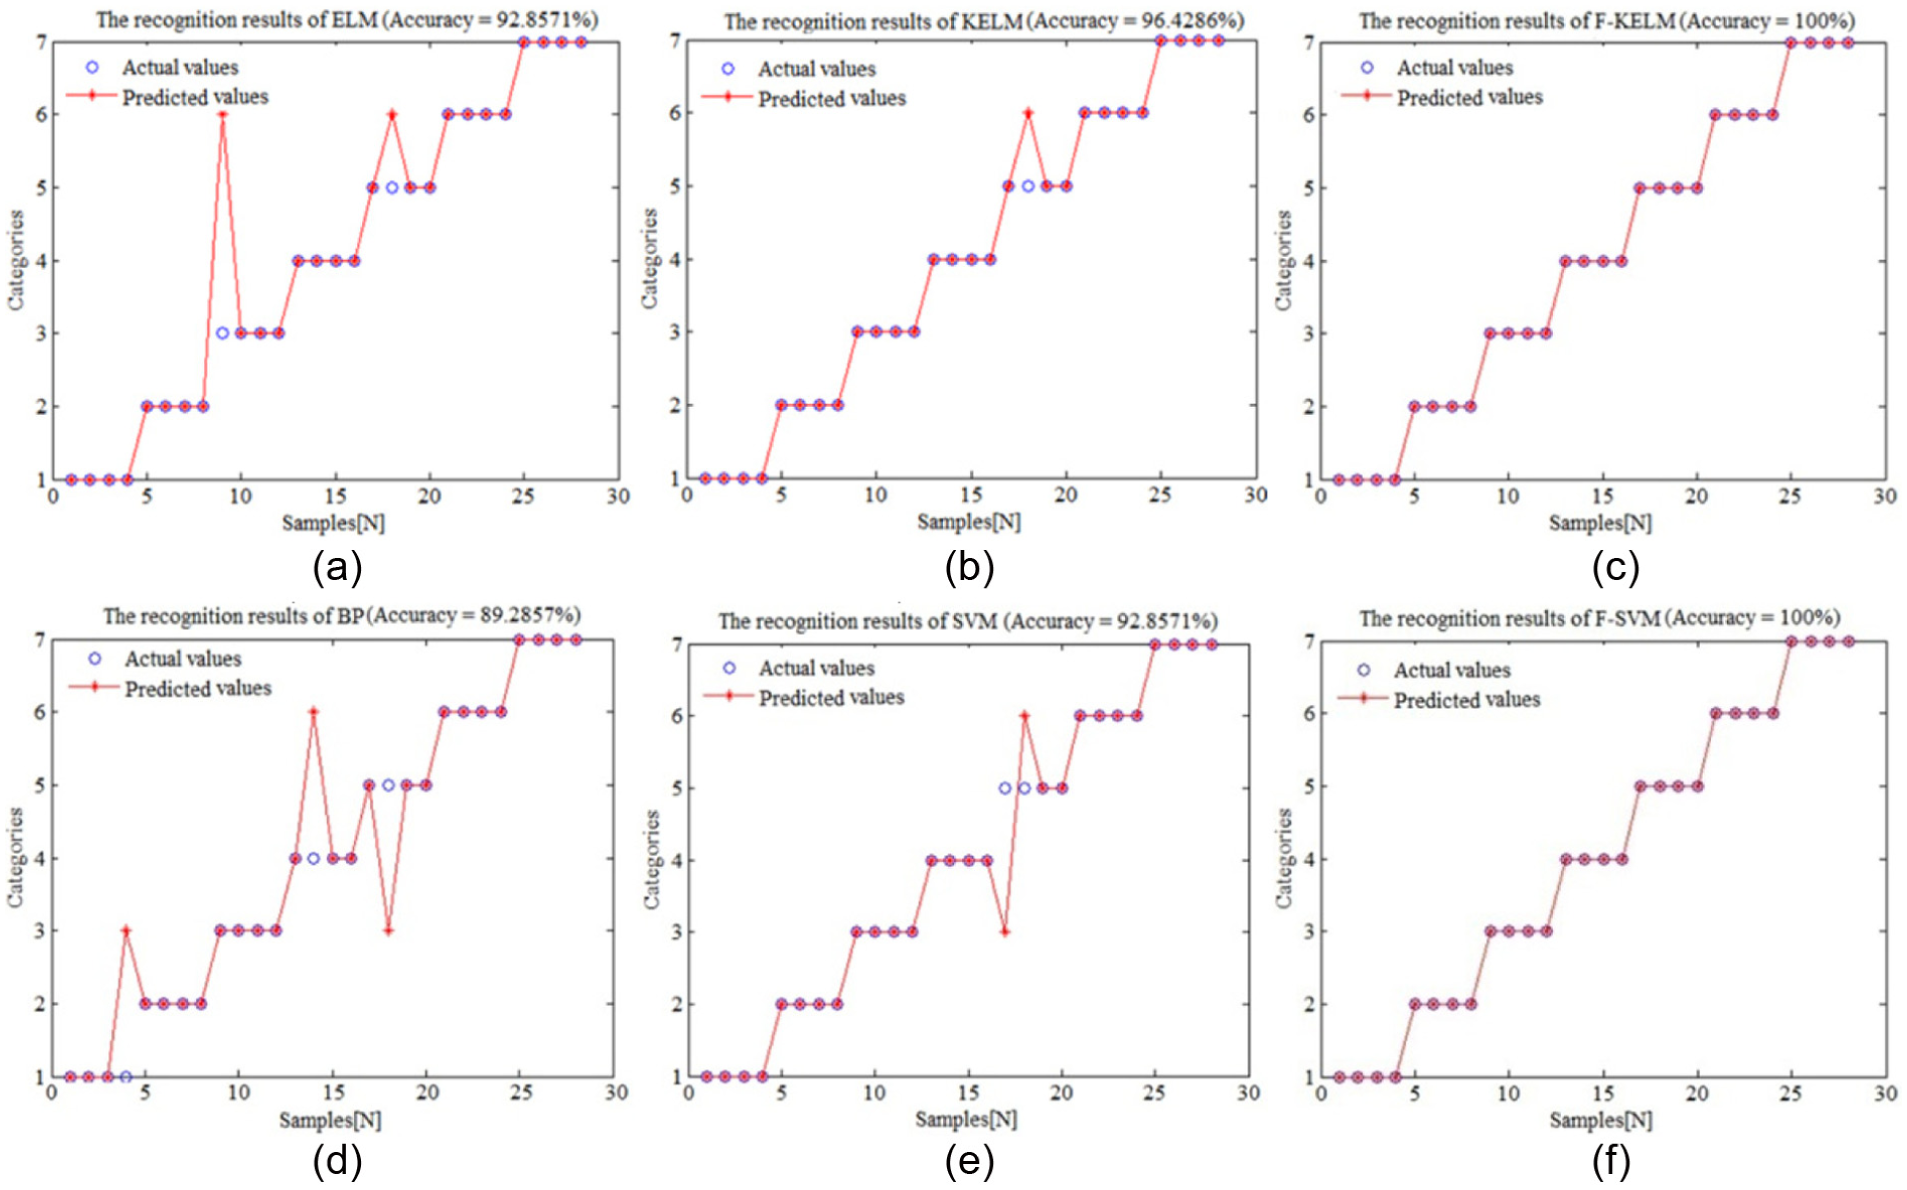
Experimental results of the balanced sample distribution (rolling bearing): (a) ELM, (b) KELM, (c) F-KELM, (d) BP, (e) SVM, and (f) F-SVM.
Figure 6 represents the PSO fitness curve. The corresponding optimal parameter of classification models can be obtained from Figure 6. C and γ are optimized as 8.1859 and 0.01, respectively. When the number of iterations is 20, F-KELM has obtained the best fitness. But the number of iterations in KELM is 40. The comparison results show that the presented F-KELM method can greatly save optimization time of the model and improve the practical application performance. In addition, the different results of the number of hidden layer neurons on classification performance of the ELM are shown in Figure 7.

PSO fitness curve: (a) optimized process of KELM and (b) optimized process of F-KELM.

Comparison and analysis of classification effect for different hidden layer neurons.
Experimental results of imbalanced sample distribution
Similarly, the parameters C and γ optimized by PSO are 85.8483 and 0.01, respectively, in imbalanced sample distribution. Then, the recognition results of six different classification models are shown in Figure 8.

Experimental results of the imbalanced sample distribution (rolling bearing): (a) ELM, (b) KELM, (c) F-KELM, (d) BP, (e) SVM, and (f) F-SVM.
Because of the imbalanced distribution of data samples, some experimental results which are different from the balanced sample distribution are obtained and shown in Figure 8. Then, some beneficial phenomena can be observed and summarized as follows: (1) the misclassification probability of ELM and BP increases greatly in the case of imbalanced distribution. Then, compared to the balanced sample distribution, the recognition accuracy of ELM and BP slightly decreases with increasing misclassification; (2) by introducing the kernel learning mechanism, KELM can overcome the limitations of selecting the number of hidden layer neurons in ELM, and achieve fairly or slightly better performance than SVM and ELM. But it still cannot remove the effect of imbalanced sample distribution to obtain the ideal classification performance; (3) an interesting fact can also be observed in Figure 8(e). Although the sample is imbalance, SVM can also achieve a slightly better classification performance than ELM. This may be related to the small sample advantage of SVM. Therefore, in order to improve the classification accuracy and reliability of ELM under imbalanced sample distribution, ELM must be improved. The experimental results also show that it is reasonable and feasible to introduce fuzzy mechanism into ELM; (4) in Figure 8(f), we can also see that the introduction of fuzzy mechanism in F-SVM is also helpful to improve the classification accuracy and reliability; (5) in the F-KELM model, the fuzzy membership degree matrix and the sample weight matrix are applied to restrain the influence of imbalanced sample distribution on classification results and improve the recognition accuracy and reliability.
Table 4 is visually designed to demonstrate the classification recognition results of six different classification models for rolling bearing in two different sample distributions.
Experimental results of different sample distributions (rolling bearing).

The statistic results of Table 4 show that the proposed F-KELM method can obtain fairly or slightly better performance than the above-mentioned other methods. By comparing the experimental results of the proposed method with the F-SVM, it can also be seen that the introduction of fuzzy membership is helpful to improve the classification performance. At the same time, the necessity of considering the influence of imbalanced sample distribution on the classification performance of the model is also proved.
Fault diagnosis of check valve
Dataset description
In this section, the data samples of three different running states for check valve are selected as experimental datasets, including normal operation state (NC), stuck valve fault (NK), and valve wear fault (NM). The length of data sample for each of operating state is 61,440, and it is decomposed into a 1024 × 60 matrix. Then, a 1024 × 60 × 3 sample matrix in different condition property is constructed. The feature vector T_train is a 117 × 9 training sample matrix, and the test sample matrix T_test is a 63 × 9 feature vector. The category label is a 63 × 1 matrix. NC, NK, and NM are represented by category labels “1, 2, and 3,” respectively.
Experimental results of balanced sample distribution
As shown in Figure 9, the recognition accuracy of six classification models is 87.3016%, 92.0635%, 95.2381%, 82.5397%, 90.4762%, and 93.6508%, respectively. (In KELM or F-KELM model, the optimized parameters C and γ are 97.3364 and 5.5063, respectively.) Comparing Figure 9 with Figure 5, some similar conclusions are drawn as follows: (1) the classification accuracy is gradually improved by combining with kernel learning, fuzzy membership degree matrix, and the sample weight matrix; (2) Figure 9 also shows that the NK fault is easily misclassified as NC or NM. This is mainly because NK is a special fault type between NC and NM, and it is easy to be misclassified when the difference between the signals is not obvious; (3) in the F-KELM model, kernel learning, fuzzy membership degree matrix U, and the sample weight matrix W are introduced to reduce misclassification of NK fault and improve the classification accuracy of the model; (4) as shown in Figure 9, F-KELM can obtain better results than other algorithms including ELM, KELM, BP, SVM, and F-SVM. The experimental results further prove that the proposed F-KELM method is effective in fault diagnosis of check valve and has an important guiding significance for the fault diagnosis of check valve.

Experimental results of the balanced sample distribution (check valve): (a) ELM, (b) KELM, (c) F-KELM, (d) BP, (e) SVM, and (f) F-SVM.
Experimental results of imbalanced sample distribution
In order to verify the efficiency of the presented method in the case of imbalanced sample distribution, the vibration datasets of the actual high-pressure diaphragm pump check valve are analyzed. The detailed data distribution is shown in Table 5.
Sample attribute of check valve.

Based on the optimized parameters C and γ (the optimization values are 9.1054 and 5.5063, respectively), the recognition results of six different classification models are shown in Figure 10. Compared to the experimental results in Figure 10, it is proved that the proposed method is effective. The proposed method provides a feasible solution for the fault diagnosis of rolling bearing and check valves, and it has a strong practical significance and referential value.

Experimental results of the imbalanced sample distribution (check valve): (a) ELM, (b) KELM, (c) F-KELM, (d) BP, (e) SVM, and (f) F-SVM.
Similarly, Table 6 gives the statistical results of classification recognition accuracy of six different classification models for check valve in two different sample distributions.
Experimental results of different sample distributions (check valve).

The similar conclusions can be obtained by comparing Table 4 with Table 6. At the same time, it is worth noting that the performance degradation of F-KELM and F-SVM is observed, but the performance degradation of F-SVM is more serious than F-KELM in the process of actual fault diagnosis.
Conclusion
In this article, on the basis of analyzing the limitation of ELM and KELM, combining F-KELM with the feature extraction method based on WPEE, a new fault diagnosis method is proposed. Under the conditions of balanced and imbalanced sample distribution, some significant conclusions can be gained through the aforementioned experimental cases:
The classification performance of six classification models (ELM, KELM, F-KELM, BP, SVM, and F-SVM) in experimental platform (rolling bearing) is better than actual field application (check valve). This is mainly because the simulation data of the experimental platform are less disturbed by environmental noise and other components, and so on. At the same time, this is also the reason why the pre-processing of noise has become the focus and difficulty of the research.
The experimental results show that the proposed F-KELM method combining kernel learning mechanism with membership degree matrix U and the weight matrix W can effectively solve the above-mentioned problems in KELM and original ELM, and gain fairly or slightly better performance than ELM, KELM, BP, SVM, and F-SVM in the classification performance. Furthermore, F-KELM can save the optimization time and improve its actual application performance.
The proposed fault diagnosis method based on WPEE and F-KELM can precisely recognize the operation states of rolling bearing and check valve in different degrees. Therefore, it has a great meaning to repair and replace rolling bearing or check valve.
However, the F-KELM cannot assess the classification performance of the multi-kernel functions. In addition, the hypothesis of the same classification cost is unreasonable in actual application, because the difference of misclassification brings the difference of losing. The effect of classification must take the reduction in misclassification as a standard. Therefore, this will be the research focus of our future research work.
Footnotes
Handling Editor: Dong Wang
Author note
Jun Ma is a postdoctoral fellow.
Declaration of conflicting interests
The author(s) declared no potential conflicts of interest with respect to the research, authorship, and/or publication of this article.
Funding
The author(s) disclosed receipt of the following financial support for the research, authorship, and/or publication of this article: This work was supported by the National Natural Science Founder of China (61663017, 51169007, and 51765022) and Science & Research Program of Yunnan province (2015ZC005).