
Abstract
A detailed understanding of the constitutive behavior of AH36 material in continuous casting process was obtained through various high-temperature tensile testing at specific ranges of temperatures (1173–1673 K) and strain rates (10−4−10−2 s−1) using a Gleeble system. A significant variation in flow stress is evident over the entire range of temperatures under different strain rates. The constitutive equation of the AH36 material was suggested based on the time-hardening model. The results indicate that the accuracy of the model is relatively low at the temperatures of 1173, 1573, and 1673 K under the strain rates of 10−2 and 10−4 s−1. Therefore, a modification of the time-hardening model was carried out by including the compensation of strain rate in the Zener–Holloman parameter (Z) to improve the accuracy. Furthermore, the deformation process was distributed into the regions of 1173, 1273–1473, and 1573–1673 K based on the exponent of strain rate at different ranges of temperature. The correlation coefficient between the computed and experimental flow stress data is 0.998. The average absolute relative error is within the range of allowable experimental conditions.
Introduction
The high-strength hull structural steel plates are typically made of AH36 for its excellent comprehensive performance and are widely used in the shipbuilding industry. The strict quality standards of continuous casting plates for AH36 have been developed to meet the performance requirements. The understanding of the constitutive behavior of metal under the conditions of hot deformation is vital to improve the reasonable continuous casting process parameters due to its effective role in dynamic soft reduction and slab bulge deformation. However, it is a difficult task to reasonably determine the constitutive behavior of metal under high temperatures due to the deformation process involving hardening and material dynamic softening mechanisms, such as dynamic recovery and dynamic recrystallization.1–5 Moreover, a comprehensive range of temperatures and large fluctuations of strain rates would exist.
Many investigations have been performed to determine the constitutive behaviors of different metals using experimental methods. The physical models are based on the thermodynamic path, dislocation movement activation energy, and slip dynamics of materials.6–8 The phenomenology models are based on the effects of macro-parameters on flow stress without taking the micro-deformation mechanism into consideration.9–13 However, the expression forms of the physical models are quite complex, and it is difficult to obtain the parameters in these models by data fitting although the physical models have higher accuracy. 14 The phenomenology models based on macro-deformation mechanisms have the advantage of being simple and can be easily used to create a numerical simulation of the metal forming processes. A comparative study of several constitutive models from the phenomenology models and the physical models was carried out by Wang et al. 14 and Li et al., 15 with the results showing that the Arrhenius model with strain compensation has the highest accuracy. The Arrhenius model at elevated temperatures was widely adopted during the study of deforming process due to its various types of equations and easy integration. In these three Arrhenius-type equations, the sine-hyperbolic type of the Arrhenius equation proposed by Sellars and McTegart 13 has been successfully applied for predicting the flow behavior of materials in elevated temperature.16–21 The original equation has been revised several times to suitably depict the flow behavior of various alloys at high temperatures. A strain-dependent parameter was introduced into the sine-hyperbolic constitutive equation to represent the hot deformation process for wrought magnesium alloy MgAl4Zn1 over a wide range of temperatures (523–773 K) and strain rates (0.01–100 s−1). 22 The hyperbolic-sine equation was revised by Lin et al. 23 with the compensation of strain and strain rates to make a better prediction of the flow behaviors of 42CrMo steel at high temperatures of 1123–1423 K and strain rates of 0.01–50 s−1. Following this, the strain-compensated hyperbolic-sine equation was implemented to describe the hot deformation process for various materials by many researchers. Both the strain and strain rate compensation were incorporated into the hyperbolic-sine equation by Mandal et al. 24 to establish the constitutive equation in a Ti-austenitic stainless steel at temperatures of 1123–1523 K and strain rates of 10−3Ȓ102 s−1. The constitutive analysis of Ti–6Al–4V alloy was performed by Cai et al. 25 in a range of temperatures (1073–1323 K) and strain rates (0.0005–1 s−1) using the modified hyperbolic-sine equation. The strain-compensated equation was applied by Lin et al. 26 and Li et al. 27 to investigate the flow behaviors of hot deformation in the aluminum alloy, while Cai et al. 28 proposed the strain-dependent equation of BFe10-1-2 cupronickel alloy in a wide range of temperatures (1023–1273 K) and strain rates (0.001−10 s−1). In addition, the strain was introduced into the hyperbolic-sine equation by Qin et al. 29 to establish the coupled constitutive equation of AH36 steel at temperatures of 1173–1573 K and strain rates of 10−4Ȓ10−2 s−1. However, these models described above are suitable for studies conducted with temperatures lower than 1573 K. The temperature range does exceed 1573 K in the continuous casting process, and the Arrhenius-type equation has been rarely used to represent the flow behavior in elevated temperature during the continuous casting process in recent years with the rapid development of its production technology. In addition, Kozlowski et al. 30 believed that the time-hardening model was the best compared with the Norton law and hyperbolic law because it has the best overall fit to the original test data. Furthermore, this model characterizes variations in temperature reasonably well, particularly at higher temperatures. Wide variations in the strain rate are also well-modeled with the time-hardening model. This model is equivalent to a simple strain-hardening model, such as used by Gancarz et al., 31 since dividing strain by strain rate can be substituted for time under tensile test conditions (constant strain rate).
This study focuses on the relationship between flow stress, strain, strain rate, and time at elevated temperatures for AH36 material in addition to aiming to understand the constitutive equation using experimental measurements. Therefore, high-temperature tensile testing with solidified-type thermal histories was executed in a wide range of strain rates (10−4−10−2 s−1) and temperatures (1173–1673 K). An improved constitutive equation was also suggested by introducing strain rate compensation into the time-hardening model to describe the hot deformation of AH36 material, while the validity of this model was examined using experimental data over the entire range of experiments.
Materials and methods
The AH36 material as the experimental sample was used for hot tensile testing in this study. The chemical compositions of the AH36 material are listed as follows: C: 0.157%, Si: 0.2489%, Mn: 1.1132%, P: 0.0162%, S: 0.0044%, Als: 0.0289%, Cr: 0.0375%, Ni: 0.0177%, Cu: 0.0284% (wt%), and a balance of Fe. The production of the specimen from the slab is shown in Figure 1, and the longitudinal direction of the specimen is normal in both the casting direction and the columnar dendrite growth direction. As seen in Figure 2, all standard cylindrical specimens of 10 mm in diameter and 120 mm in height are machined from a continuous casting slab, with screws at both ends. The center of the specimen was installed with a quartz glass tube with a length of 30 mm and inner diameter of 10.4 mm to support the melting zone of about 10 mm in length and prevent heat loss at the uniform temperature area. An R-type (Pt−Pt13%Rh) thermocouple was used to control the temperature at the mid-span surface of the specimen during testing. The quasi-isothermal tensile tests were conducted using a Gleeble-3500 materials simulator at temperatures of 1173–1673 K at an interval of 100 K with constant strain rates of 10−4, 10−3, and 10−2 s−1. The hot tensile tests were conducted under a vacuum to block oxidation of the specimen and reduce a radial thermal gradient. As seen in Figure 3, 32 all the specimens were rapidly heated to 1673 K with a heating rate of 10 K/s, which was maintained for 60 s to make it fully austenitized. Following this, the specimens were reheated to the melting temperature with a slower heating rate of 1 K/s. After being held for 60 s for melting, the specimens were cooled down to different testing temperatures with a cooling rate of 5 K/s. Finally, tensile tests were carried out with the defined strain rate at the testing temperature. The specimens were finally cooled down by the natural cooling.

Schematic diagram for the production of the specimen from the slab.

Schematic diagram of the specimen in combination with the quartz tube.
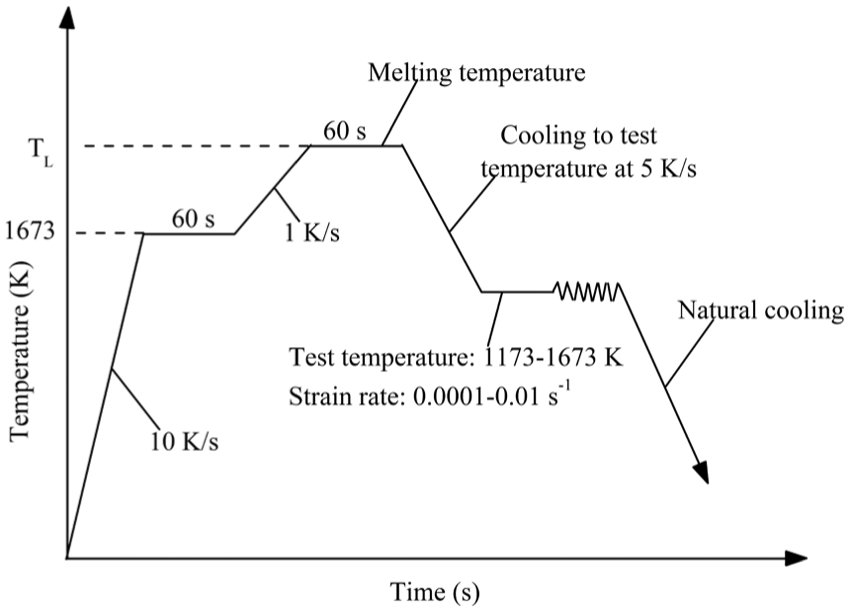
Schematic of the thermal histories for tensile tests.
Results and discussion
The experimental flow curves of the AH36 material obtained at different temperatures and strain rates are shown in Figure 4. The variation in flow stress during the deformation process is similar to the most metals researched previously. The influence of temperature and strain rate on the flow stress is evident as the flow stress decreases with an increase in the temperature and a decrease in the strain rate. The flow curves exhibit a work-hardening region followed by a steady state or slight work-hardening, which continues until the maximum strain of 0.04 is reached. Furthermore, particularly for the test at the strain rate of 10−2 s−1, the flow stress with a strain level of 0.04 was reduced from 61.2 to 11.3 MPa when the temperature was increased from 1173 to 1673 K. It is evident that the flow stress is reduced by 49.9 MPa (a decrease of 81.54%). Furthermore, the flow stress is also decreased 46.0 and 39.2 MPa, respectively, when the strain rates are maintained at 10−3 and 10−4 s−1. That has caused a decrease of 86.33% and 90.39%, respectively, at the strain rates of 10−3 and 10−4 s−1. Thus, the total variation in flow stress is significant over the entire range of temperatures under different strain rates.

Flow curves of AH36 steel at various temperatures at strain rates of (a) 10−2 s−1, (b) 10−3 s−1, and (c) 10−4 s−1.
Constitutive equation for flow stress prediction
The relationship between flow stress, temperature, strain rate, and time at elevated temperatures could be depicted by a time-hardening model. Furthermore, the influence of temperature and strain rate on deformation behavior could be expressed by the Zener–Holloman parameter (Z) in an exponential-type equation. The formulations of the two models are mathematically expressed as follows


where
Equation (2) can be presented with the

Determination of the material constants
Experimental results from the tensile testing at various deformation conditions were used to determine the material constants of the constitutive equation. The evaluation procedure of material constants at a temperature of 1173 K, taken as an example, is described as follows.
The logarithm of both sides of equation (3) was taken. Following this, equation (4) can be obtained as follows

For a particular temperature, equations (5) and (6) can be written by taking into account equation (4) as follows
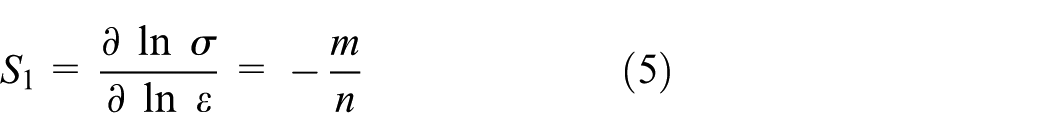

After this, n and m can be, respectively, represented as a function of S1 and S2 as follows


The values of S1 and S2 can be obtained with equations (5) and (6) by plotting (ln σ − ln ε) and (

Evaluating the values of (a) S1 by plotting (ln σ − ln ε) and (b) S2 by plotting (
For a particular strain rate, the activation energy Q can be represented in equation (9) by calculating the partial differential of equation (4) as follows
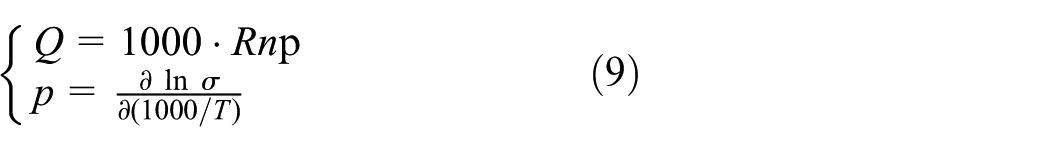
Thus, the activation energy Q can be derived from the slopes in a plot of (ln σ − 1000/T). As seen in Figure 6, the value of Q was calculated by averaging the values of the Q under different strains as an example. The value of Q was found to be 198,122 J mol−1 at the strain rate of 10−4 s−1. The values of Q could be obtained at the strain rates of 10−3 and 10−2 s−1 under different strains in the same way.

Evaluating the value of Q by plotting ln σ versus 1000/T at a strain rate of 10−4 s−1 under different strains.
Following this, the value of material constant ln A can be evaluated from the intercept of (ln σ − ln ε) plot under different strain rates at the temperature of 1173 K.
The values of n, m, and ln A could be obtained at the temperatures of 1273–1673 K in the range of strain rates 10−4−10−2 s−1 in the same way. The dependency of material constants on temperature and/or strain rate could be derived by assuming that the values of α, n, Q, and ln A are polynomial function of deformation conditions due to the significant influence of deformation conditions on them. With the values of the material constants determined at various deformation conditions, those values were then applied to fit the polynomial. As seen in Figure 7, the polynomial equations (10) were found to express the effect of temperature on material constants with a good correlation and generalization.


Variation in (a) n, (b) m, (c) Q, and (d) ln A with the temperature and/or strain rate.
Once the material constants are defined, the flow stress at a particular deformation condition could be computed. The constitutive relationship between flow stress and the parameter Z could be described as the following form considering equations (1) and (3)

Verification of the developed constitutive equation
The developed constitutive equation (taking into account the time-hardening) was verified with a comparison between the experimental and predicted data. The predictability of the constitutive equation under various deformation conditions is shown in Figure 8. A good prediction is evident at the temperatures of 1273–1473 K over the entire range of strain rates. Furthermore, there is consistency between experimental and predicted flow stress at the strain rate of 10−3 s−1 with the temperatures of 1173, 1573, and 1673 K. However, the accuracy of the model is relatively low at the temperatures of 1173, 1573, and 1673 K under the strain rates of 10−2 and 10−4 s−1. The calculated values of average absolute relative error (AARE) at the strain rate of 10−2 and 10−4 s−1 are 21.55% and 16.48%, respectively, under the temperatures of 1173, 1573, and 1673 K. The deviation of the predicted values manifested. These trends make us expect the need for a modification of the developed constitutive equation, with a compensation of strain rate required to enhance its predictability at the strain rates of 10−2 and 10−4 s−1.

Comparison of experimental and predicted flow stress–strain plots at various temperatures at the strain rate of (a) 10−4 s−1, (b) 10−3 s−1, and (c) 10−2 s−1.
Modification of the developed constitutive equation
The modification of the developed constitutive equation was implemented by compensation of strain rate in the Zener–Holloman parameter (Z). This could be carried out by modifying the exponent of the strain rate in the Z parameter. Similar work was conducted by Lin et al. 23 and Mandal et al. 24 to compensate the strain rate in the 42CrMo steel and a Ti-modified steel, respectively. As shown in equation (1), it could be observed that the exponent of strain rate is 1 in the original parameter of Z. Some different values of strain rate exponent were experimented to find the most suitable form of modified Z. The appropriate values of strain rate exponent, represented by l, are shown in Table 1 at different ranges of temperature to compensate for the strain rate.
The appropriate values of strain rate exponent at different ranges of temperature.

The appropriate values of strain rate exponent obtained at different ranges of temperature were then applied to derive the relationship between the strain rate exponent and strain rate. As seen in Figure 9, all formulations show a good correlation and generalization, as shown in equation (12)

where l is the strain rate exponent in the parameter of Z.

Variation in l with the strain rate at (a) 1173 K and (b) 1573–1673 K.
Based on the expressions of strain rate exponent at different ranges of temperature, the deformation process was distributed into the regions of 1173, 1273–1473, and 1573–1673 K. As seen in equation (13), the constitutive equations at different domains of temperatures have been constituted

where all the material constants can be calculated from equations (10) and (12).
Verification of the modified constitutive equation
The applicability of the modified constitutive equation was evaluated by comparing the experimental and predicted data. As shown in Figure 10, it could be observed that strong consistency was obtained for estimating the flow stress throughout the entire temperature range at various strains. In particular, for the test under both strain rates of 10−2 and 10−4 s−1, the value of the AARE was reduced from 16.00% to 3.38% (a decrease of 78.88%) at the temperature of 1173 K compared with the original constitutive equation. This decrease in the AARE by the modified constitutive equation is significant. There is also an evident decrease in the AARE at the temperatures of 1573 and 1673 K under both strain rates of 10−2 and 10−4 s−1 confronted with the original constitutive equation. The values of the error decreased by 85.93% and 92.91%, respectively. Thus, the accuracy of the modified constitutive equation has been greatly improved.

Comparison between the experimental and predicted flow stress from the modified constitutive equation at strain rates of (a) 10−4 s−1, (b) 10−3 s−1, and (c) 10−2 s−1.
Furthermore, the calculated values of AAREs by the modified model are 2.91%, 3.85%, and 4.89% at the strain rates of 10−2, 10−3, and 10−4 s−1, respectively. All the values of the errors are within the range of allowable experimental conditions.
The predictability of the modified constitutive equation has also been validated with the statistical analysis of the correlation coefficient (R) and AARE. These formulae are expressed as in equations (14) and (15)


where E is the experimental data and P is the predicted value calculated by the modified constitutive equation;
The correlation between the experimental and predicted flow stress data from the modified constitutive equation is shown in Figure 11. It was observed that most of the data points lie close to the best regression line with the correlation coefficient for the modified model being 0.998. The best correlation between the experimental and predicted flow stress data reached significant value and the determined value of the AARE is 4.14%, which suggests a good predictability of the modified constitutive equation.

Correlation between the experimental and predicted flow stress data from the modified constitutive equation.
Conclusion
The constitutive equation of AH36 material was derived by performing high-temperature tensile tests in the temperature range of 1173–1673 K and strain rate range of 10−4−10−2 s−1. The conclusions were obtained as follows:
The influence of temperature and strain rate on the flow stress is evident as the flow stress decreases with an increase in the temperature and a decrease in the strain rate. The total variation in flow stress is significant over the entire range of temperatures under different strain rates.
Although the time-hardening model could be used to express the constitutive behaviors of AH36 material at various strain rates and temperatures, the accuracy of the model is relatively low at the temperatures of 1173, 1573, and 1673 K under the strain rates of 10−2 and 10−4 s−1. The calculated values of average absolute relative error at the strain rate of 10−2 and 10−4 s−1are 21.55% and 16.48%, respectively, under the temperatures of 1173, 1573, and 1673 K. The deviation of the predicted values was shown.
Due to the low accuracy of the time-hardening model at the temperatures of 1173, 1573, and 1673 K under the strain rates of 10−2 and 10−4 s−1, a compensation of the strain rate was introduced into the equation to describe the hot deformation behaviors of AH36 material more accurately. The value of the average absolute relative error was reduced by 78.88%, 85.93% and 92.91%, respectively, compared with the original constitutive equation at the temperatures of 1173, 1573, and 1673 K under both strain rates of 10−2 and 10−4 s−1. The calculated value of average absolute relative error was found to be 4.14%, while the coefficient for the modified constitutive equation is 0.998.
Footnotes
Handling Editor: Michal Kuciej
Declaration of conflicting interests
The author(s) declared no potential conflicts of interest with respect to the research, authorship, and/or publication of this article.
Funding
The author(s) disclosed receipt of the following financial support for the research, authorship, and/or publication of this article: The financial support to this study from National Natural Science Foundation of China (no. 51375041) is gratefully acknowledged.