
Abstract
To analyze the correlation between adjacent intersections and implement coordinated signal control on arterial roads is a burning issue. The vehicle detector is indispensable by which the traffic state data are collected directly to get a reasonable control strategy. The traditional methods have poor control performance because of lacking enough accuracy. In this article, the new layout method of vehicle detector is proposed to collect and store high-resolution traffic data continuously, which can identify a critical turning point of the change in traffic state. Thus, a correlation degree model to quantitative relevance between adjacent intersections on arterial road based on traffic status data is established. This model could make more exact measurement in order to achieve the control subunit partition of arterial roads, selecting density-based spatial clustering of applications with noise algorithm to cluster the deriving correlation indexes. The partition method is evaluated by an arterial road including 12 intersections, and this road is divided into five subunits. The simulation result validates that the partition method based on correlation indexes can significantly improve the operation efficiency of arterial roads and reduce the traffic delay. This research may provide a new strategy on the partition of control unit for arterial road more accurately based on high-resolution traffic data.
Keywords
Introduction
The coordinated signal control for urban arterial roads in traffic control system is important as the arterial roads undertake the main traffic load of the whole city. For an arterial road including a number of intersections to be coordinated control, it should be divided into several relatively independent linear control units in accordance with certain rules. Within a control unit, the signal timing parameters for different intersections are designed so as to promote traffic operation efficiency and to reduce number of stops.1–4 It will attach importance to the development of intelligent transportation system (ITS).5–8
The objective of unit partition for arterial road is to distinguish whether control performance can be improved when implementing coordination signal control on intersections within one linear control unit. It is necessary to analyze the correlation between adjacent intersections to determine whether they are suitable for the same linear control unit. Therefore, it is essential to find a method for control unit partition, which could compare the control performances between coordinated control strategy and isolated control strategy. However, this method would be time-consuming to evaluate the performance continuously. An effective method is thus proposed with respect to an index reflecting the relevance of adjacent intersections directly, which is called correlation degree between adjacent intersections in this article. Accordingly, as the correlation degree is related to real-time traffic condition, the model is developed based on high-resolution data collected by detector. Through the classification of the correlation degree indexes, the intersections on arterial road are divided into different control units to be coordinated control.
However, from the literature, it is observed that little has been done on the correlation analysis and partition for arterial intersections, even though it is significant in reality. The existing partition method for control unit was mainly based on the “cycle principle,”“flow principle,”“distance principle,” and “saturation principle,” lacking of a comprehensive analysis to the contributing factors of relationship between adjacent intersections.9,10 Zou et al. 11 in his article considered that the factors affecting the relevance of adjacent intersections are the link length, the traffic volume of upstream intersection, and the rule of its arrival. Yagoda et al. 12 defined a coupling index (I) as I = V/L, in which the coupling degree of intersections was related to link length (L) between adjacent intersections and traffic volume (V) on the link. Greater index indicates that the two intersections are more requisite to be the same category. Even though the model is theoretically feasible, it still has the disadvantage of not presenting the dynamic characters in traffic pattern between adjacent intersections. Taking into account the elements affecting the performance of subarea partition possibly, the critical congestion length, the congestion index of intersection, as well as continuation degree of traffic movement are chosen, and in order to make a quantitative analysis of these factors, the formulations were established. 13 Nevertheless, the study did not estimate the relationship between control effect and the influencing factors. Bie and colleagues14,15 selected cycle length and queue length as contributing factors. A quantitative approach with a correlation model was developed to analyze the relevance index between adjacent intersections. However, the model lacks theoretical basis on the confirmation of weight coefficients, and threshold values were also dependent on experience. Ma et al. 16 proposed a calculation model for signalized intersections based on the path and took an example test. The limitation of this method is to pay attention to the influence of static factors, neglecting the influence of traffic real-time parameters such as queuing length on the relevance analysis. Tian and Urbanik 17 offered a heuristic approach dividing a signalized arterial road into three to five subunits. Every subunit is implemented isolated signal control and within each unit intersections were optimized to achieve the maximum green bandwidth. Mirchandani and Head 18 set up a real-time distributed hierarchical optimized system (RHODES), which was displayed to make it realize that nine intersections could be divided into the same control subsystem reasonably without generating extra enormous computation. Wang proposed a conception of partitioned artery to maximize the green wave bandwidth between intersections on an arterial road. The relationship between common cycle and delay is described by setting constraint conditions so as to achieve its goal. 19 To improve the safety performance of highway access points, a new method of access weight calculation is formulated to make constraints about the vehicle’s lateral offset and speed.20,21 It is not suitable for the arterial roads because usually the linear control unit contains less than five intersections to be coordinated control. However, the experiments displayed in above researches did not have the high-resolution data applied, and most of them were shortage of the detector to collect the real-time data so that the results of study had no enough accuracy and the credibility dropped.
With regard to real-time traffic control systems, a proper correlation degree index should reflect dynamic characteristics of traffic flow and the strong relevance between adjacent intersections. This study mainly puts forward a new layout of detectors between adjacent intersections and then provides a method that is able to evaluate a correlation degree model between adjacent intersections in such a way as to make use of clustering analysis for index values to achieve the control unit partition of arterial road. Five influencing factors are considered in the proposed correlation degree model.
Modeling correlation degree of adjacent intersections
Layout of adjacent intersections
The correlation data between adjacent intersections based on the traffic condition of coordinated phase on arterial road are collected by the detector, which we called “high-resolution data.” This concept originates from the data collected by University of Minnesota SMART-SIGNAL system, 22 which integrates data collection, data storage, and data analysis. It can collect and store high-resolution traffic state data and vehicle status data continuously, thus it can also identify a critical turning point in the change of traffic state, including the detection of each vehicle driving and the change in the phase of each signal cycle. Each data contain a timestamp, current signal status, vehicle identification of the driving status, and the duration of the current state. The valid data obtained are like “08: 09: 15.481, D8 off, 0.468s” and “08: 09: 16.761, G3 off, 29.389s,” where the first field represents a vehicle driving event or the change of signal state. The second field represents the vehicle or signal status detected by the current detector, such as “D8 off” indicates that the vehicle leaves detector 8 and “G3 off” indicates that the green time of phase 3 finishes; the third field indicates the time taken by the vehicle to occupy the detector or the duration of the signal phase.
The collection of high-resolution data depends on the detector mounted on the lane, with the following rules for the installation of the detectors. Detectors are group-mounted with at least one set of detectors per phase, each consisting of two detectors numbered i, p, and q representing the phase number i, the group number p, and the detector number q (where q = 1 or 2). If more than one lane is in the same phase, the largest flow to install a group of detectors is selected. If a phase contains traffic of more than one direction, a set of detectors must be installed in each direction.
The specific layout of detectors between adjacent intersections is shown in Figure 1. There are two detectors in each group, one is the stop line detector (q = 1), which is located before the stop line, one is the section detector (q = 2), which is located at the two-third position of road section, generally recommended to be installed at someplace which has 120–150 m from the entrance to the parking line. When the length of the link is less than 120 ms, the distance far away from the entrance is given priority to avoid the occupancy rate data being abnormal because of very long vehicle queue. For example, the road detector 222 can estimate the demand of the vehicle arrival; the stop line detector 221 can estimate the vehicle queue length.

Layout of detectors between adjacent intersections.
Analysis of influencing factors on the correlation degree
Link length between two adjacent intersections
For arterial coordinated control, the link length between adjacent intersections is a key factor to determine the relevance of two adjacent intersections. On one hand, the link length determines whether the vehicles maintain good continuity departing from upstream intersection to the downstream intersection, thus affecting the coordinated control effect and reflecting the relevance of the intersections. On the other hand, the link length also determines the maximum traffic volume in the related link and whether the queuing vehicles on downstream section will affect the vehicle admission from the upstream intersection.
Link flow between upstream and downstream coordinated phases
Link flow between coordinated phases directly determines the degree of the traffic congestion on the related road, which mainly affects the correlation of adjacent intersections in real time. The link flow on the related road determines whether the link has more space left to accommodate the traffic, thus affecting the dispersion of vehicle queue and reflecting the relevance of the adjacent intersections.
Signal timing between two adjacent intersections
The influence of signal timing on the correlation of adjacent intersections is mainly focused on the cycle length, the offset, and the split. Intersections in a control unit generally share the same cycle length which is decided by the intersection having the maximum traffic load. When the cycle ratio is integer, instead of queuing up, vehicles often pass through the signalized intersection, which shows the strong correlation of adjacent intersections. When the difference is large enough, the traffic will be blocked, which shows the weak correlation.
The difference of the split between two adjacent intersections is also an important factor to affect the correlation degree, causing the accumulation and dissipation of the traffic in a period of time. For example, when the difference in the split is positive that the green time of upstream intersection is greater than the downstream intersections, traffic on related link will be gradually accumulated, leading to the stronger correlation; otherwise, the correlation between adjacent intersections will be crippled.
The offset of coordinated phases will resolve the maximum traffic volume that may exist in a signal cycle, and it will also affect the correlation of two adjacent intersections. But different from the split, the offset has no accumulation effect on the correlation of two adjacent intersections, but only works in the current signal cycle. The offset can be determined directly by analyzing the travel time without stop on related link.
Other factors
Queue length, link speed, and link delay reflect the real-time traffic state of the related link between the adjacent intersections. When the queue length is very long to spread up to the upstream intersection, the two adjacent intersections have strong correlation and the coordinated control is considered to relieve congestion. Besides, with the cumulative queue length, the link delay is increased and the link speed is reduced, which affects the traffic capacity of the arterial road. Therefore, considering the three real-time traffic indexes generally, the correlation between two adjacent intersections can be effectively estimated.
Performance index
The correlation degree of adjacent intersections on the arterial road is a quantitative parameter to describe the relation between two adjacent intersections, which completely reflects the objective impact on correlation by the actual traffic conditions and the independent design of signal timing parameters. In this article, the correlation degree is composed of the path flow correlation degree, the signal timing correlation degree, travel time correlation degree, queue length correlation degree, and link delay correlation degree.
In the assumption of the one-way coordinated direction between adjacent intersections i and j (IN.i and IN.j) on arterial road, the performance indexes of five correlation degree are formulated as the following.
The link flow correlation degree
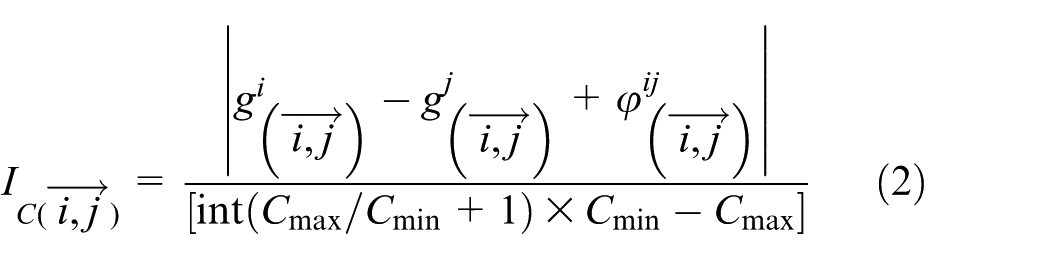
Larger link flow may cause more traffic travel between the upstream and downstream coordinated phases. If running signal coordinated mode between adjacent intersections, the traffic condition would be improved. Thus, the correlation degree is directly proportional to the link flow. The link flow correlation degree in the current cycle can be obtained by equation (1)

where
The signal timing correlation degree
The calculation of signal timing correlation degree should not only refer to the definition of cycle correlation degree but also need to consider the offset and split between the two adjacent intersections. Thus, the modified correlation degree can be defined as follows
where the maximum and minimum cycle length of IN.i and IN.j are denoted as
Travel time correlation degree
The calculation of this index refers to the definition of travel time coordination coefficient in the software Synchro. 23 When the travel time between adjacent intersections is larger than 80 s, the travel time coordination coefficient is 0 as the distance is too far away to be coordinated control. When the travel time between adjacent intersections is less than 4 s, the travel time coordination coefficient is 100 as the distance is close to generate spillover. The correlation degree in other conditions can be defined as follows

where
Queue length correlation degree
Long queue length may cause the congestion as the spillover spreads to the upstream intersection, which affects the moving traffic. Thus, the correlation is as follows
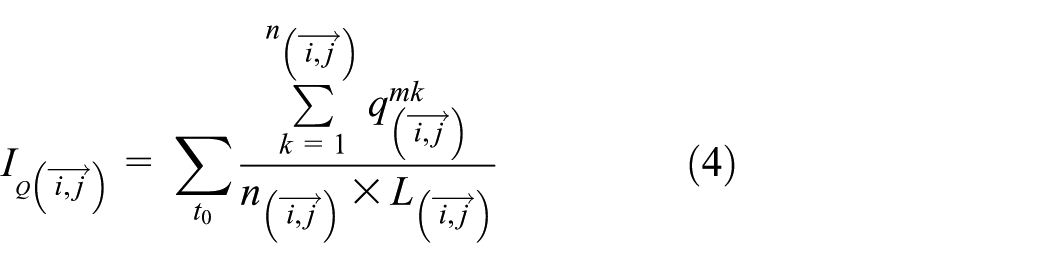
where the maximum queue length of kth lane from the direction IN.i to IN.j on related link is denoted as
Link delay correlation degree
The total link delay during the time

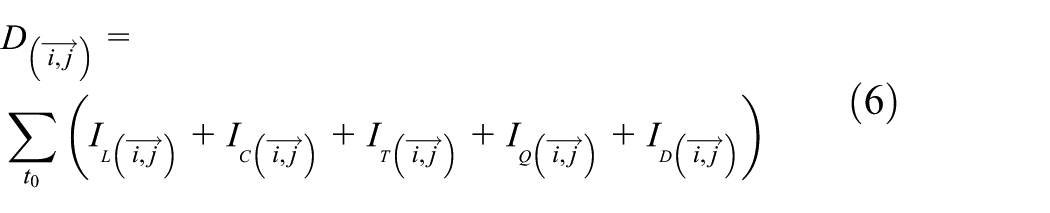
Definition of correlation degree
The correlation degree of adjacent intersections on the arterial road from direction IN.i to IN.j is calculated by formulas (1)–(6)
Similarly, the correlation degree of the other coordinated direction from IN.j to IN.i is denoted as

By the above analogy, all the correlation values of adjacent intersections IN.i and IN.j in the whole simulation time are derived and averaged to get the final correlation degree of adjacent intersections IN.i and IN.j.
Linear control unit partition of the arterial road
Partition method of linear control unit
The partition of linear control unit on the arterial road is to study what the intersections of the control area belong to in theory. This article aims to establish an integrated correlation index to quantitatively analyze the degree of adjacent intersections. Besides, based on the correlation indexes, this article applies the appropriate clustering algorithm to scientifically and rationally determine the classification of different intersections on the arterial road, which improves the accuracy of partition for the coordinated linear control unit.
In this article, density-based spatial clustering of applications with noise (DBSCAN) clustering algorithm based on density is used to classify the scatters of final correlation degree of adjacent intersections so as to achieve the division of intersections on the arterial road which can be coordinated and controlled. Assuming the number of intersections on the arterial road is N, the number of correlation scatters for all adjacent intersections is N − 1. The key problems of the DBSCAN algorithm are as follows:
Determine one of the input parameters—the radius Eps: DBSCAN clustering method uses a concept of k-distance.24–26 Based on the principle of the calculation, the value of Eps is derived.
Determine another input parameter—minPts: Empirically calculate the minimum number of points to determine the size of minPts, namely, the value of k in the k-distance. In this article, minPts is 2.
DBSCAN clustering algorithm traversed the correlation scatters of all adjacent intersections to form many clusters, if the data set has some point not belonging to any cluster, then it is considered a noise. For the clustering result and the point determined as noise point, the following principles of partition are proposed in this section.
Principle 1
The noise point occurs at two ends, that is, the degree of adjacent intersections between IN.1 and IN.2 or IN.N-1 and IN.N. If the value is significantly bigger than the others, then the two adjacent intersections are divided into a separate control unit. If this value is significantly smaller than the others, then the intersection at the endpoint (IN.1 and IN.N) is implemented single-signal control.
Principle 2
The noise point is not at two ends, corresponding to IN.i and IN.j (i < j) in the middle of the arterial road and comparing the degree of the two intersections with their adjacent intersections on the other side. The intersections having bigger correlation degree are classified into one category, but IN.i and IN.j cannot fall into the same category to be coordinated control.
Principle 3
The intersections are divided into the same cluster, which cannot be coordinated control in reality, and then, the real traffic situation to get control units for coordinated control is considered. The intersection located at the edge region of cluster should be coordinated with which has the bigger correlation degree. If there is a single intersection left, it should be implemented single-signal control.
Simulation and results
In order to validate the practicability and the rationality of the proposed approach on partition of arterial intersections in this article, the Q-Paramics software is used to build the road network model of Wangjiang West Arterial Road. The simulation test is implemented on the basis of real-time traffic data collected by detector. Through the analysis of the experimental data, the control effect of the partition for arterial intersections is evaluated. Compared with the original fixed timing control strategy, the degree of improvement in traffic conditions is analyzed.27–30
Road network modeling
This article selects Wangjiang arterial road in Hefei as the case to study. There are 12 signalized intersections in this road, as shown in Figure 2, such as intersection of Innovation Road and Wangjiang Road (intersection 1), intersection of Wenqu Road and Wangjiang Road (intersection 2), intersection of Yonghe Road and Wangjiang Road (intersection 3), intersection of Yanglin Road and Wangjiang Road (intersection 4), intersection of Fenglin Road and Wangjiang Road (intersection 5), intersection of Yulan South Road and Wangjiang Road (intersection 6), intersection of Yulan North Road and Wangjiang Road (intersection 7), intersection of Jingui Road and Wangjiang Road (intersection 8), intersection of Xiangzhang Road and Wangjiang Road (intersection 9), intersection of Kexue Road and Wangjiang Road (intersection 10), intersection of Tianzhi Road and Wangjiang Road (intersection 11), and intersection of West Second Ring Road and Wangjiang Road (intersection 12).
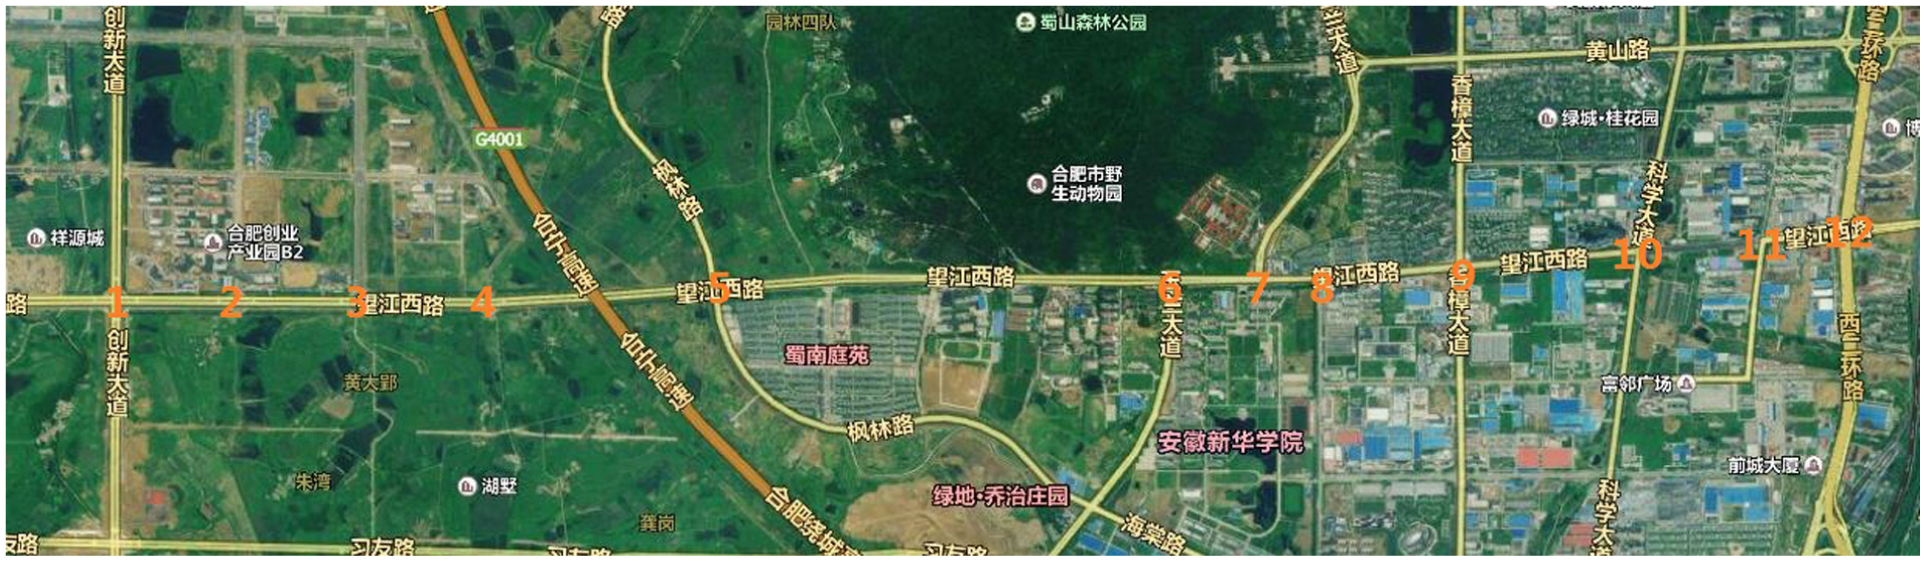
Wangjiang arterial road.
The whole arterial road is about 7.33 km, whose length varies from 387 m to 1906 m, and the traffic flow is large enough, leading to the traffic simulation scenarios complete and practicable. The road model made through microscopic traffic simulation software Q-Paramics is shown in Figure 3. And the traffic demand of this simulation environment is shown in Figure 4, according to the actual and predicted traffic volume of the simulation area. The traffic zones are constructed around the simulated area not only related to the arterial road. However, the parameters in the model of section “Simulation and results” are collected by the detector on arterial road.

The model of arterial road in simulation.
Traffic demand matrix of simulation area.
Results of linear control unit partition
The entire process of linear control unit partition method is illustrated in Figure 5. In this section, the correlation degree indexes of arterial adjacent intersections are inputted and the clustering results based on DBSCAN algorithm are obtained.

The process of partition method.
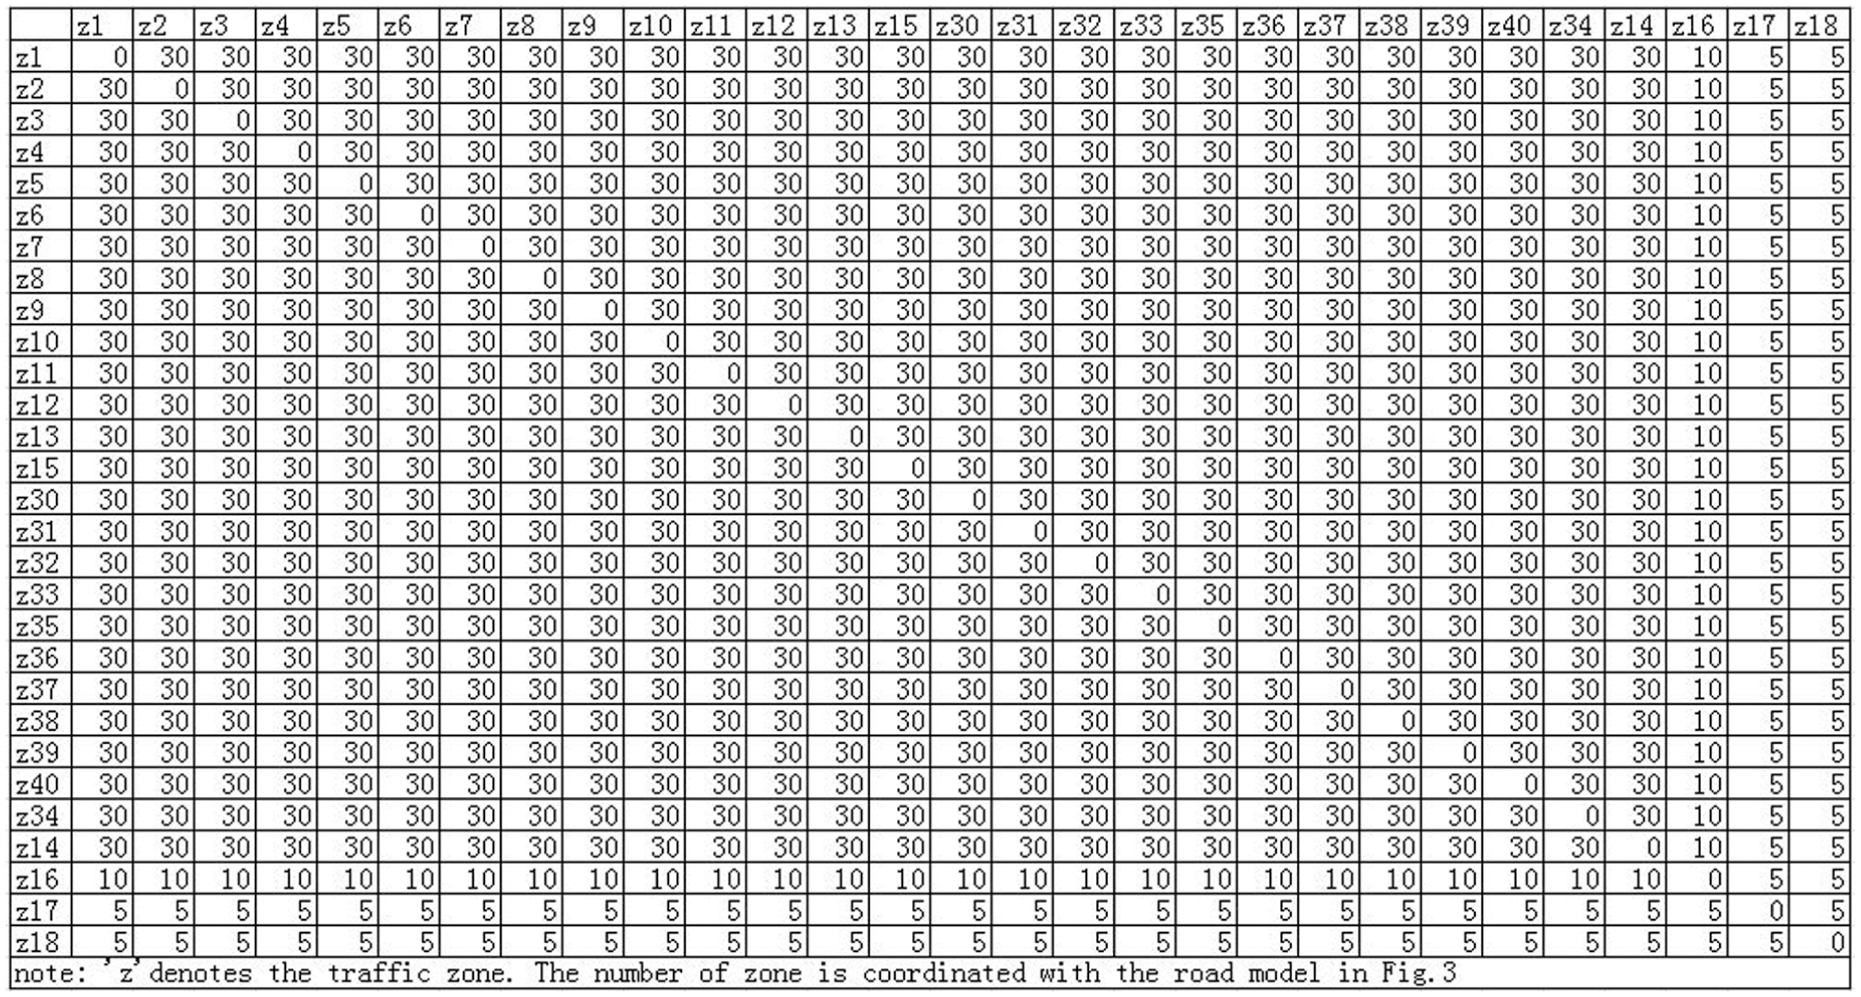
Set the simulation time for 1 h, and the correlation degree of adjacent intersections i and j is shown in Table 1. The parameter minPts takes 2 in DBSCAN clustering algorithm; namely, the k takes 2, so according to the calculation method, the value of Eps in DBSCAN algorithm is decided by k-distance curve. Define the set
Correlation degree of adjacent intersections (i, j).


k-distance curve of all data (k = 2).
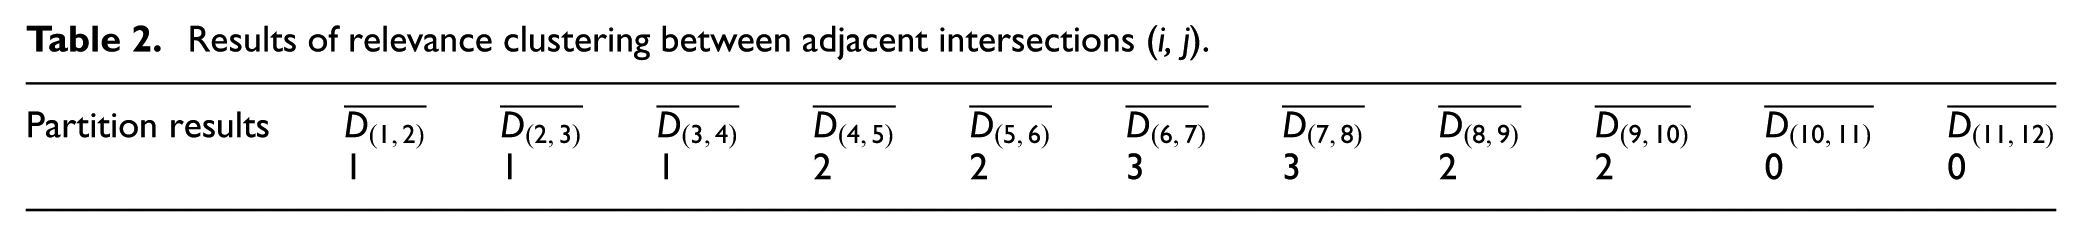
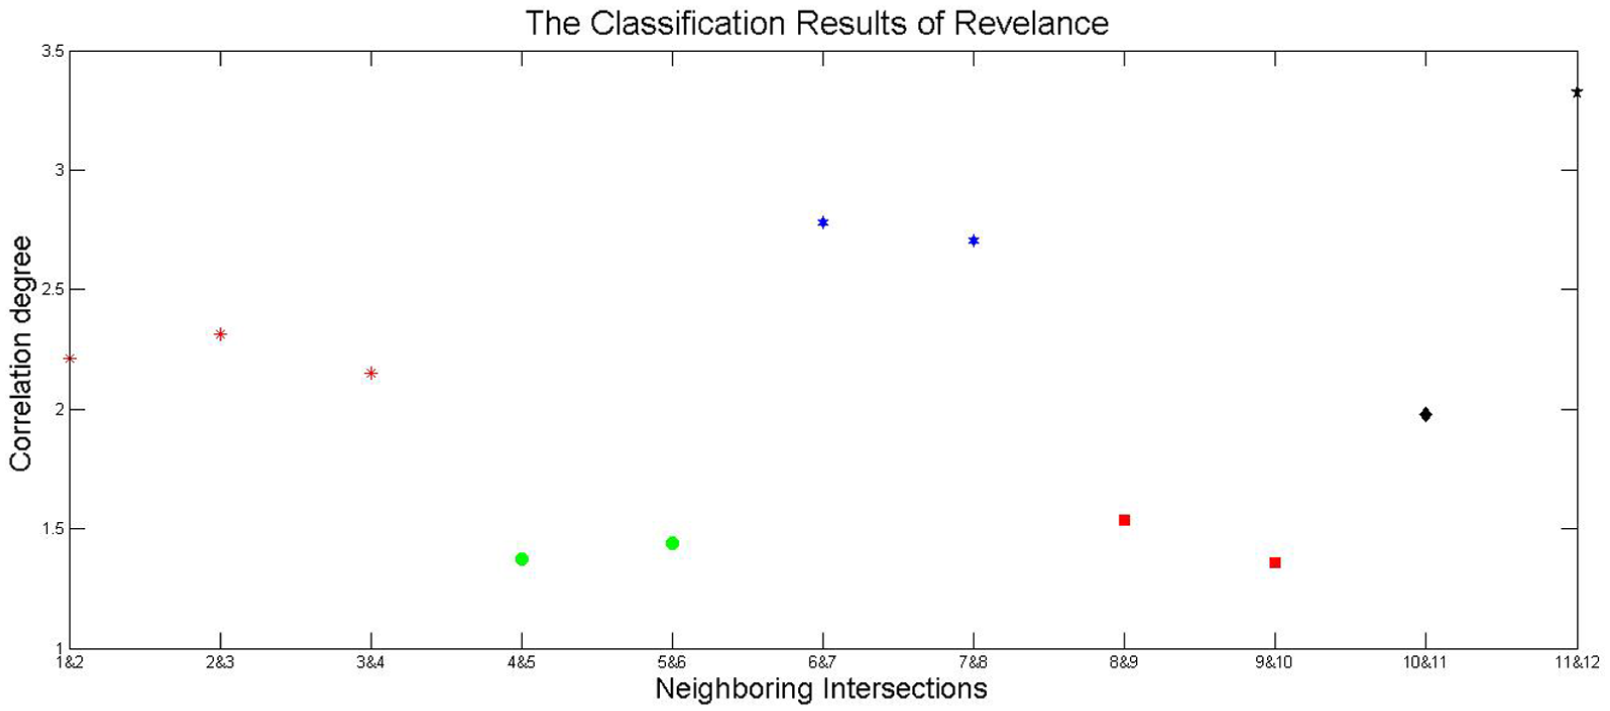
The results based on DBSCAN clustering method are shown in Table 2 for the adjacent intersections on arterial road. Combined with the actual traffic situation, the intersections which are divided into Category 2 are not adjacent, so they are divided into two linear control units for coordinated control based on the adjacent property. According to the principle of classification and the principle of noise point treatment, the intersections 1/2/3/4 are divided into one unit for coordinated control, the intersection 5 is implemented with single-signal control, the intersections 6/7/8 are classified into one unit for coordinated control, intersections 9/10 are classified for coordinated control, and intersections 11/12 because of their strong correlation are classified for coordinated control. Finally, the results of the partition for arterial intersections based on the correlation degree indexes are shown in Figure 7.
Results of relevance clustering between adjacent intersections (i, j).
Classification results of coordinated control intersections on arterial road.
Analysis of simulation results
In the simulation, according to the partition result, every unit has been implemented coordinated signal control. The signal timing of intersections on arterial road is decided by the different control strategies. Then, set the timing parameters in the simulated arterial road and result in the analysis report. The traffic state indexes are extracted from the report, and thus, the contrast analysis can be achieved. Three different signal control strategies were used in the simulation to evaluate and contrast their control effects with Q-Paramics.
Fixed signal timing control. In this strategy, the signal timing of intersections on arterial road is the actual program. The signal timing parameters are shown in Table 3.
Maximum-cycle method. The intersections divided into one linear control unit are carried out coordinated control, and the common cycle takes the maximum signal cycle of intersections; meanwhile, adjusting the offset of intersections in the control unit, the vehicles are at the required speed to obtain as much as possible non-stop right of way. The signal timing parameters are shown in Table 4.
Webster best-cycle method. The Webster timing method to get an optimal common signal cycle of intersections in one linear control unit is used, and the offset to achieve green wave control is adjusted. The signal timing parameters are shown in Table 5.
Fixed signal timing of Wangjiang Road.
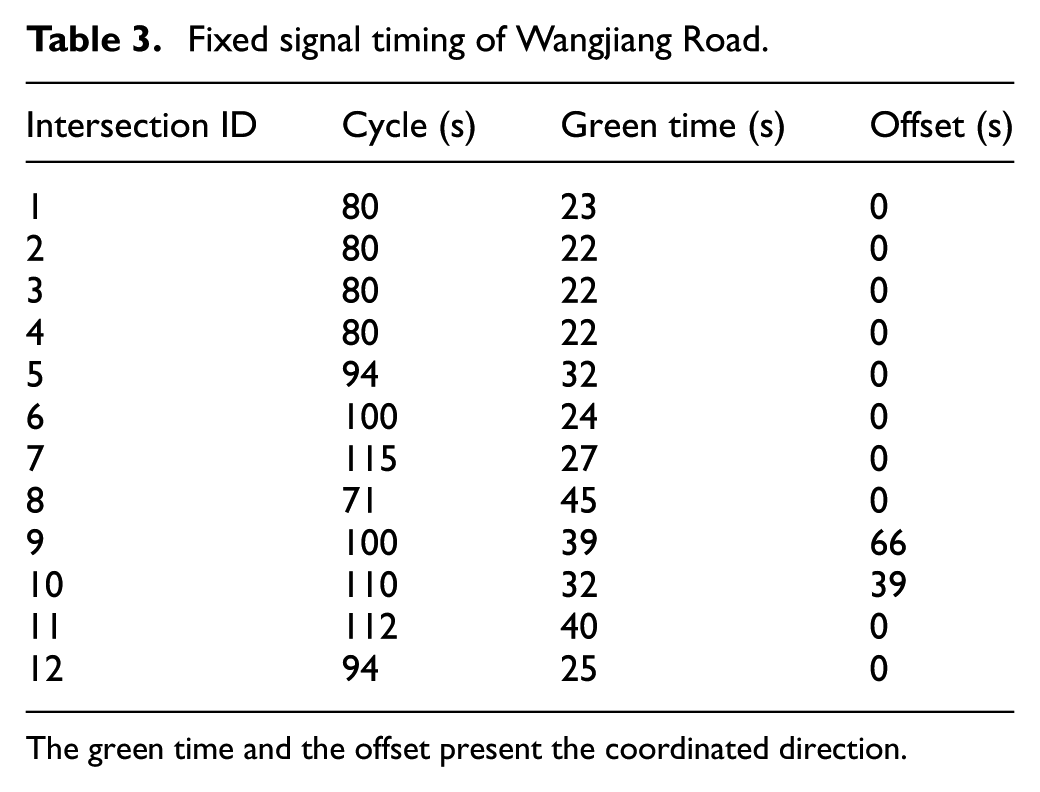
The green time and the offset present the coordinated direction.
Maximum-cycle signal timing of Wangjiang Road.

The green time and the offset present the coordinated direction.
Webster best-cycle signal timing of Wangjiang Road.
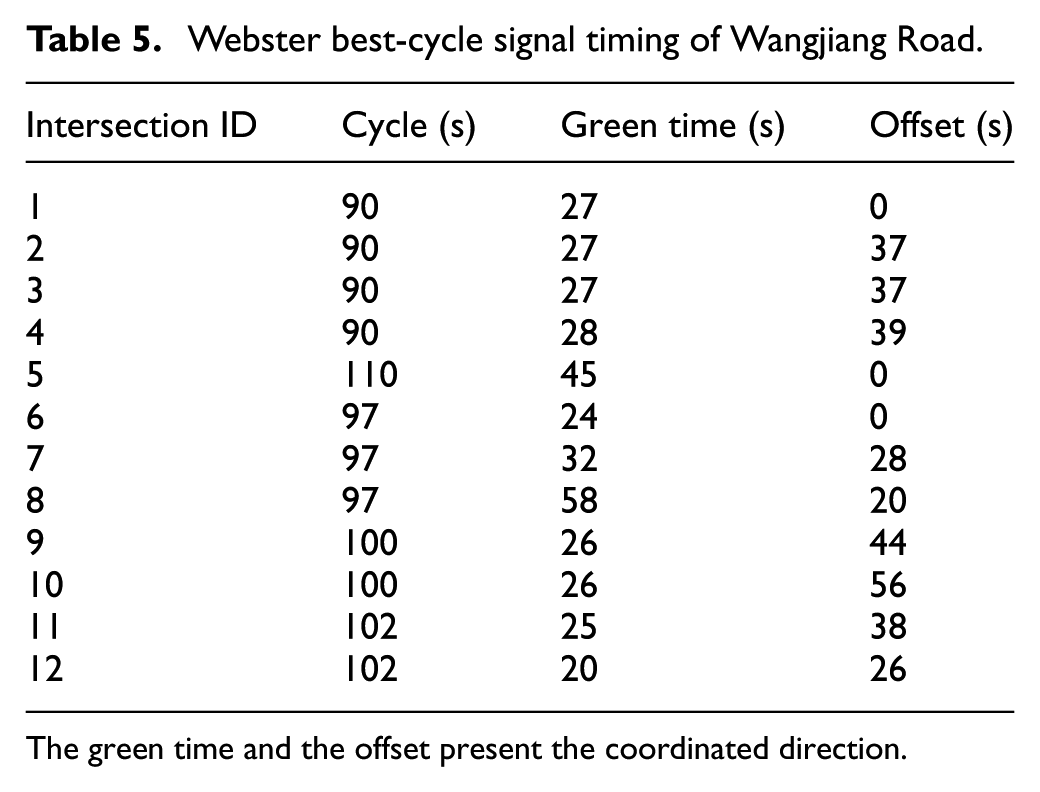
The green time and the offset present the coordinated direction.
In this article, arterial traffic volume, arterial total delay, and arterial travel time are taken as the evaluation indexes. Table 6 shows the simulation results of the three signal control methods at different intervals.
Contrast results of different control methods.

After comparing the results, the analysis diagram is observed. Figure 8 shows the total traffic volume of three different control strategies within 1 h. It can be seen that when the common cycle of each control unit is the maximum signal cycle, the traffic volume increases significantly by approximately 4.4% as compared with the fixed signal timing scheme. But compared with the Webster best-cycle method, the capacity of arterial road is almost the same. The arterial total delay during different periods of time in the simulation is shown in Figure 9. When the traffic flow is low, three control strategies are little different in the first half-hour arterial delay as growing near linearly. With the growth of traffic flow, the delay of Webster best-cycle method is less than the other two control strategies, owing to the Webster method is to seek the optimal signal cycle for the goal of minimizing the delay, so that the control effect on reducing the delay reaches the optimum condition. Figure 10 shows the comparison of the travel time of the main line. As can be seen from Figure 10, the arterial travel time of Webster best-cycle method and maximum-cycle method is smaller than the fixed signal timing control, providing that these two schemes have adopted the coordinated control, which may sacrifice the traffic capacity of the other directions in exchange for the non-stop priority of arterial road.

Contrast of arterial traffic volume 1 h.
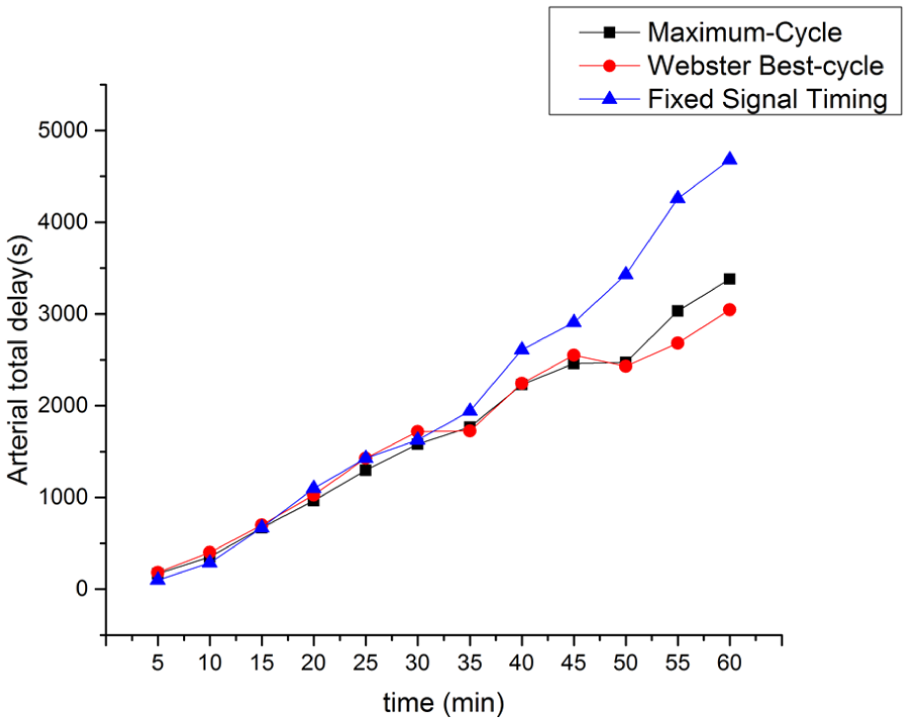
Contrast of arterial total delay.

Contrast of arterial travel time.
When the traffic volume is small, the advantage of green wave on arterial road is not obvious, and the travel time of three strategies has no big difference. With the traffic flow and traffic density increasing gradually, the maximum-cycle method realizes the release of vehicles as much as possible, so the control effect is slightly better than Webster best-cycle method.
Synthesize these three graphs; when the simulation time is advanced, the traffic volume on the arterial road increases gradually, so that the advantage of coordinated control strategies begins to appear. Compared with the fixed signal timing, the evaluation indexes of the other two control methods are growing slower. Figure 7 shows that once the traffic flow increases, the growth trend of travel time for fixed signal timing control is obvious; thus, the disadvantage of this method is further highlighted, and the gap of control effects between the fixed timing control and the other two control strategies is widening.
According to the above analysis, it can be seen that the fixed signal timing control plays its role well when the traffic flow is moderate and the signal control parameters are set appropriately. The control effect is equivalent to the other two methods. But when the traffic flow is large at intersection especially in the direction of arterial road, applying the coordinated control for each control unit, better control effect can be obtained. Therefore, the ideal control method is adopting the fixed signal timing control when the traffic volume is small and adopting the coordinated control for the divided linear control unit when the traffic volume is large. The above results clearly illustrate that the coordinated control for each divided linear control unit improves the capacity of the arterial road, reduces the link delay effectively, and shortens the arterial travel time. Thus, confirming the partition result is reasonable.
Conclusion
This article put forward a new layout method of vehicle detector by which the high-resolution data are collected and stored continuously, which can identify a critical turning point of the change in traffic state including the detection of each vehicle driving and the change in the phase of each signal cycle. Therefore, a correlation degree model to quantitative relevance between adjacent intersections on arterial road based on traffic status data was established. The model laid the foundation for the control subunit partition of arterial road. A simulation was presented to explain the method, and the results of classification showed that it was effective to improve the control performance for arterial road compared with the control strategy depending on traditional traffic low-resolution data by the detectors.
This article mainly provided research thoughts for analyzing correlation between adjacent intersections and its application based on traffic status data collected by vehicle detector. In the future, researchers could concentrate on the study of weight coefficients of the five correlation degree indexes between adjacent intersections. Simulations with different random seeds, as well as the calibration and validation endeavor, may be incorporated in order to reduce the randomness of simulation.
Footnotes
Handling Editor: Tao Feng
Declaration of conflicting interests
The author(s) declared no potential conflicts of interest with respect to the research, authorship, and/or publication of this article.
Funding
The author(s) disclosed receipt of the following financial support for the research, authorship, and/or publication of this article: This research was funded partially by the National Science and Technology Support Program of China under Grant No. 2014BAG03B02. The views are those of the authors alone. There is no conflict of interests regarding the publication of this article.