
Abstract
Vehicle group is the basic unit of microscopic traffic flow, and also a concept that often involved in the research of active vehicle security. It is of great significance to identify vehicle group situation accurately for the research of traffic flow theory and the intelligent vehicle driving system. Three-lane condition was taken as an example and the privacy protection of driver (only the data of travel time were used) was a premise in this article. Poisson’s distribution was used to identify vehicle group situation which was constituted by target vehicle and its neighboring vehicles when the target vehicle arrived at the end of study area. And the dynamic Bayesian network was used to build the reverse deduction model of vehicle group situation. The model was verified through actual and virtual driving experiments. Verification results showed that the model established in this article was reasonable and feasible.
Keywords
Introduction
Lots of previous studies have focused on the assessment and prediction of traffic situation. For example, D Meyer-Delius et al. 1 proposed a probabilistic approach to simulate and recognize traffic situation. The traffic situation was defined as a distribution over sequences of states that have some meaningful interpretation. The hidden Markov model was used to study the probability distribution and evolution law of traffic situation. M Fujita et al. 2 studied the assessment of road traffic situation in heavy rain through analyzing the data such as route and travel time of vehicle. Most of previous studies did not fully consider the behavior characteristics of driver under the complicated and changeable driving scene and lacked systematic research on vehicle group situation. On the basis of the error analysis of the algorithms based on average speed and average travel time, W Zhang et al. 3 promoted the urban traffic situation calculation methods based on probe vehicle data. The results proved that the method is quite effective and practical. X Wang et al. 4 analyzed the spatial distribution of the target vehicle and its neighboring vehicles, and the situation of vehicle group in the case of two-lane was divided and reduced, the reduced situation of vehicle group included eight states. The information of driving behavior, vehicle movement, and traffic environment was analyzed, and genetic simulated annealing algorithm was used to extract the feature vectors of driving propensity from different vehicle group situations. 5 And then the transition mechanism of driving propensity along with the evolution of the vehicle group situation under the two-lane condition was revealed. 6 On this basis, the situation of vehicle group in the case of three-lane was divided and reduced, 7 and the transition mechanism of vehicle group situation under dynamic and complex three-lane condition was studied. Only the position distribution of the target vehicle and its neighboring vehicles was considered in the division and reduction of vehicle group situation mentioned above, while the impacts of following vehicle, vehicle type, and the characteristic of driver, such as driving propensity, were ignored. X Zhao et al. 8 present a freeway network traffic incident situation evaluation model by introducing the invulnerability concept in the complex network theory and perceiving the topological structure of a road network with the help of traffic incident situations. The model provides a solution for incident situation comprehension from the road network structure point of view. X Wang et al. 9 built the mathematical expression for vehicle group situation, and the type, speed, and location of vehicles in the interest-sensitive area were considered synthetically. However, the impact of driver characteristic on vehicle group situation was not taken into account. H Wang et al. 10 proposed a new method to describe air traffic situations based on the theory of complex networks and elaborate its evolutionary laws, expecting to reveal the basic characteristics of air traffic complexity. Results show that the complexity vector helps to describe the structural characteristics of air traffic situations and identify the evolutionary characteristics of different traffic situations. And the traffic situations of high-altitude sectors bring more 2D complexity and less 3D complexity than those of low-altitude sectors.
It is difficult to get all the relevant data of vehicles in a wide range. In addition, with the awareness of privacy protection getting stronger, it has become more and more difficult to obtain the psychological and physiological information of drivers. Therefore, it is of great significance to obtain the evolution law of vehicle group situation with as less information as possible. The appearance and development of global positioning system (GPS) provide favorable conditions for the improvement of vehicle intelligent (automatic and assistant) driving system and also provide a new data collection method for the researchers in many fields. In view of this, the information of time and location was collected through GPS when the sample vehicles arrived at virtual trip line (VTL). Poisson’s distribution was used to identify vehicle group situation which was constituted by target vehicle and its neighboring vehicles when the target vehicle arrived at the end of study area. And the dynamic Bayesian network (DBN) was used to build the reverse deduction model of vehicle group situation.
Methodology
Vehicle group situation division and reduction
Vehicle group situation division
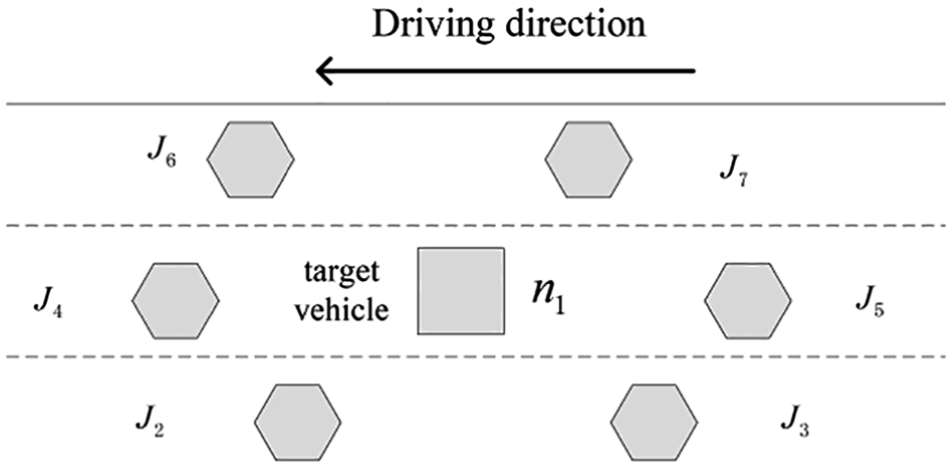
Three-lane scene (as shown in Figure 1) was taken as an example and the target vehicle was the research subject. The interest-sensitive area of target vehicle was divided into six sub-areas including left front, left rear, front, rear, right front, and right rear according to the position of target vehicle’s front bumper.

Vehicle group situation in three-lane scene.
Vehicle group situation, changing with traffic factors, objectively exists in the whole traffic environment. The concept of “force” in physics was used to describe the effect of vehicles in each sub-area on the target vehicle. The set of “force” was used to abstractly represent the vehicle group situation where target vehicle located. When the vehicle in a sub-area which had a positive impact on target vehicle to choose the lane where the sub-area located, the force of the vehicle in this sub-area was defined as attraction. Otherwise, the force was defined as repulsion.
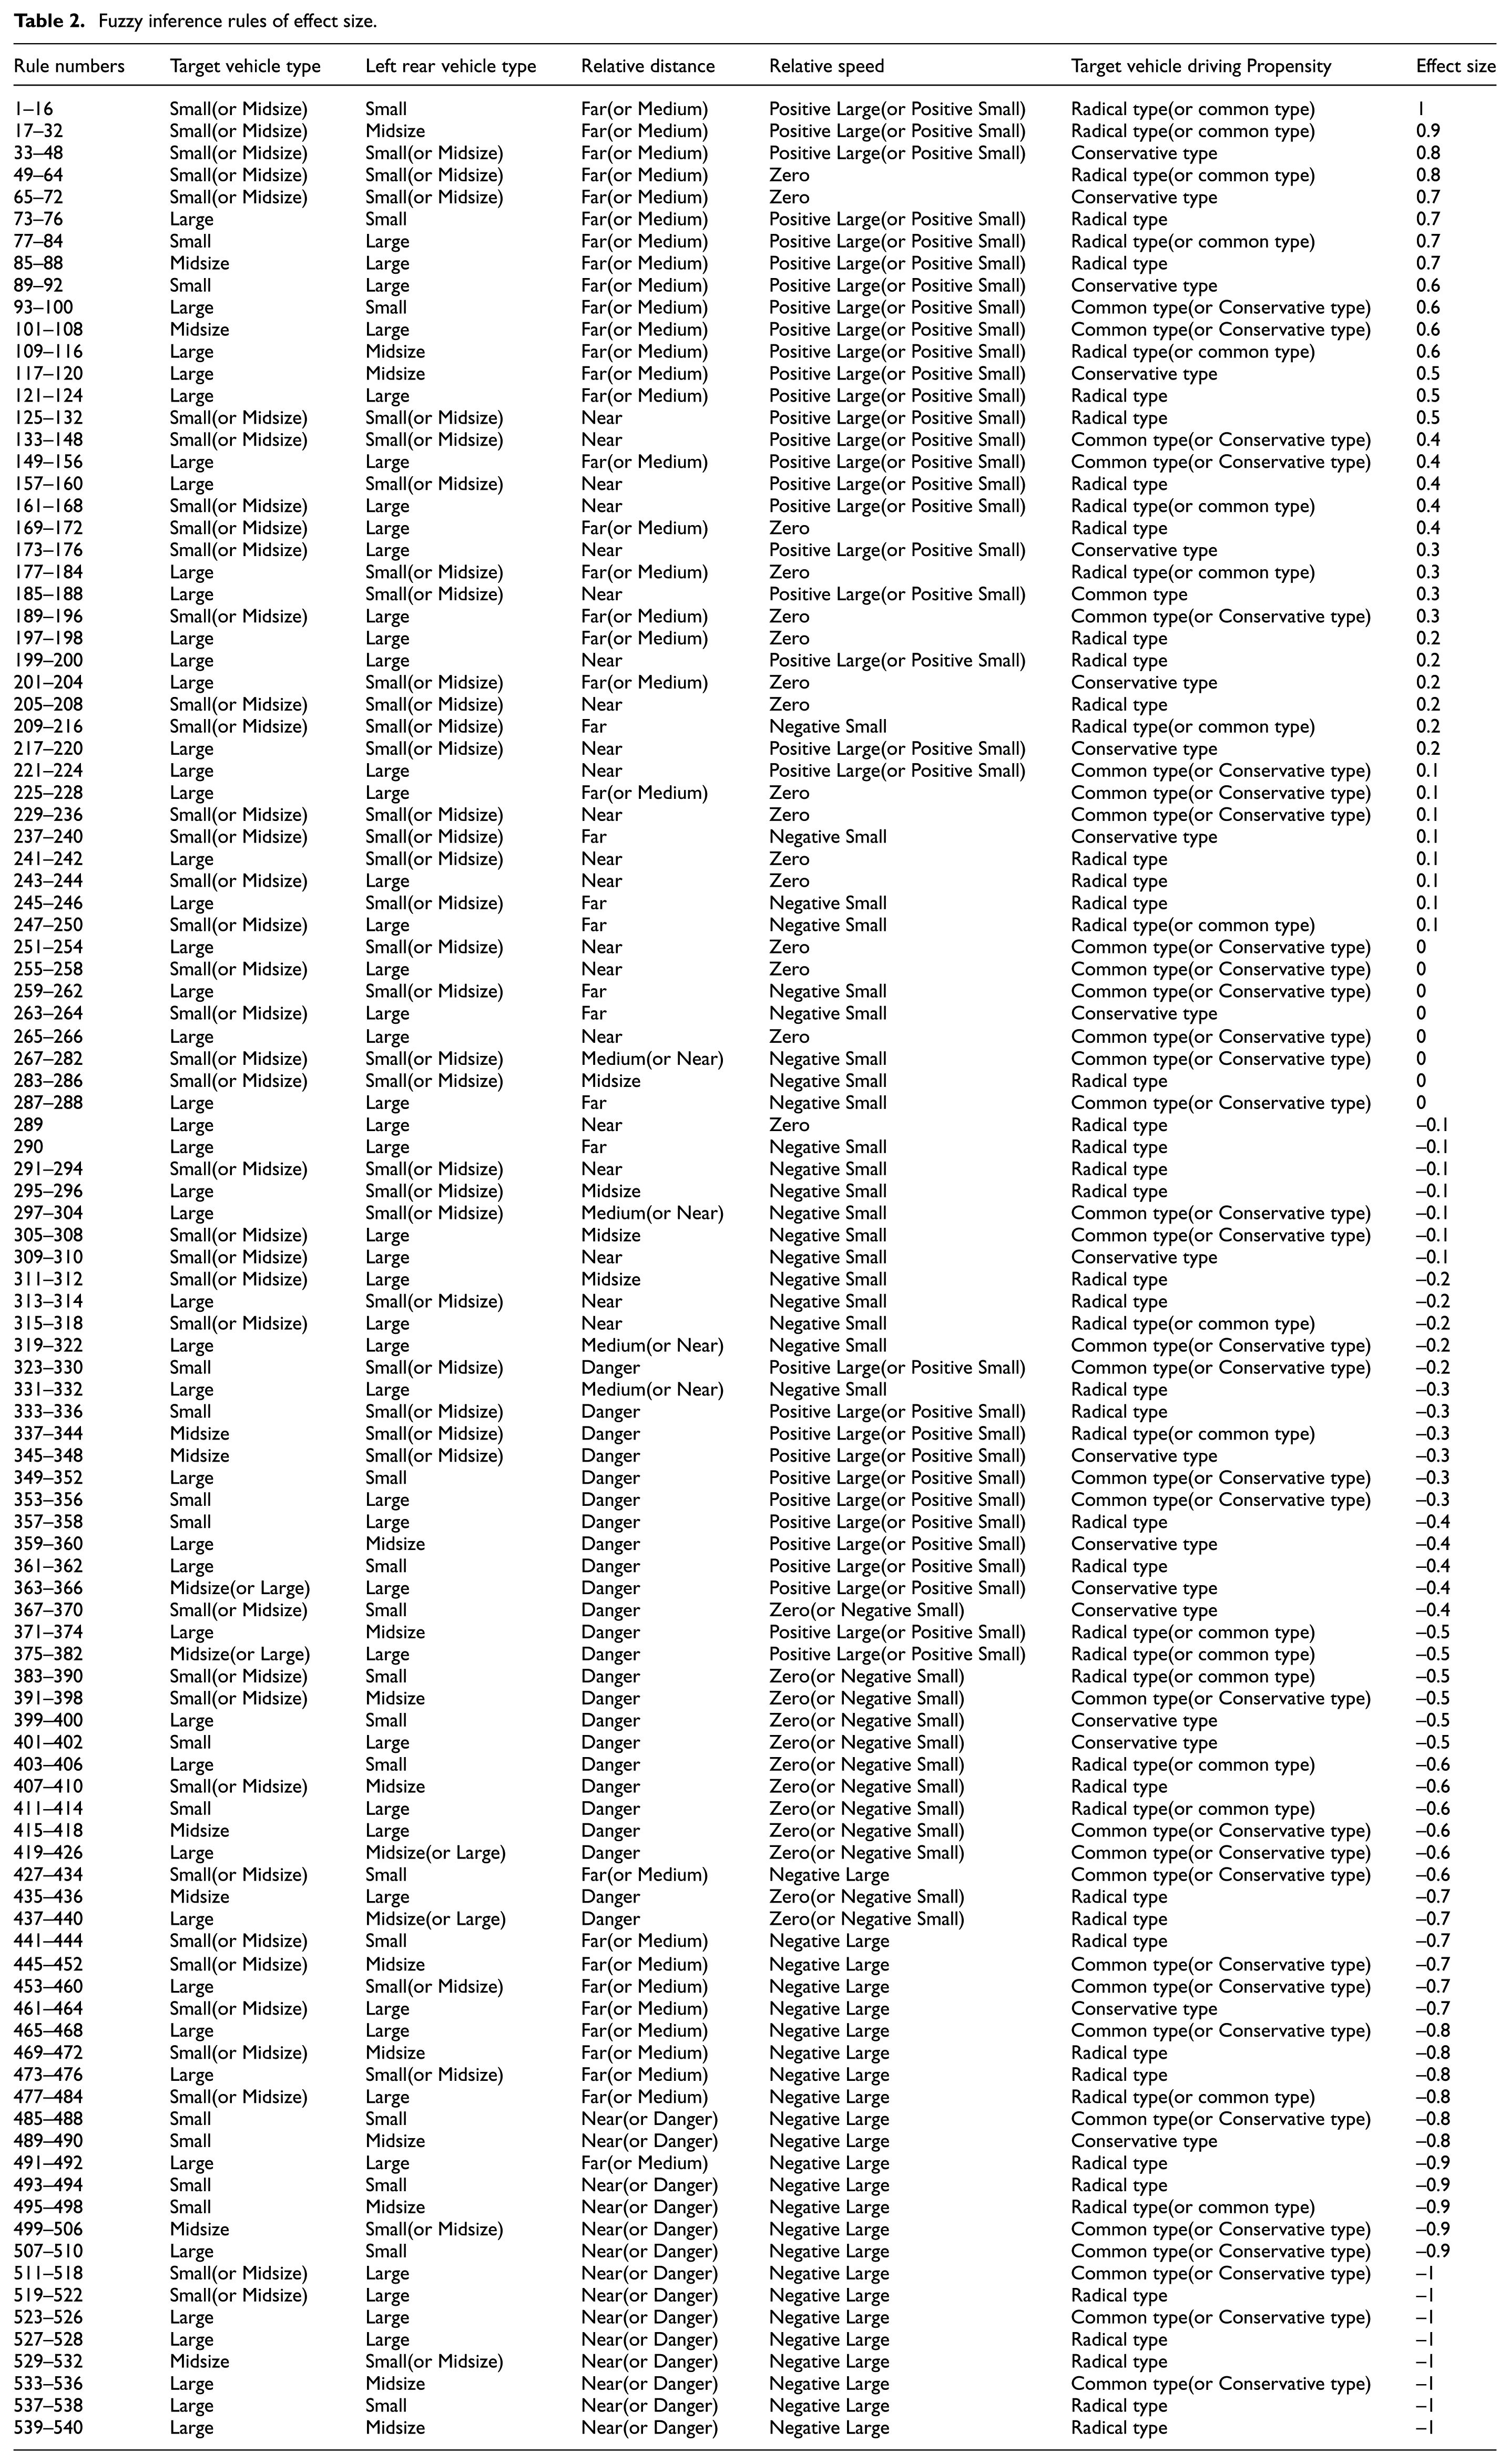
Fuzzy calculation method was used to obtain the force that target vehicle subjected from vehicles in each sub-area. The magnitude of the force was described with effect size: the greatest effect size of repulsion was represented by “–1,” while the greatest effect size of attraction was represented by “1.” A real number in the section was used to represent the effect size of different forces (as shown in Table 1). The fuzzy logic method was used to score the effect size based on the comprehensive analysis of experimental data and the repeated simulation debugging. The factors of relative distance (Far, Medium, Near, Danger), relative speed (Positive Large, Positive Small, Zero, Negative Small, Negative Large), vehicle type (Large, Midsize, Small), and driver’s propensity of target vehicle (radical type, common type, conservative type) were considered. The effect size calculation of left rear vehicle was taken as an example, fuzzy inference rules of effect size are shown in Table 2. Limited to space, the boundary value calculation of fuzzy variables, corresponding fuzzy set and fuzzy subset was not listed here.
Effect size of different forces.

Fuzzy inference rules of effect size.
Vehicle group situation reduction
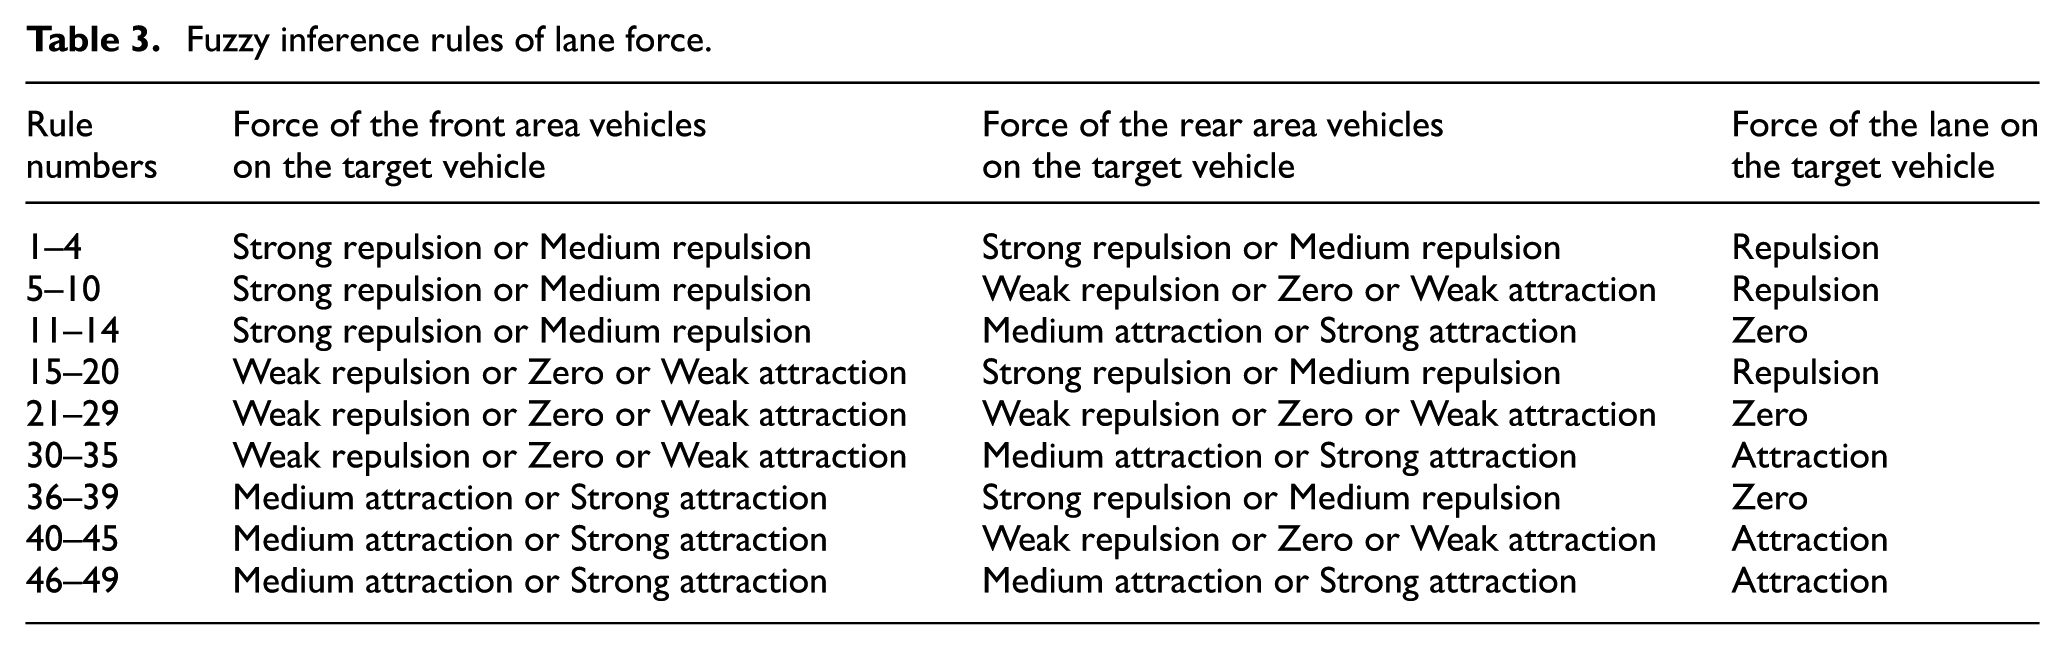
The force strength of sub-area vehicle on the target vehicle can be judged according to the effect size. The force subjected from the lane in which the target vehicle located can be obtained according to the force from vehicles in front and rear area on target vehicle. The fuzzy inference rules are shown in Table 3. Similarly, the force subjected from the other two lanes can be obtained. When the target vehicle located in the right or left lane, the force subjected from the other two lanes can be merged. The fuzzy inference rules are shown in Table 4. The symbol “+” was used to represent attraction, and “–” was used to represent repulsion. The vehicle group situation could be divided into 16 types (as shown in Figure 2).
Fuzzy inference rules of lane force.
Force of side lane to target vehicle.


Vehicle group situations under three-lane condition.
Vehicle group situation recognition
The arrival of vehicles in traffic environment with lower flow was in accordance with Poisson’s distribution according to the traffic flow theory 11 the flow in each period of time for urban road intersections, and it has a wide range of applicability. 12 The arrival distribution of experimental vehicles at VTL 13 conformed to Poisson’s distribution under the condition of 100% penetration rate in urban road. The schematic diagram of VTL is shown in Figure 3. However, due to the low penetration rate of GPS, data loss, and other factors, the acquired data were often incomplete or might have anomaly. In view of this, the information of time and position of the vehicle arriving at VTL were obtained by GPS. And the data were used to recognize the vehicle group situation for the end of the road (VTL2) based on Poisson’s distribution theory. The vehicle group was constructed by the target vehicle and its neighboring vehicles when the target vehicle arrived at VTL2.

VTL schematic diagram.
Poisson’s distribution
Basic formula
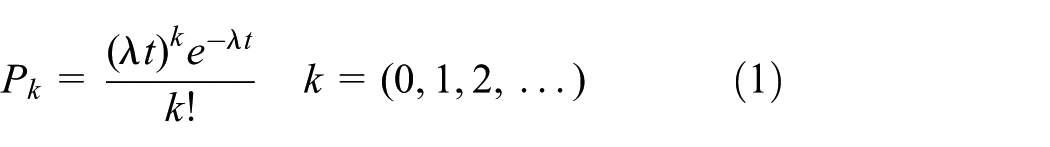
In formula (1),
Recurrence formula

Recognition steps
The position distribution of the target vehicle and its neighboring vehicles is shown in Figure 4. Recognition steps of vehicle group situation are shown as follows:
Obtain the arrival time at VTL1, VTL2 of target vehicle, and its neighboring vehicles in different sub-areas when target vehicle located at VTL2. The arrival time at VTL1 and VTL2 of target vehicle Calculate the travel time of experimental vehicles Calculate the average speed of experimental vehicle Calculate the difference of arrival time at VTL2 between target vehicle and other experimental vehicles: Estimate the relative distance of each experimental vehicle when target vehicle
Assume that the vehicle arrival of each lane conformed to Poisson’s distribution. The number of non-experimental vehicles around the target vehicle could be obtained according to Poisson’s distribution theory. The number of vehicles which arrived at the time periods of
Assume that the space headway of non-experimental vehicles located between two experimental vehicles conforms to negative exponential distribution. The position information of vehicles that neighboring the target vehicle can be analyzed according to
Because the vehicles neighboring target vehicle might be a non-experimental vehicle after reduction. The speed of vehicle
The dynamic recognition model of driver-vehicle features based on Bayesian decision tree was used to recognize the type of target vehicle and driving propensity according to the travel time
The type, position, and speed of neighboring vehicles and driver’s propensity of target vehicle when target vehicle arrived at VTL2 were considered synthetically to obtain the force of target vehicle subjected from each lane. And then the vehicle group situation at the end of the road can be recognized.

Position distribution of target vehicle and its neighboring vehicles.
Position distribution of target vehicle and its neighboring vehicles.
Reverse deduction of vehicle group situation transition
DBN
Bayesian network (BN) was a theory which the directed acyclic graph was used to describe the probabilistic relationship. DBN was an extension that the constraint of time property was added to the original BN structure.14,15
A simple DBN is shown in Figure 6.


A simple dynamic Bayesian network.
In formula (4),
The DBN was consisted of

In formula (4),
Model establishment
DBN14,15 was used to obtain the reverse transition rule of vehicle group situation. Specific steps are shown as follows:
Select the indicators that can be used to characterize the vehicle group situation, such as the force of vehicles in each lane on target vehicle.
Collect each parameter at the same time, and the range of each parameter variables must be composed of a series of discrete values. If the current time was

Structure diagram of dynamic Bayesian network.
As shown in Table 5, the set of the lane which target vehicle located in was marked as
Specific description of each set.

3. The transition probability matrix
4. The reverse transition probability matrix of vehicle group situation

In formula (5),
Result
The experimental data of 30 drivers were selected to calibrate the model, and the transition probability matrix of vehicle group situation was obtained according to the reverse deduction model of group situation vehicle transition. The transition probability matrix of vehicle group situation is given as

Experimental design
Experimental equipment. The experimental data were acquired through a dynamic driver–vehicle–environment information acquisition system (including PsyLAB human factors engineering experiment wireless sensors, portable physiological signal measurement instrument Bioharhess 3.0, SG299-GPS non-contact multi-function speedometer, Notebook Computer, etc, as shown in Figure 8). In addition, many types of software were used in the experiment, such as PsyLAB software, SPSS19.0, Corel Video Studio 10.0.
Experimental Content Fifty drives, including 33 males and 29 females, were selected to take part in the experiment. The age distribution of the object drivers was between 18 and 36, and the average age was 26.68.The participants consisted of undergraduate students, urban residents, and taxi drivers in Zibo. All the participants were licensed drivers. The participants driving experience was ranged from 1 to 9 years, and the average driving experience was 3.46 years. Fifty drivers were organized to participate in a psychological questionnaire test referred to the literatures,4–7 and the driving propensity of 50 drivers could be obtained. The time series data of influential factors on vehicle group situation (vehicle type, position, etc.) were collected in actual driving experiment.
Experimental time, location and road condition. The experiments were implemented at 8:30–10:30 in a normal workday with good weather and road condition. The road sections including Liantong Road, Shiji Road, Huaguang Road, and Nanjing Road near Shandong University of Technology in Zibo, Shandong province were selected as driving experimental route (as shown in Figure 9). The traffic state was non-free flow, and drivers can change lanes freely according to their habits and preferences. Multi-group data can be collected from each driver.

Dynamic driver–vehicle–environment information acquisition system.

Experimental route.
Discussion
Actual driving verification
The experimental data of 20 drivers which were not used for model calibration were selected to verify the model. The accuracy of recognition and derivation of vehicle group situation were related to the penetration rate of experimental vehicle. The corresponding recognition accuracy under the penetration rate of 20%, 25%, 30%, 35%, and 40% was calculated in. Sixteen kinds of vehicle group situation were identified finally through the experimental data. The model established in this article was used to process the experimental data and the transition probability of vehicle group situation can be obtained. The type of vehicle group situation with the maximum probability was regarded as the final result of reverse derivation, and the results were compared with the identification results. The accuracy of the model under different penetration rate is shown in Figure 10.

Accuracy of the model under different penetration rates in actual driving experiment.
It can be concluded from Figure 10 that the accuracy rate of the model was above 77% when the penetration rate was 20%. The accuracy rate of the model was above 80% when the penetration rate was 25%. The accuracy rate of the model was increasing with the addition of penetration rate. The accuracy rate increased significantly when the penetration rate increased from 20% to 30%. The increase amplitude of accuracy rate was relatively small when the penetration rate exceeded 30%. In general, the model was reasonable.
Virtual driving verification
Parallel interactive driving simulation experiment on driving simulators was designed to validate the model. The accuracy of model under different penetration rate is shown in Figure 11. It can be concluded from Figure 11 that the agreement between simulation results obtained through the model and recognition results was high. When the penetration rate was 20%, the accuracy rate of the model was above 75%. When the penetration rate was 25%, the accuracy rate of the model was above 80%. The accuracy rate of the reverse deduction model of vehicle group situation was increasing with the addition of penetration rate. In general, the accuracy rate of the reverse deduction model of vehicle group situation is relatively high, and the model is scientific and reasonable.

Accuracy of the model under different penetration rates in virtual driving experiment.
Conclusion
Three-lane condition was taken as an example, vehicle group situation which constituted by target vehicle and its neighboring vehicles was identified based on Poisson’s distribution when the target vehicle arrived at the end of the study area, and then the reverse deduction model of vehicle group situation was built with DBN in this article. The factors such as vehicle state, driving propensity which influence the transformation of vehicle group situation during driving were considered synthetically. The experiments of actual and virtual driving were used to verify the validity of the model. The verification results showed that the model accuracy was relatively high. The model accuracy reached more than 75% when the penetration rate of experimental vehicles was 20%, and the model accuracy would be improved with the increase of the penetration rate. Overall, this model was scientific and reasonable. It is worth mentioning that the method and the model proposed in this article could be used to protect drivers’ privacy in a certain extent. The main approach for privacy protection was to collect the information of vehicle and driver as little as possible. Although the penetration rate of experimental vehicle, namely the popularizing rate of GPS, has a significant influence on the accuracy of model, the problem will be solved with the increase of usage amount mobile phone equipped with GPS.
Footnotes
Handling Editor: Gang Chen
Declaration of conflicting interests
The author(s) declared no potential conflicts of interest with respect to the research, authorship, and/or publication of this article.
Funding
The author(s) disclosed receipt of the following financial support for the research, authorship, and/or publication of this article: This study was supported by the State Key Laboratory of Automotive Safety and Energy under Project No. KF16232, Natural Science Foundation of Shandong Province (Grant Nos ZR2014FM027, ZR2016EL19), Social Science Planning Project of Shandong Province (Grant No 14CGLJ27), Project of Shandong Province Higher Educational Science and Technology Program (Grant No J15LB07), and the National Natural Science Foundation of China (Grant Nos 61074140, 61573009, 51508315, 51608313).