
Abstract
This study used improved simulated annealing arithmetic to improve the semiconductor packaging ball placement process capability. The simulated annealing computing process was combined with an artificial neural network, Metropolis algorithm, and sequential Gaussian simulation. Grey relation analysis was used as the target value, which is intended to obtain the optimum parameter design of process capability. The results showed that the substrate design-Pad Open is 0.30 mm ball size, 0.275 mm Pad open, Profile type B, maximum temperature 236 (°C), solder melting time 53 (s), preheating temperature 176 (°C), and a solder ball component, as SAC405 can result in a parameter design for optimal solder ball shear strength of Cpk = 2.38 and
Keywords
Introduction
The purpose of packaging is to provide the finished product (package) with an interface, in order to connect the internal electrical signal via the packaging material to the system and to prevent the silicon chip from being damaged and corroded by external force, water, moisture, and chemicals. The main process of semiconductor packaging is as shown in Figure 1. This research scope is Ball Placement, and the purpose of Ball Placement is to place the Solder Ball on the substrate. The Solder Ball is the circuit connection and heat sinking conductor between substrate and mainboard. The ball placement process consists of a Ball Mount, IR-Reflow, and Cleaner. In terms of ball placement, the pad of the substrate is coated with flux, and the Solder Ball is placed on the Pad of the substrate at the high temperature (150°C–245°C) of IR-Reflow furnace, the Solder Ball reacts with flux and half of it melts on the substrate pad. The Cleaner removes the excess flux and the oxide after reaction from the substrate to avoid contaminating the substrate. In terms of the research setting range of ball placement, this study uses the reflow parameter as the research subject and uses solder ball strength process stability as the target response value. The thin and fine ball grid array (TFBGA) (Figure 2) product is validated, the solder ball shear strength (Figure 3), the fatigue life of the TFBGA can be obtained (larger-the-better, LTB), warpage (smaller-the-better), residual stresses (smaller-the-better) are the quality characteristics, and a higher solder ball shear is better, thus, it is a LTB characteristic. However, higher strength may be accompanied by IMC (intermetallic compound) layer embrittlement, which may result in another reliability problem; thus, it is not discussed in this study for the moment.1,5–8

Assembly process and research process.

Solder bump structure.

Solder ball shear test.
The purpose of ball placement is to lay the solder ball on the substrate. The solder ball is the conductor of electrical connection and heat dissipation between the substrate and the mainboard. The process of ball placement can be divided into three procedures: Ball Mount, IR-Reflow, and Cleaner. As for Ball Mount, it coats a layer of flux on the pad base of the substrate first, and then it mounts the solder ball on the substrate. Through the high temperature of the reflow oven (about 150°C–245°C), half of the solder ball will be fused to the pad of the substrate after it reacts with the flux. Cleaner is for removing the excess flux and the oxide after the reaction on the substrate to avoid contamination of the substrate. This study used the reflow parameter as the study subject and used the processing stability of the solder ball strength as the target response value. Taking the TFBGA product as the subject for verification, the thrust strength of the solder ball (Figure 3) was used as the quality characteristics, in which case the higher the thrust is of the solder ball, the better it is, and so it exhibits the LTB characteristic. However, when the strength rises, it may be associated with the embrittlement of the IMC layer, and it may cause another reliability problem. Thus, it is not included in the research scope of this study.1–4
This study used the Taguchi method and multiple quality characteristics to calculate the signal-to-noise (SN) ratio and factor level combination from the original data measured after the soldering experiment and took multiple quality characteristics to work out analysis of variance (ANOVA) and contribution rate data, which are integrated into a cross-over analysis table in order to obtain four visualized optimal solutions. The SN ratio was used as an input value, the priority value of various schemes was found by the conversion mode of grey relation analysis, and a rough optimal solution was obtained. The optimum architecture of the relation of the standardized data was realized using the back-propagation neural network method. The approximately global optimum was achieved by employing a genetic algorithm and the improved simulated anneal arithmetic. Finally, the optimal solutions obtained by the aforesaid methods were validated by a confirmation experiment to find out the optimum parameter combination.9–24
The higher the thrust of the solder ball, the better it is, and therefore, it exhibits an LTB characteristic 25

SNLTB is SN (signal-to-noise) ratio of the LTB characteristic, MSD is mean square error of deviation from the target value, and yi is observation data.
IMC
IMC is a chemical composition, and so the energy must be given to the formation of IMC, which is the reason why the solder paste needs to be heated during the welding process. In addition, in the composition of the solder paste, only the pure tin (Sn) has a diffusion reaction with the copper base (e.g. organic solderability preservative, I-Ag, I-Sn surface-treated board) or nickel base (Electroless nickel immersion gold surface-treated board) in the strong heat, and thus a solid interface IMC is generated.1–4
ANOVA
It is a common statistical model in data analysis, and it mainly explores the relationship between the dependent variable of the continuous data type and the independent variable of the categorical data type. 25
Literature review of this study is shown in Table 1.
Literature review of this study.

BGA: ball grid array.
Research method
Current condition analysis and parameter setting
The current condition data were the calculated process capability index Cpk = 1.34 (
Current data (solder ball strength).

Control factors and levels.

As for the temperature characteristics of the alloy only, the difference is not big, but the slurry interval of SAC105 is larger. This means that when SAC305/405 are completely in the liquid phase, SAC105 is still partially not fully liquified. Therefore, if SAC105 is used in the solder paste, then when the solder ball uses SAC305/405, it will have a higher probability of generating a void. Kim et al. 19 used a sandwich joint test piece to carry out the relevant tensile test on SAC305. The experimental results show that the tensile strength of the test piece is larger than that of the block. It shows that the thickness of the medium metal phase has a considerable correlation with the anti-shear strength of the joint surface, and the thickened medium metal phase will make the breaking strength of the joint surface decrease significantly.1–4
The solder ball shear strength is a quality characteristic, in which a higher solder ball shear is better, and so it presents a LTB characteristic. However, the high strength may be accompanied by IMC layer embrittlement. The viscoplastic strain energy density is substituted in the model proposed by Darveaux, thus obtaining the fatigue life of TFBGA (LTB). 2 The literature has paid increasing attention to the warpage (smaller-the-better) and residual stresses (smaller-the-better). Previous studies indicated that the first cause for the warpage of various components of an IC package is the non-uniform warpage resulting from different material coefficient of thermal expansion, or the curing shrinkage of epoxy molding compound, or the non-uniform temperature change.3,4
According to the specific quality characteristic SN ratio’s significance of the Taguchi method and the specific quality characteristic contribution rate obtained by ANOVA, the cross-over analysis comparison table can be used for judgment, so as to obtain the optimum parameter combination of this part, as shown in Table 4. In terms of significance, according to the contribution rate after weighting, among the ABCDEF factors, the levels reaching the optimum contribution degree are A1B2C2D1E2F2. However, the maximum weighted ratio of solder ball shear strength is 40% in this experiment, and the Factor C solder ball shear strength test has a significant impact. Therefore, aside from considering C2, C1 can also be considered. The quality parameters of Factor D are insignificant, but the contribution rate in warpage is the highest, and the residual stresses rank second. Thus, D1 and D2 factors shall be considered as well. The four optimum combinations are hence A1B2C1D1E2F2, A1B2C1D2E2F2, A1B2C2D1E2F2, and A1B2C2D2E2F2.
Cross-over analysis of quality characteristics.

Grey relation analysis optimum parameter level combination
The optimum parameter level combination considering the
The degree of relationship among sub-systems or elements could be evaluated through grey relational analysis,26–28 and important influential factors to the development trend are then determined to learn the major features of the system through the following steps:
Step 1. Normalize original data. Normalize by dividing the original data

Step 2. Designate the standard sequence and calculate the difference sequence. Take the mean value as a standard sequence, that is, sequence 0; the difference sequence

Step 3. Calculate maximal difference


Step 4. Calculate grey relational coefficient:

Step 5. Calculate the grey relationship

Step 6. Conduct sequencing according to the grey relationship.
Table 5 lists the optimum parameter level combination considering
Grey relation analysis.

Artificial neural network setting and execution
The mode is selected as TanhAxon, the lower bound of the learning rate is set as 0.03, the upper bound is 0.2; the lower bound of the initial value of momentum is set as 0.6, the upper limit is 0.9; the number of training cycles is set as 10,000; the number of layers of the artificial neural network is set as 1–9; the performance index is mean squared error (MSE) for determining network quality, as expressed as equation (7)
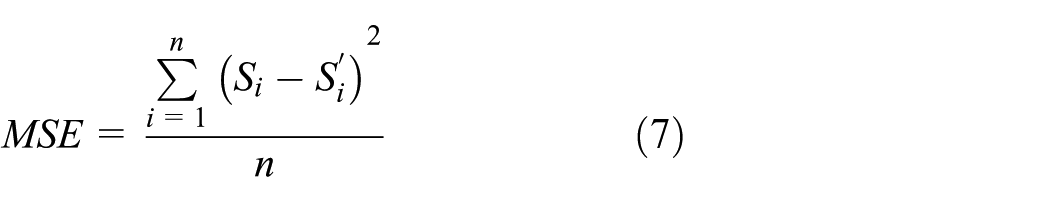
where n is the number of samples,
The standard criterion is that the MSE value of training and testing is lower the better in the test values; thus, the 6-6-1 artificial neural network is used as the executed network architecture according to Table 6.
Artificial neural network MSE.
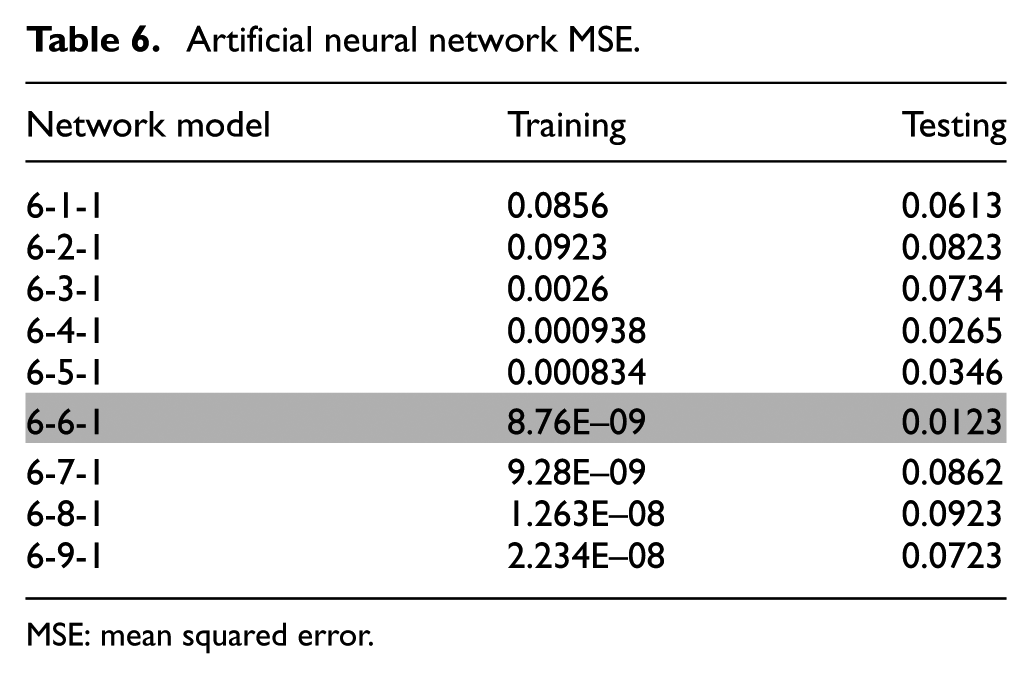
MSE: mean squared error.
Optimum parameter analysis of genetic algorithm
According to the trained neural network model, the model has six input layers, one output layer, six nodes of a hidden layer, the learning rate is 0.15, and the momentum is 0.95. The
Genetic algorithm implementation results.

Optimum parameter analysis of improved SA
The neural network training model is called, the
Summary analysis of SA computed performance.
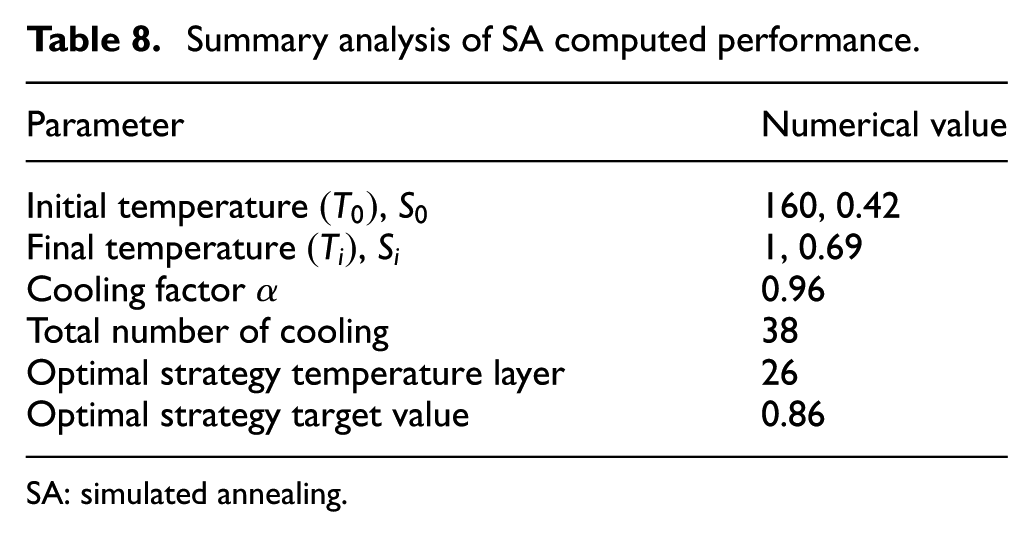
SA: simulated annealing.
Improved SA implementation results.

SA: simulated annealing.

Improved SA parameter convergence map.
The SA structure of this study consists of the Metropolis algorithm, sequential Gaussian simulation, and an annealing process, as described below.11–16,31
The Metropolis algorithm is as follows:
Step 1. When iteration
Step 2. A neighborhood solution is generated according to the state

Step 3. Calculate increment
Step 4. If
If
A random number u subject to
Step 5.
The sequential Gaussian simulation is as follows. The sequential Gaussian simulation is based on the stochastic simulation theory, where the known data points, and all the simulation values in simulated positions, are combined with the conditional probability to simulate the new location point. This simulated new value will be put in the condition data of the next simulation, and the remaining can be deduced accordingly till all unknown point values in the simulation region are simulated. A random variable
Define a random path.
Decide whether to use simple kriging or ordinary kriging and normal variation functions. While the simple kriging is generally used, if the data are large and the local average varies significantly with the region, then ordinary kriging is used. The variation function is selected by cross-validation. The selected kriging method and variation function are used to determine the complementary cumulative distribution function (CCDF) parameter of
The CCDF simulates the
The simulated value obtained in Step 3 is added to the data.
Execute the next point simulation till all the simulated points are simulated.
Convert the simulated normal
Execute simulation once and discuss whether the variation functions of various simulation values conform to the theoretical variation function of the actual value and the distribution of the simulation values in the space.
The simulation procedure is as follows:
An initial numerical model is constructed, this model simulates the initial melting of an actual annealing phenomenon, and a random value is allocated to each grid. If the problem to be handled is of co-simulation, that is, the secondary variable can be used, then the initial values can be allocated according to the appropriate condition distribution, as obtained from validation.
The objective function is defined as the measurement of the gap between the wanted spatial characteristics and the implementation result characteristics, for example, the gap between the variation function of the implementation result and the theoretical variation function.
The image is corrected by giving a random location a new value.
The objective function value decreases, and the correction is always accepted. If the objective function value increases, the correction is accepted with a specific probability.
When the probability is accepted with an inappropriate exchange, and the value decreases, the disturbance process continues until a low objective function state is far.
The annealing process is as follows:
Step 1. Select an initial solution
Step 2. Let
Step 3. Reduce temperature
Step 4. Check whether the annealing process is finished. If yes, the current solution
Validation experiment
According to Table 8, the grey relation analysis, artificial neural network, and the improved SA make up the optimum combination of the validation experiment. Its
A total of 10 confirmatory experiments were conducted in this study. The 95% confidence interval was verified before the
Experimental response value and SN ratio of the L18 orthogonal array.

SN: signal to noise.
Results and discussion
According to Table 11, this study is the optimum combination of a validation experiment, the
Validation experiment judgment value.

SA: simulated annealing.
Conclusion and future research
According to the case analysis in this study, substrate design-Pad Open as 0.30 mm ball diameter, 0.275 mm Pad open, Profile type B, maximum temperature 236 (°C), solder melting time 53 (s), preheating temperature 176 (°C), and solder ball component SAC405 can result in the parameter design of the optimal solder ball shear strength of Cpk = 2.38 and
Footnotes
Handling Editor: Peter Nielsen
Declaration of conflicting interests
The author(s) declared no potential conflicts of interest with respect to the research, authorship, and/or publication of this article.
Funding
The author(s) received no financial support for the research, authorship, and/or publication of this article.