
Abstract
In this work, the corrosion behaviors of steel strands exposed to acidic rain under alternating stress, static stress, and no stress were modeled based on experimental data. The results are based on an image corrosion feature analysis of steel strands at different corrosion times and operating conditions, and the corrosion fatigue behaviors indicate that the steel strands display different degrees of corrosion under different loading conditions. The corrosion fatigue behaviors of the steel strands were analyzed based on the corrosion features in the images of the steel strands subjected to different corrosion times and operating conditions. The results showed that different loading conditions lead to different degrees of corrosion in the steel strands. The samples’ surface images and corrosion damage continuously changed as the corrosion time increased. Given the same corrosion time, the degree of corrosion was the highest in samples subjected to alternating stress, followed by that in samples under static stress. Unstressed samples had the lowest degree of corrosion. The variations of the corroded surface and the degree of corrosion in the material were particularly reflected by three image features pitting rate, pit depth, and pit radius. No significant changes occurred in the samples when the corrosion time was 120–360 h, regardless of the type of stress they were subjected to. This finding indicated that pitting has a minimal effect on the force-bearing capacity of steel strands during pit nucleation and expansion. However, a substantial decrease in the fracture strength occurred under alternating stresses when the pits expanded into cracks (very deep cracks were found at the 720-h mark in the samples subjected to alternating loads). Conventional damage tolerance analysis methods and software can then be used to perform crack propagation life predictions by treating pits as quantizations of a crack. Fatigue life estimation based on the corrosion images with the appropriate combination of corrosion damage levels and load-bearing capacities is a viable technical pathway. The findings of this work will provide new ideas for the assessment of structural reliability and safety via the processing of inspection photographs.
Keywords
Introduction
Stay cables are important load-bearing members in cable-stayed and arch bridges. Their durability directly affects the operational safety of bridges. 1 Several cases of external or human factors damaging the protective jacket of stay cables in cable-stayed bridges have been recorded both overseas and in China. These damages expose the galvanized steel wires or steel strands inside the cable to the natural environment, consequently affecting the load-bearing capacity of the steel wires or strands by varying degrees. Many studies have been performed on steel corrosion, from which several valuable results have been obtained. For example, Betti et al. 2 used acetic acid to adjust NaCl and NaSO4 solutions, which were used as corrosive media for salt spray–accelerated cyclic corrosion tests. The authors investigated the corrosion mechanism of high-strength galvanized steel wires under different pH levels, humidity, and dead loading. The mass losses, hydrogen concentrations, and ultimate load of the steel wires were studied. Brown and Barnard 3 used computational methods to construct a three-dimensional surface microstructure model for studying the corrosion behaviors of Zn–Al-plated steel wires. Meanwhile, Barton 4 and Suzumura and Nakamura 5 used artificial methods for accelerating corrosion to investigate the corrosion behaviors of galvanized steel wires in NaCl corrosion media. Furuya et al. 6 placed a 2-m-long cable sample in natural environments for corrosion experiments. They noted that the main causes for adverse corrosion environments within cables are the presence of water inside cables and the high temperatures. Li and colleagues7–10 revealed the characteristics and dynamic behaviors of the corrosion of steel strands in chloride salt corrosive environments, and constructed corresponding corrosion rate and corrosion fracture failure probability models. Similarly, Xu 11 measured the surface roughness of high-strength steel wire samples through artificially accelerated corrosion experiments and performed probabilistic statistical analyses on uniform corrosion and pit depths. However, most of the currently existing studies only considered steel wire/steel strand corrosion in stress-free or static stress states, whereas studies on corrosion occurring under alternating stress are very scarce. 12 In reality, the stay cables of a cable bridge may undergo large-amplitude vibrations when subjected to operational and environmental loads (wind, rain, etc.). 13 These large-amplitude vibrations tend to exacerbate cracks in pipe anchors and protective PE (polyethylene) jackets. They also expose the steel wires or strands of a stay cable to corrosive environments, thereby worsening the development of corrosion damage in these steel wires or strands. Therefore, the mesoscopic damage behaviors of the corrosion fatigue in stay cables with damaged protective jackets, which are subjected to the coupled actions of alternating loads and the environment, must be studied. Corrosion images are important for recording the surface morphology of steel wires or strands because they reflect the morphological alterations and the degree of corrosion damage induced by corrosion on the material surface. Surface corrosion damage affects the fracture performance of structural materials. Accordingly, we analyzed corrosion images herein to extract their corrosion-related data and constructed relationships between the degree of corrosion damage and the fracture performance under varying conditions. These data will be highly necessary in fatigue life predictions. The corrosion forms that occur in steel strands in an acid rain environment under different stress types (i.e. alternating stress, static stress, and no stress) were modeled in this work, based on experimentally obtained data. The corrosion characteristics of steel strands were obtained via the digitalization of corrosion images. An analysis of the corrosion morphologies and the mechanical performance of the corroded steel strand samples was also performed. We have taken the first step toward the construction of a method for fatigue life analysis based on corrosion images by studying the corrosion characteristics of steel strands subjected to varied operating conditions.14,15
Experimental overview
Experimental environmental simulator
The primary experimental apparatus of the artificially accelerated acid rain experiment herein was the salt spray corrosion test chamber (Figure 1). The composition of the corrosive gas used in this experiment was based on the chemical composition of normal atmospheric acid rain. However, the corrosive gas concentration was several times (up to tens of times) that of normal atmospheric acid rain, which greatly increased the corrosion rate. Standards for artificially accelerated acid rain experiments had not been provided in China or overseas. Hence, the temperature control device used in this experiment was based on the temperature devices used in acetic acid salt spray tests. A heated water tank was installed on the bottom of the corrosion chamber (Figure 2). The heated water contained in this tank ensured a constant temperature within the experimental chamber. A water level float which automatically cuts the electricity supply to the heater and gives a warning if the water level in the tank falls below the float’s level was also installed in this water tank, thereby ensuring that the heating devices inside the tank will not boil dry and become damaged. 16

Container with a spraying device.
Heated water tank.
The analyses on the constituents of precipitation that occurred within some year in the acid rain regions of southwest China showed that the precipitated rainwater contained
Chemical composition of the acid rains in southwest China.

The experimental temperature was set to 50°C ± 2°C based on the Corrosion tests in artificial atmospheres—salt spray tests (GB/T10125-1997) standard. 18 The pressure was adjusted to 70−170 kPa. The spray volume was set to 250 mL/m2/h. Based on the copper salt–accelerated acetic acid test, experimental standard is described in the GB/T10125-1997 standard. A chemical reagent was created according to Table 1. The regain consisted of 0.60 g NaF, 0.20 g Na2SO4, 2.0 g KNO3, 10.20 g (NH4)2SO4, 12.30 g MgSO4, 0.30 g MgCl2·6H2O, 2.0 g CaCl2, and 3.40 g Ca(NO3)2·6H2O (measured using a digital balance with ±0.10-g error). These reagents were mixed with 50-mL water in a 100-mL measuring cylinder, then transferred to a 4-L vessel. Water was then added up to 4 L. The pH of the resulting solution was measured using precision pH test strips. The pH was adjusted to 2.5 using concentrated H2SO4.
Brief experiment description
The experiments used 5.4-m samples, 15.2-mm-diameter galvanized steel strand (China Baowu Steel Group Corporation, Ltd) with a rated tensile strength of 1860 MPa and a single strand galvanization layer ≥110 g/m2. The experiments were performed in a salt spray cabinet. The accelerated corrosion process used a high-concentration salt spray. Three groups were considered in the experiment (i.e. 5, 15, and 30 days), with two steel strands per group in each stress condition (i.e. alternating stress, static stress, and no stress). Table 2 describes the experimental apparatus, while Table 3 presents the experimental conditions. The corrosion morphologies of the strands were observed using a digital scanning electron microscope after the experiment completion. The GSA-Image Analyzer 4.0.3 program was used to perform gray-scale analyses of the corrosion photographs and facilitate the quantitative analyses of the morphology and distribution of corrosion pits formed under varying load conditions. Tensile tests were then performed on the corroded samples using a universal testing machine to obtain the mechanical performance data of the corroded samples. Subsequently, a comparative analysis was conducted between these data and the mechanical performance data of uncorroded samples. The experimental times were ordered according to Table 3.The experiments were continuously performed 24 h/day.19,20
Parameters of the experimental apparatus.

Test cases.

Experimental results and analysis
Phenomena of the corrosion processes
Photographs of the corrosion phenomena that occurred in the experimental samples were obtained daily. Moreover, a digital scanning electron microscope was used to observe the microscopic phenomena of the corrosion processes. The steel strands inside the corrosion chamber were loaded using a jack, and an increase in the temperature inside the chamber will induce an expansion in the steel strands. The corrosive solution forms a thin film on its surface as it lands on the steel strands. A solvation reaction will occur between the

Sample corrosion morphologies at different time points during the corrosion process: (a) 72 h, (b) 120 h, (c) 240 h, (d) 360 h, and (e) 720 h.
The corrosion products produced in each corrosion stage were different because they were determined by the intrinsic properties of the sample. The outermost zinc plating is the first part that participates in the corrosion process of galvanized steel strands. Hence, the earliest corrosion products contain Zn components. The base metal substrate of the steel strands becomes exposed to corrosive ions after a portion of the zinc plating is corroded. The corrosion of the iron substrate results in the generation of Fe oxides, which subsequently produces red-colored corrosion products. An industrial microscope was used to observe the morphologies of the corrosion products on the experimental samples over 15 days. Figures 4–6 depict these observations.

Surface of the unloaded sample after 15 days.

Surface of the static-loaded sample after 15 days.

Surface of the alternatingly loaded sample after 15 days.
The observations made using the industrial microscope indicated that the corrosion products of the unloaded samples were white-colored crystals that appeared to be needle-shaped at the microscopic level. The surface of these products was not flat and smooth, but was irregular and uneven. The corrosion products also contained cracks, which indicated that the generation of corrosion products during corrosion will generate tension on the sample’s surface. The generation of red-colored rust was observed in the samples subjected to a static load. This red rust was partially covered by white-colored corrosion products. Red spots were also found on the white products. The corrosion products presented as white granules and had microscopic pits. Highly distinct flakes of red rust were observed in the sample subjected to alternating loads. In this case, the granules were smaller than those of the unloaded and static-loaded samples. Furthermore, the number of microscopic holes observed in this sample was also significantly higher. Large flakes of red-colored spots of rust were found beneath the white-colored corrosion products. This white layer was thinner than the two other samples. The comparison between these three samples revealed that the length of time in which the red-colored rust spots were present on the surface (over the course of the experiment) was the highest for the sample subjected to alternating loads, followed by the sample subjected to a static load, then the unloaded sample. After 30 days, the area covered by rust in the sample subjected to alternating loads was higher than that of the sample subjected to a static load. In addition, no red-colored rust appeared in the unloaded sample. In conclusion, the sample subjected to alternating loads had the highest corrosion rate in the zinc plating, followed by the static-loaded sample. The unloaded sample had the lowest corrosion rate. The microscopic pores in the corrosion products indicated that the corrosion products did not fully envelope the sample’s surface, which would obstruct the flow of corrosive ions in the corrosion solution into pits and passivate the corrosion process. The corrosive ions migrated along the pores into the sample, which subsequently led to the corrosion of the iron substrate through direct contact. However, the coverage of the corrosion products on the material surface affected the migration of the ions involved in electrochemical reactions of the corrosion process, thereby leading to a loss of balance in gain and loss of electrons in the anode and the cathode, which affects the pH value of these electrochemical processes. Hence, the generation of the corrosion products will suppress the corrosion rate to a certain extent.
Quantitative analysis of the corrosion morphology
Photographs were taken when the samples were observed using an SK2700B industrial microscope to obtain site images of the sample’s corrosion. The Color Indicator function in the GSA-Image Analyzer 4.0.3 program was used to measure the chroma levels of the images. All the chroma measurements with values below 110 were defined as pits. Chroma distribution histograms were finally derived from the chroma measurements, and statistical distributions were used to calculate the pit densities. The corroded surface images contained information on the pitting state and the size of the corroded area on the material’s surface, thereby reflecting the variations in the corrosion morphology and the degree of corrosion. The corrosion image features (i.e. pitting rate and pit radius) were extracted from the corrosion images using digital image-processing techniques (Table 4). Note that the pit depth was difficult to measure during the earliest stages of corrosion because they were very shallow. The data shown herein were recorded after 120 h of corrosion.
Feature values of the corrosion images and the pitting measurement results.

Analyzing the data shown above, clearly indicated that the samples subjected to alternating loads, static load, and no load have the same corrosion rate during the early stages of corrosion because the Zn atoms in the zinc plating are in a passivated state at the beginning of the corrosion process, and corrosion has only just begun to develop. After some time, the zinc plating will gradually become activated. In addition, the tensile fractures in the plating also occur because of the alternating load on the sample. The corrosive medium then enters the zinc plating and comes into direct contact with the iron substrate, subsequently leading to the occurrence of solvation and electrochemical reactions. The stress threshold for the appearance of microcracks will decrease because of the actions of the alternating load. The corrosive solvation medium will enter the microcracks formed in the sample and solvate ferric substrates within these microcracks, which also keeps these microcracks open. While the effects of corrosion under the action of alternating loads are relatively minute in the early stages of corrosion, the fractures and the microcracks in the zinc plating that occur in the later stages of corrosion will accelerate the corrosion speed. The zinc plating corrosion in the samples subjected to a static load begins from point of solvation and progresses to the solvation of flakes under the actions of stress corrosion. The zinc plating then becomes activated and forms pits, thereby resulting in the flow of solvation media into the metal substrate, which then electrochemically reacts with the iron substrate. However, the ion exchange between the anions and the cations of the electrochemical process is somewhat obstructed because the pit holes are relatively small. While the cathode on the sample surface continuously releases electrons, the rate of ferric ion formation via anode solvation is not able to keep up with the rate of electron release at the cathode, which leads to the formation of a small anode and a large cathode. The formation of this small anode large cathode system induces accelerated motions in the ions involved in the electrochemical reaction and increases the corresponding electrochemical current. Therefore, the initial corrosion rate of the samples subjected to a static load is small, but the corrosion rate will gradually increase over time. 21
As shown in Table 4, after 120-h correction, a thin layer of yellow and white rust is observed on the surface of the sample with alternating stress. The corrosion pits are sparse and small, and the depth of some pits is up to 49 μm. After 360-h corrosion, corrosion pitting is gradually formed on the surfaces of samples under static stress or without stress, but the pit area is still limited. For samples under alternating stress, visible reddish brown pits are formed and start to cross or overlap with neighboring pits. Radii of the pits significantly increase. The pits grow deeper, and some pits are up to 96 μm deep. After 720 h, the corrosion pits area gradually increases under both static stress or non-stress conditions. Samples under alternating stress exhibit larger and deeper corrosion pitting, accompanied by black corrosion products. The depth of some pits reaches 115 μm. Corrosion area and the appearance of pits implied the existence of some intrinsic consistency between surface morphology and the development of microscopic damage. Given the mechanical properties of steel wires currently in use and the difficulties in evaluating corrosive damages, this project aims to explore a new microscopic damage evaluation method based on image or pattern analysis of corrosion surfaces and to investigate the intrinsic link between the image of corrosion surface and the mechanical properties of steel wires. It is of practical significance to apply this link to the safety assessment of the steel wires currently in service.
Mesoscopic analyses based on images
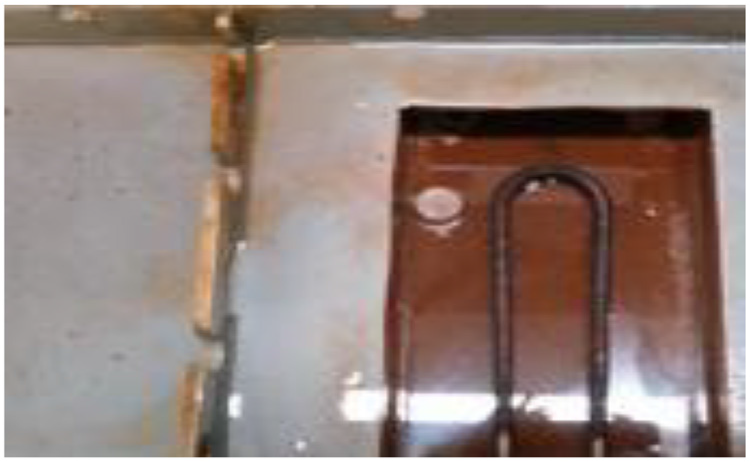
During sampling, the corroded parts of the sample were first cleaned and polished. The sample was dried in a drying oven after all the corrosion residues were removed. Sample mounting was then performed on the dried sample. After securely mounting the sample on the sample tray, a large sample was placed on the sample tray such that the sample position could be accurately found during the observations. Subsequently, the sample tray was placed in the sample chamber, which was sealed and vacuumed. The electron valve was turned on after the sample chamber was fully evacuated, such that it emits electrons. An image of the sample was fed into the microscope when the electron beam was incident on the sample. Thereafter, a coarse adjustment was performed. The multiplier was turned on after the sample increased the magnification. The observations were performed on the samples subjected to 30 days of static and alternating loads, Figures 7 and 8 show the microcrack morphologies of the sample subjected to alternating loads.

Formation of pitting corrosion under an alternating load (300× magnification).

Crack propagation pattern under an alternating load (3000× magnification).
The Color Indicator function was used to measure the chroma level of the pitting centers and their boundaries in the 300× magnified images of samples corroded over 30 days. All the chroma levels had values below 110 defined as pits. The chroma level distribution histogram was derived from these measurements. Moreover, the pit density was calculated using statistical distributions. The vertical axis was the frequency of the appearance of some gray levels (i.e. the number of pixels with this gray level), whereas the horizontal axis was the chroma level, that varied from 0 to 255 (0 is black; 255 is white). The histogram elucidated the gray-level distribution in an image. The comparison between the 300× magnified images showed that the sample that was not stressed almost had no pitting whatsoever (Figure 9), and its corrosion density was 32.58%. The sample subjected to alternating stress had a corrosion density of 55.49% (Figure 10). Meanwhile, the sample that was subjected to static stress had a corrosion density that was somewhere between the two other cases at 40.15% (Figure 11). The standard deviation of the corrosion histogram corresponding to the stress-free case was quite large, and the histogram distribution was also relatively even. Furthermore, the frequency of its peak value was high, and the chroma level corresponding to the peak also lies above 100. The gray-level standard deviation of the statically stressed sample laid between that of the alternatingly stressed sample and the unstressed sample, as the corrosion of the steel strands accelerated under load-bearing conditions. The chroma values of the alternatingly stressed sample aggregated around its peak value, as the corrosion pits developed at an accelerated rate during the loading and unloading processes.

Corrosion histogram corresponding to no stress.
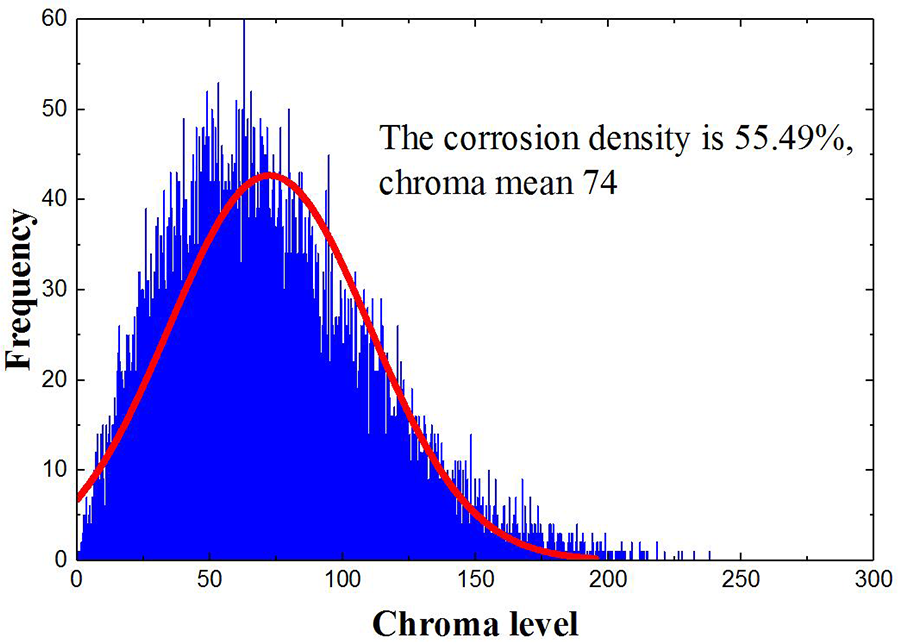
Corrosion histogram corresponding to alternating stress.
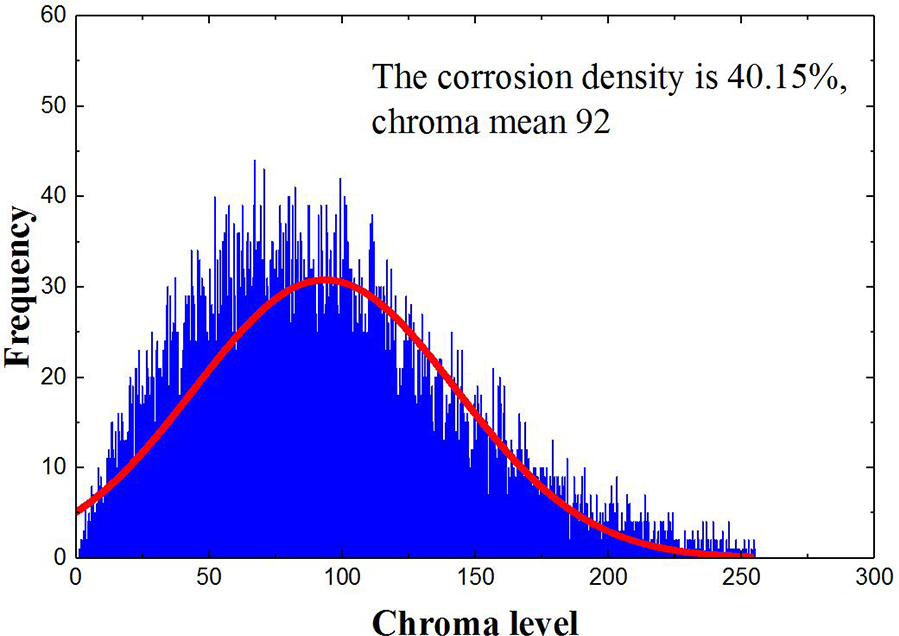
Corrosion histogram corresponding to static stress.
Analysis of the mechanical performance after corrosion
Three 1 m-long uncorroded galvanized steel strand samples were tested prior to tensile testing. The results obtained from these samples were used for comparisons with the mechanical performance data obtained from the corroded samples. Table 5 shows the test results.
Data of the static loading tests on the uncorroded galvanized steel strands.

The relationship plot between the tensile strength and the corrosion time (Figure 12(a)) showed no significant change in the tensile strengths of the samples subjected to three different stress states. This result indicated that pitting had a minimal effect on the force-bearing capacity of the stay cables during pit nucleation and expansion. However, the sample under alternating stress displayed a significant decrease in the fracture strength when the pits expanded into cracks. One of the strands only had a fracture strength of 1200 MPa or so (Figure 12(c), dotted line). These observations were attributed to the coupling of fatigue with a corrosive environment, which will accelerate the brittle fracture in the steel strands as the cyclic actions of the alternating stresses lead to the formation of slip bands on the sample surface. Microscopic notches will form on the sample surface after a certain number of alternating stress cycles. These notches cause the fracture strength of the steel strand to drastically decrease, thereby leading to premature failures in the strand during the tensile processes. The elongation after failure reflected the plastic deformation capacity of a material when failure occurred. Figure 12(b) and (d) depicts that the elongation after failure decreased as the corrosion time increased for all the three stress states. Most of the samples after the corrosion time had exceeded 360 h had an elongation after failure that was less than 4%, which was lower than that required in the specifications. The elongation after failure was the lowest for the samples subjected to alternating stress, followed by the samples under static stress. The unstressed sample had the highest elongation after failure.22,23 Therefore, the plastic deformation capacity and the fracture toughness of the galvanized steel wires or strands of stay cables will decrease when stay cables with damaged protective jackets are subjected to the coupled actions of alternating stress and a corrosive environment. This decrease accelerates the crack formation and expansion in the steel wires. For the corrosion fatigue in particular,24,25 the actions of the alternating stress will catalyze the corrosive processes. The corrosive actions of the media will further exacerbate the expansion of the fatigue cracks. The time and the location of the brittle fracture-induced failures are difficult to predict beforehand, which brings about major uncertainties in the safety and reliability assessment of stay cables. A high level of importance must be attached to this issue in the engineering sector.
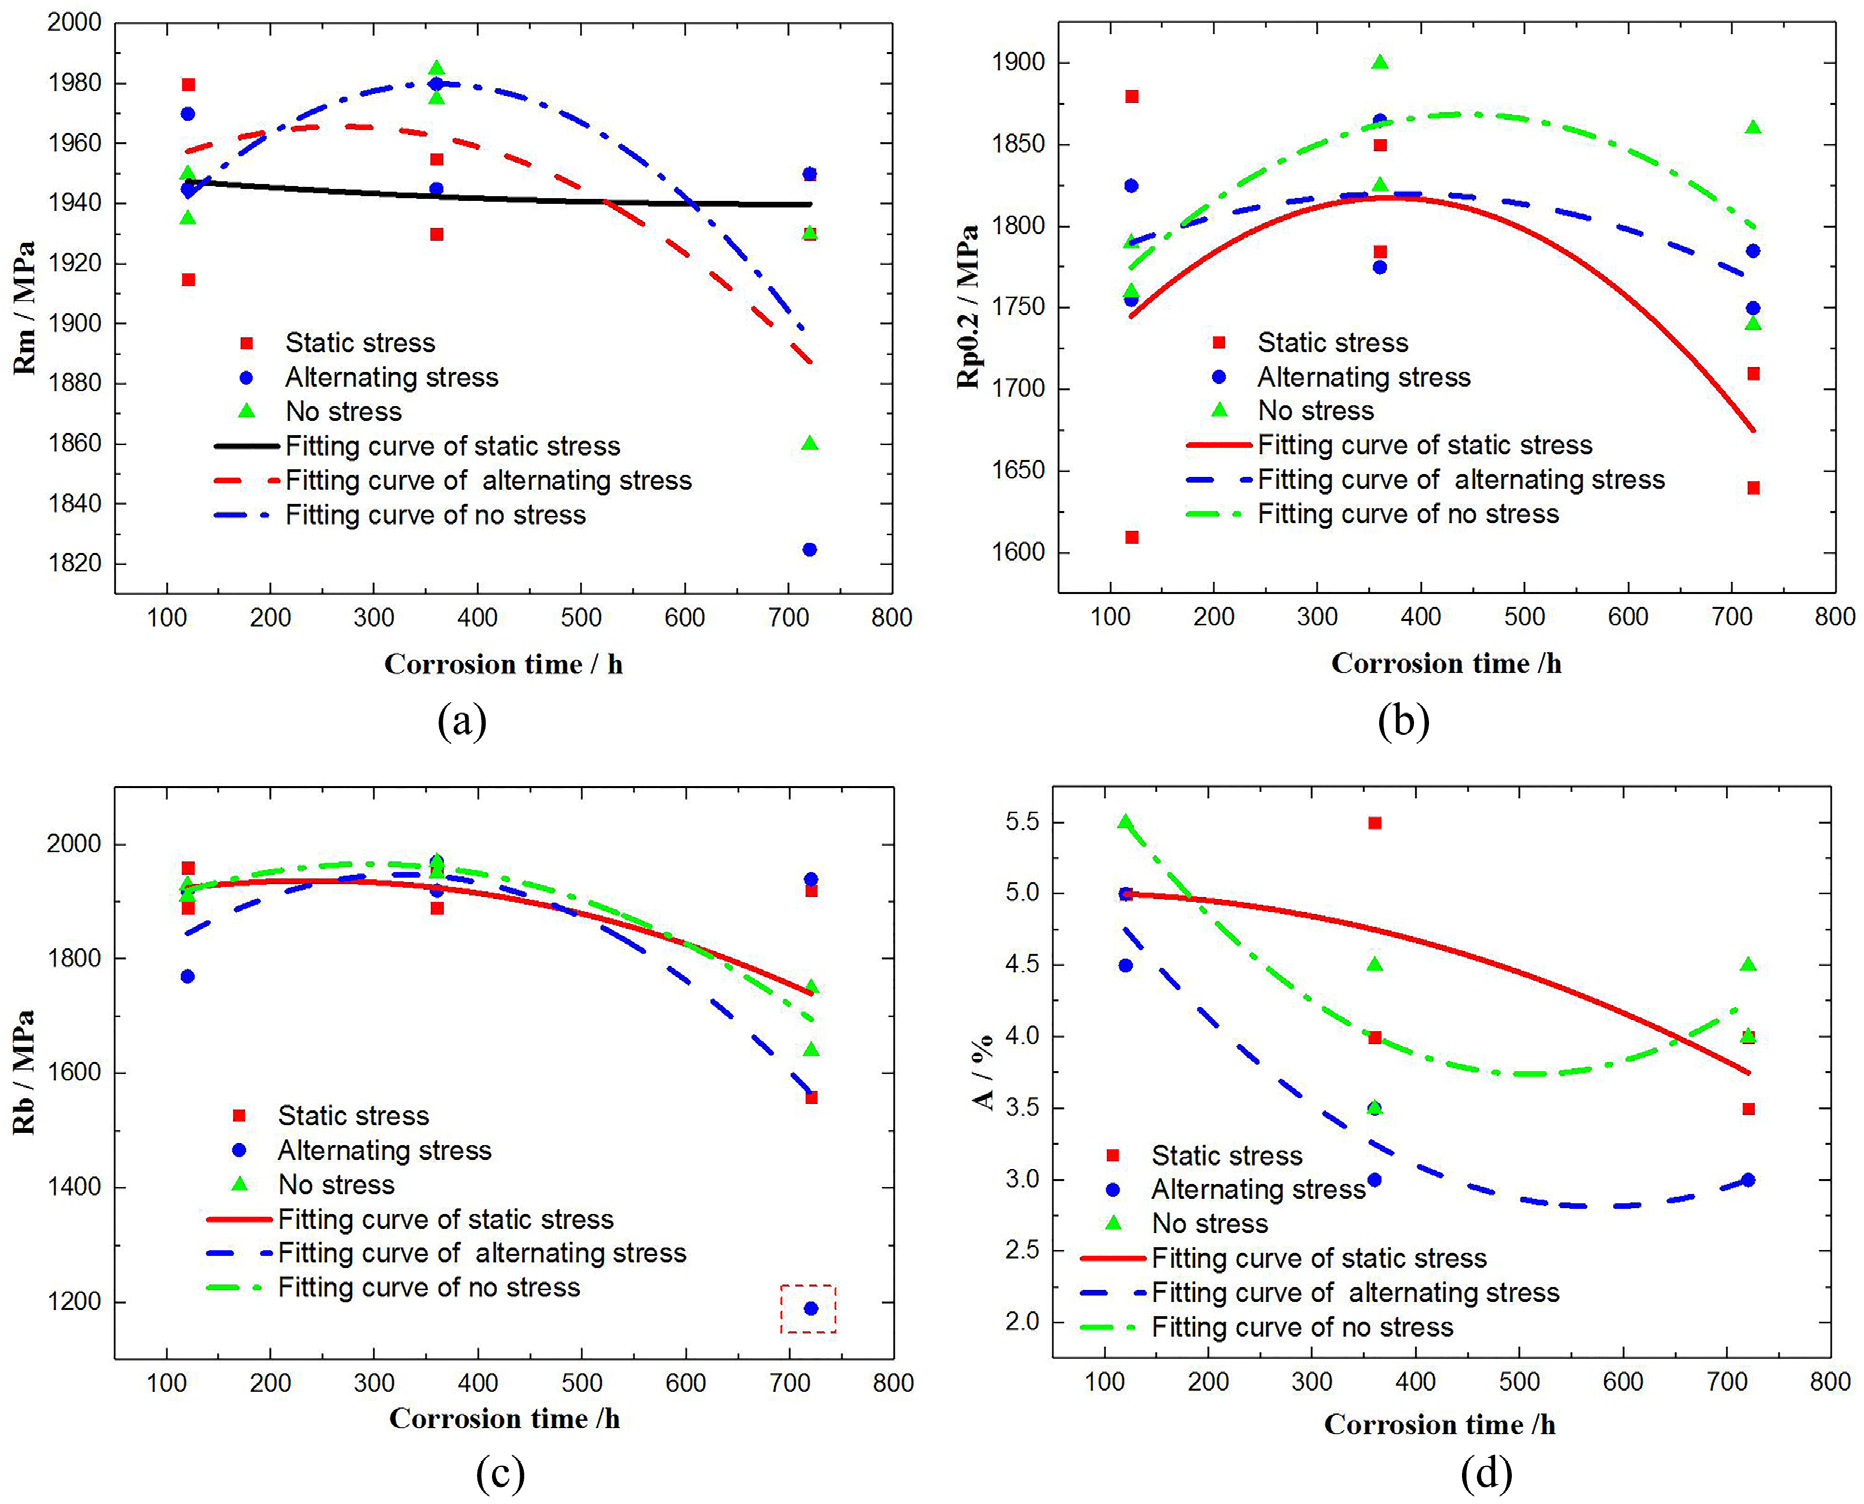
Mechanical performance parameters of the samples subjected to different loading conditions: (a) tensile strength, Rm; (b) yield strength, Rp0.2; (c) breaking strength, Rb; and (d) elongation after fracture A (%).
Conclusion
The following conclusions are drawn from this study:
The steel strands subjected to different loading conditions exhibited different corrosion levels. A sample’s surface images and corrosion damage continuously changed as the corrosion time increased. According to the corrosion features shown in these images, the degree of corrosion (given the same corrosion time) was the highest in the samples subjected to alternating stress, followed by the samples under static stress. The unstressed samples had the lowest degree of corrosion.
Three image features particularly, reflected the variations and the undulations on the corrosion surface and the degree of corrosion in a material. These features were the pitting rate, pit depth, and pit radius.
The corrosion features of the photographed images indicated that the strength values of the samples under three different stress states did not significantly change when the corrosion time ranged between 120 and 360 h. This result denoted that the pitting only had a minimal effect on the force-bearing capacity of the stay cables during pit nucleation and expansion. However, the sample subjected to alternating stress displayed a substantial decrease in fracture strength when the pits expanded into cracks (very deep cracks were found at the 720-h mark under alternating loads). Utilizing conventional damage tolerance analysis methods and software is possible in performing crack propagation life predictions by treating pits as quantizations of a crack.
Fatigue life estimation based on the corrosion images with the appropriate combination of corrosion damage levels and load-bearing capacities is a viable technical pathway. Hence, this study provides new ideas for assessing the stay cable reliability and safety by processing inspection photographs.
Footnotes
Handling Editor: Xiaotun Qiu
Declaration of conflicting interests
The author(s) declared no potential conflicts of interest with respect to the research, authorship, and/or publication of this article.
Funding
The author(s) disclosed receipt of the following financial support for the research, authorship, and/or publication of this article: This work was supported by the National Natural Science Foundation of China (51478071), Ministry of Communications and Transportation Construction Technology project (2015318814190), key project of Chongqing basic and frontier research project (cstc2015jcyjBX0022).