
Abstract
The wet clutch sliding friction process for a wet friction pair is simulated using the finite element method. Results allow examination of temperature fields and thermal deformation problems. Additionally, a test platform for wet friction joints and a temperature measurement system for wet clutch friction are established. Temperature data for a friction joint interface are analyzed. By comparing simulation results and experimental data, the distribution of radial temperature differences and circumferential temperature differences on a friction disk surface is analyzed. Results show that the maximum temperature difference appears at the outer disk diameter position, increasing and then decreasing with bonding time. In the middle and late stages of total sliding time, the maximum radial temperature difference is twice the circumferential temperature difference. That is, the radial temperature difference is a major factor in failure due to friction heat. Both the finite element simulation and the experimental results show that hot spots are uniformly distributed along the circumferential direction at each radial position of the tip of the steel sheet.
Introduction
A wet clutch is one of the key components in mechanical integrated transmission systems. Its compact structure and convenient control are widely exploited in crawler-type vehicles and large-scale engineering machinery. However, in the clutch engagement process, uneven distribution of contact pressure leads to an uneven distribution of friction contact surface temperature and a radial temperature gradient, and excessive circumferential temperature differences and radial temperature gradients lead to thermoelastic instability of the contact surface.1–4 This causes the clutch friction pair to develop hot spots and warping deformations in an early failure mode. Over time, excessively high temperature causes serious attrition of the clutch friction pair and material falls off even though it was originally sintered as one part. 5
Focusing on the phenomenon of clutch friction heat, domestic and foreign scholars have conducted extensive research on the friction coupling problem. Xu 6 used a contact thermocouple to verify clutch radial temperature differences and qualitatively concluded that high temperature is concentrated only at the average outside radius and was distributed in a circular ring. Zagrodzki and Truncone 7 established a two-dimensional numerical friction pair heat transfer model, which obtained the stress field and temperature field distribution for friction elements in a wet clutch. The influence of working oil pressure and the effect of the pressure distribution on temperature fields were thereby analyzed. Zhang et al. 8 improved the radial heat flux input model for a friction pair and simulated the transient characteristics of the temperature field and the stress field using ABAQUS finite element software. Zhao et al. 9 made use of thermoelastic instability theory to model and analyze the local high-temperature region and its influencing factors during wet clutch engagement. The influence of the friction material’s thermal conductivity and the dual-plate thickness on stability was described. Finally, Afferrante et al. 10 researched the effect of different growth rates for pressure and speed on disk temperature rise based on experimental results.
In this study, a mathematical model is established for the problem of uneven temperature field distributions in friction pairs. The finite element method is used to simulate the friction process of friction pairs, and temperature field distribution results are analyzed. Experimental methods for studying different pressures and different rotational speeds are designed. By studying the resulting experimental data, the temperature difference distribution for a dual-steel plate contact surface is obtained. Comparing the experimental results with the numerical simulation results, the characteristics of the temperature field along the radial and circumferential directions of a wet friction pair are studied. These qualities play an important role in the study of thermal failure in friction pairs.
Materials and methods
Mathematical model
Friction heat
During wet clutch operation, control oil acts on the piston and pushes on the friction joint via the piston. The friction pair is composed of a plurality of pairs of annular friction plates and dual-steel disks. A single friction pair is shown in Figure 1.

Schematic diagram of a friction pair.
Heat distribution
When the friction plate and the dual steel of the wet clutch slide are relative to each other, the amount of cooling oil along the contact surface is very small. The amount of heat absorbed by the oil can be ignored as only convective heat transfer. It is assumed that all the heat Q is absorbed by the two solid parts. The heat is distributed between two components: the dual-steel sheet for absorbing heat
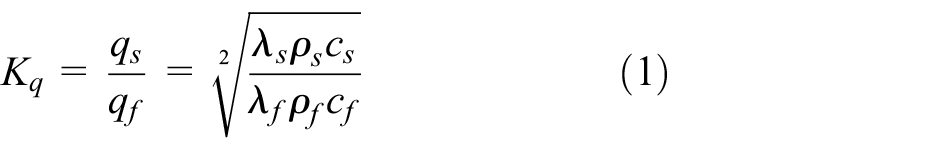
The input heat fluxes of the dual-steel sheet and friction plate are
Heat transfer model
Thermal conduction of a wet clutch friction pair is a non-steady conduction process. According to the theory of heat transfer, the heat conduction equation of friction pairs is established in rectangular coordinate system 12

where
The single-value condition of the unsteady heat transfer equation with a unique solution involves three types of thermal boundary conditions. The first type of thermal boundary condition is where the initial temperature
The thermomechanical coupled mathematical model
Because of the interaction of the elastic stress field and the temperature field in the process of wet clutch friction, the friction pair is in a nonlinear coupling state of multiple physical fields. The contact state between the dual-steel sheet and the friction surface results in an interaction with the friction heat, and temperature distribution deformation causes uneven friction deformation, thereby affecting the contact state. The contact state changes in turn affect the strength of friction heat input. Equation (2) is transformed into a finite element scheme using the Galerkin method

In equation (3), C is the heat capacity matrix, T denotes the node temperature,

In equation (4),
Taking into account the impact of temperature, the stress is

In equation (5),
Finite element model
Geometric model
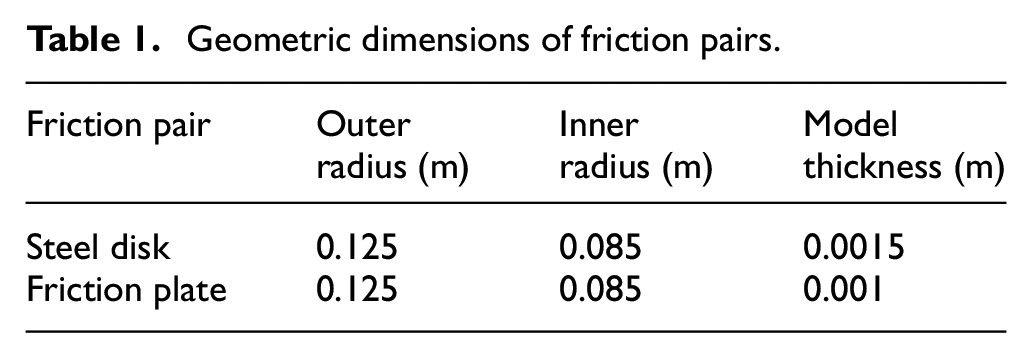
The friction plate was composed of a 65Mn core plate and a powder metallurgy layer. The dual-steel sheet material was 65Mn steel. The inner and outer radii of the friction plate were 85 and 125 mm, respectively. The thickness was 2 mm. The inner and outer radii of the dual-steel plates were 85 and 125 mm, and the thickness was 3 mm. The number of external teeth of the steel sheet was 18. In the process of clutch coupling, the structure and the load of the friction pair have axial symmetry, so only one friction pair was studied. The two sides of the disk are symmetrical in the heat transfer process of the friction plate. 13 Geometric dimensions are shown in Table 1.
Geometric dimensions of friction pairs.
Material properties
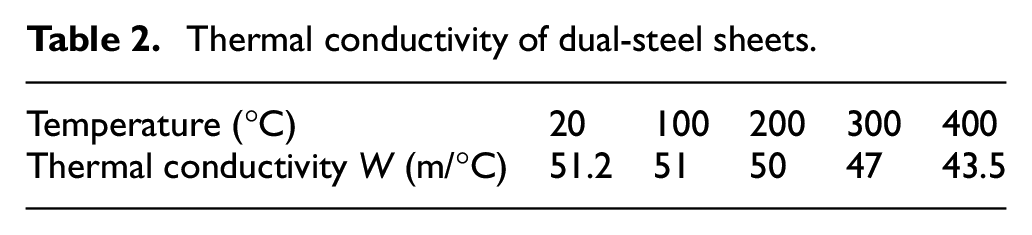
In the simulation settings, the friction material was assumed to be homogeneous. In the process of friction, the temperature rise of the friction surface was obvious. The thermal conductivity of the dual-steel sheet varied with temperature as shown in Table 2.
Thermal conductivity of dual-steel sheets.
The measured friction coefficient was about 0.13. Material properties of the friction pairs are shown in Table 3.
Material properties of friction pairs.

Boundary conditions
The meshed finite element model of friction pair constructed in ABAQUS is shown in Figure 2. The S1, S2, and S3 are the inner surface of friction plate, inner surface of steel plate, and outside surface of friction plate, respectively. The C3D8RT element is used to mesh the whole friction pair, which is the eight-node thermomechanical coupling hexahedron element. During the relative rotation process, the elastic contact problem is considered for the S1 and S2 surfaces.

Meshed finite element model of friction pair.
Movement and pressure loading conditions
The friction coupling surfaces are thermally coupled directly, and the dual-steel sheet can only move along the Z axis and in rotation. The X and Y directions of movement and rotation in four degrees of freedom were fixed. The friction plate rotated only around the Z axis. Translational degrees of freedom were fixed in the directions of X, Y, and Z, and the rotational degrees of freedom were fixed in the directions of X and Y. The bonding force of 0.7 MPa on the back of the dual-steel plate was evenly applied. After joining for 0.01 s, the pressure reached its peak value and maintained it. The initial speed of the friction plate was 700 r/min, about 72.8 rad/s, and the engagement time was 0.5 s.
Convective heat transfer
There is a cooling oil flow between the two contact surfaces of a wet clutch friction pair. It is considered that instantaneous convective heat transfer was the only process underway at each time point. There is convective heat transfer between the surface of the oil groove and the liquid. The inner and outer surfaces of the friction pairs are in contact with the air, and the convective heat transfer coefficient between the solid and air is taken as an empirical value of 5–25. The relative speed of the friction pair is not zero, and the contact surface can be seen as the cooling oil passes through the flat plate. When the Reynolds number is
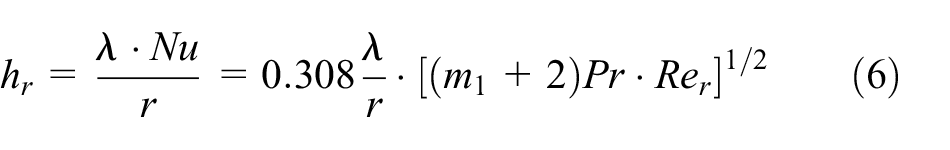
In equation (6), Pr is the Prandtl number,
The convective heat transfer of the inner and outer rings of the friction pair can be considered as the convective heat transfer of the cooling oil

In equation (7),
Table 4 shows the physical parameters of cooling oil.
Anti-wear hydraulic oil L-AN32 (40°C) properties.

Entering the above parameters into equations (6) and (7), the convective heat transfer coefficient and the relative speed of the curve are obtained as shown in Figure 3.

Convective heat transfer curve.
Experimental design and implementation
The wet clutch test bench and temperature measurement system were constructed as shown in Figure 4(a)–(d), and the temperature field distribution characteristics of clutch friction pairs were studied.

Wet clutch test bench and temperature measurement system. (a) Schematic diagram of wet clutch test bench. (b) Test bench. (c) Temperature measurement of friction pairs. (d) Temperature sensor layout diagram.
The test bench is constituted of the electric machinery, adjustable inertia, clutch test case, speed torque sensor, and signal transmission and signal conditioning module. The power input shaft of the clutch is driven by the electric machinery and the output shaft is coupled to an adjustable inertia. In the experiments, the temperatures of the steel plate are measured by K-type thermocouples with a response time of 5 ms which was arranged along the direction of the radius and along the circumferential direction. Because the wires are routed through the disk holder, the steel plate is kept stationary during the sliding period. A series of holes for thermocouples with different depths and 1 mm diameter are drilled on the mid-plane of steel plate. The effect of temperature difference on the thermal deformation of the friction pair was analyzed. Figure 4(c) shows the temperature measurement of friction pairs and Figure 4(d) shows the temperature sensor layout diagram.
Data acquisition system consists of speed, torque, oil pressure, flow, temperature and other multi-channel sensor, data acquisition board, and host computer measurement and control software components. The sensor signal is conditioned through the signal conditioning box, and collected by the acquisition card, and then stored and displayed in the host computer measurement and control software.
The loaded speed of the test bench was controlled, with the Siemens motor drive comes with software. The clutch engagement pressure was changed with the proportional valve opening changing which was adjusted by the valve voltage which is controlled by the LabVIEW program.
The pressure was 0.3–0.8 MPa, and the speed was 200–1000 r/min. Pressure was varied in increments of 0.1 MPa and speed in increments of 100 r/min in an orthogonal experimental design.
Results
Simulation
The distribution of the temperature field and stress field in the process of friction pair engagement was simulated by ABAQUS software. The results of steel sheet finite element simulation are shown in Figures 5 and 6, including the distribution of the temperature field and the stress field on the contact surface of the dual-steel plate after 0.5 s of bonding.

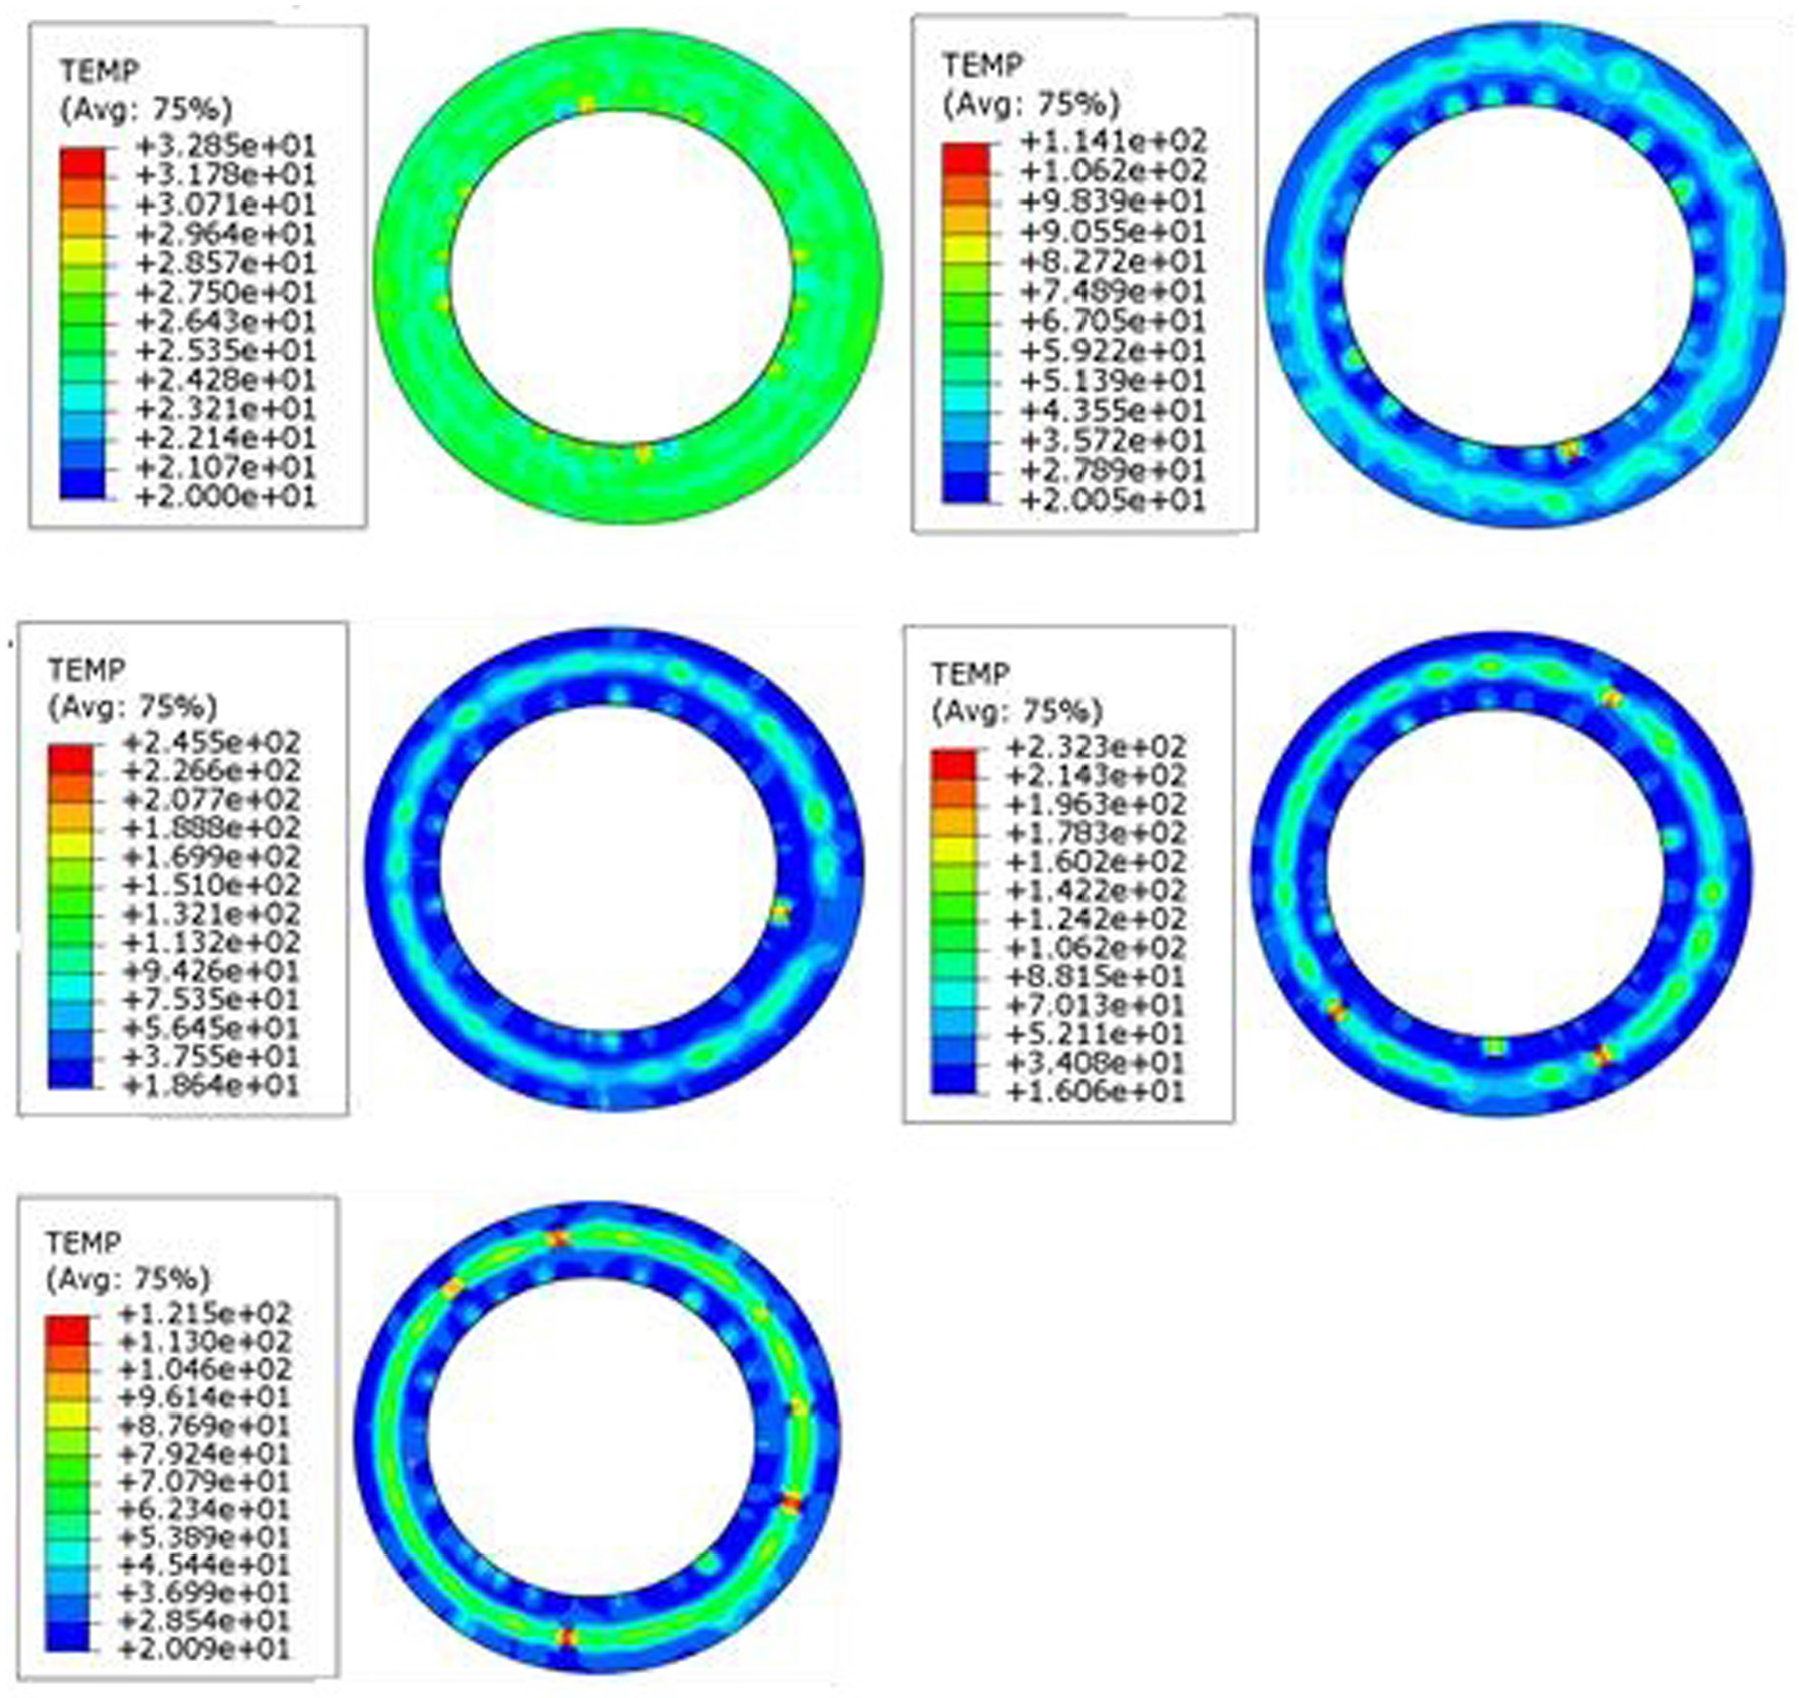
Temperature field of dual-steel sheet.
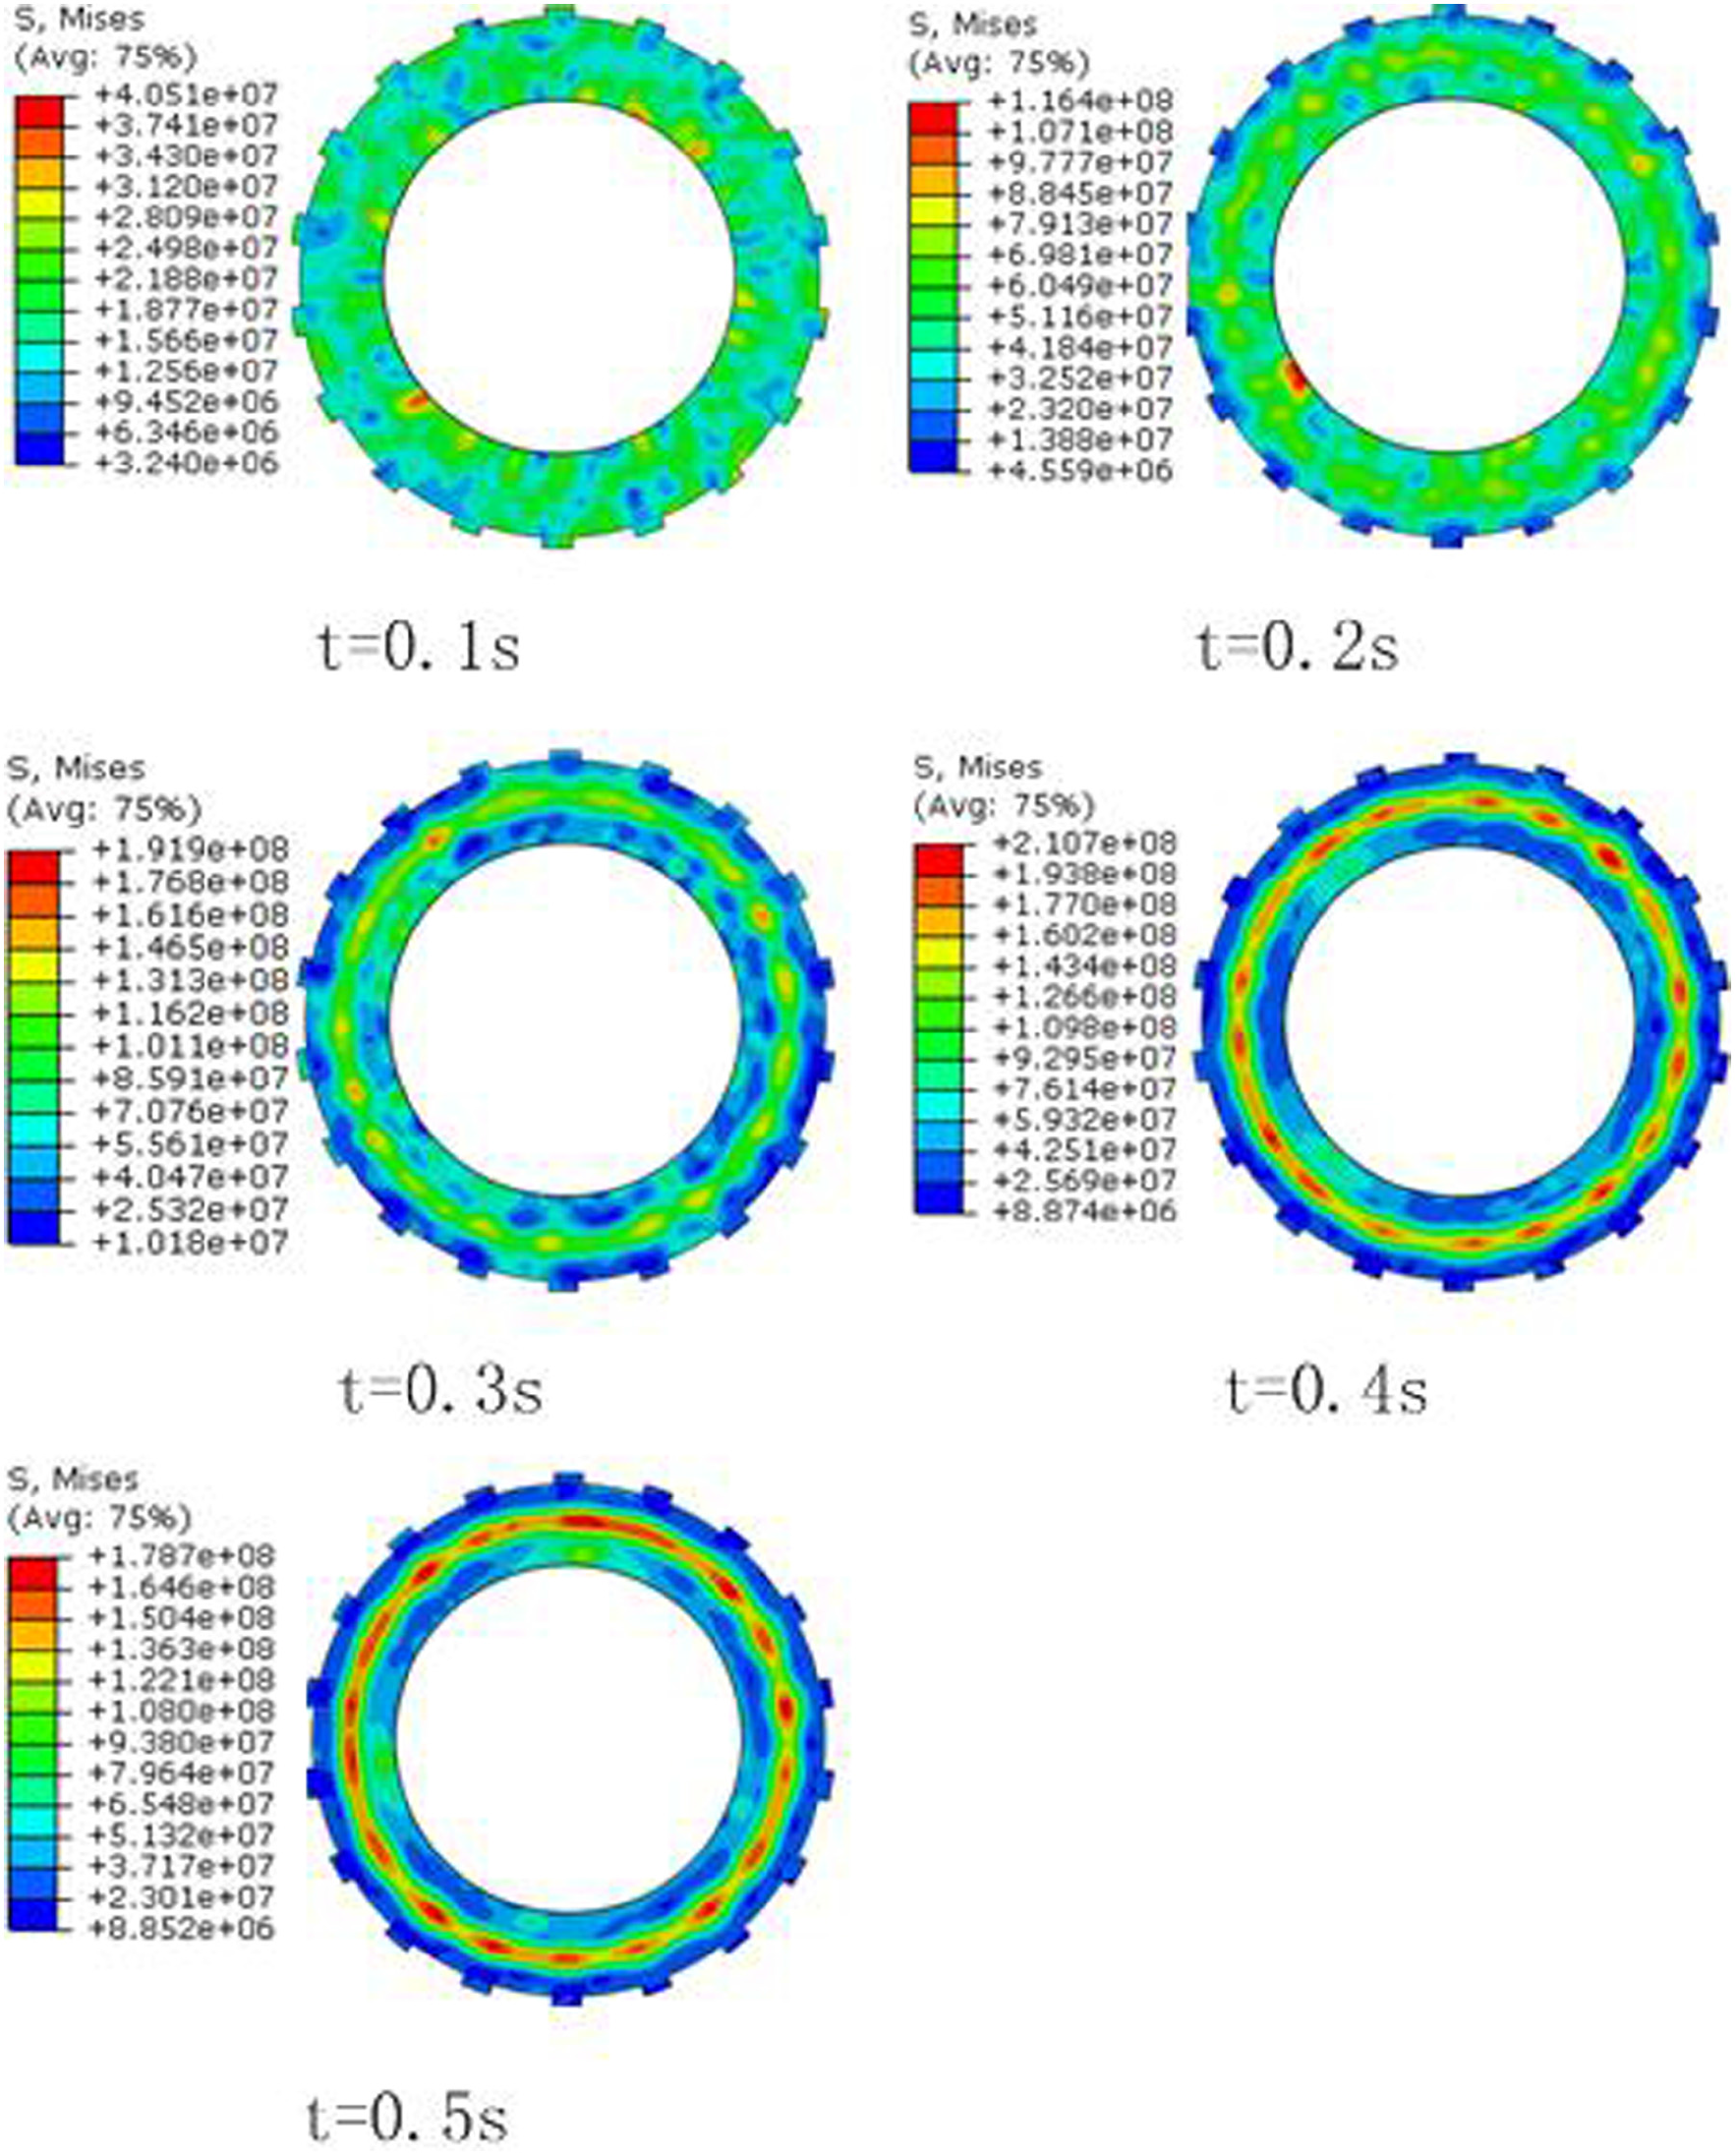
Mises stress field of dual-steel sheet.
And the results of friction plate finite element simulation are shown in Figures 7 and 8.

Mises stress field of friction plate.
Temperature field of friction plates.
Figure 9 shows the numbers 1, 2, 3, and 4 representative of the radii for the depths of 90, 98, 106, and 114 mm, respectively. Figure 10(a) and (b) shows the temperature distribution along the radius of the cogging and the tooth crown on the contact surface. Cogging and tooth crown position temperature is shown in Figure 11. The temperature curve is shown in Figure 12, while the dual-steel maximum temperature from the simulation is shown in Figure 13.
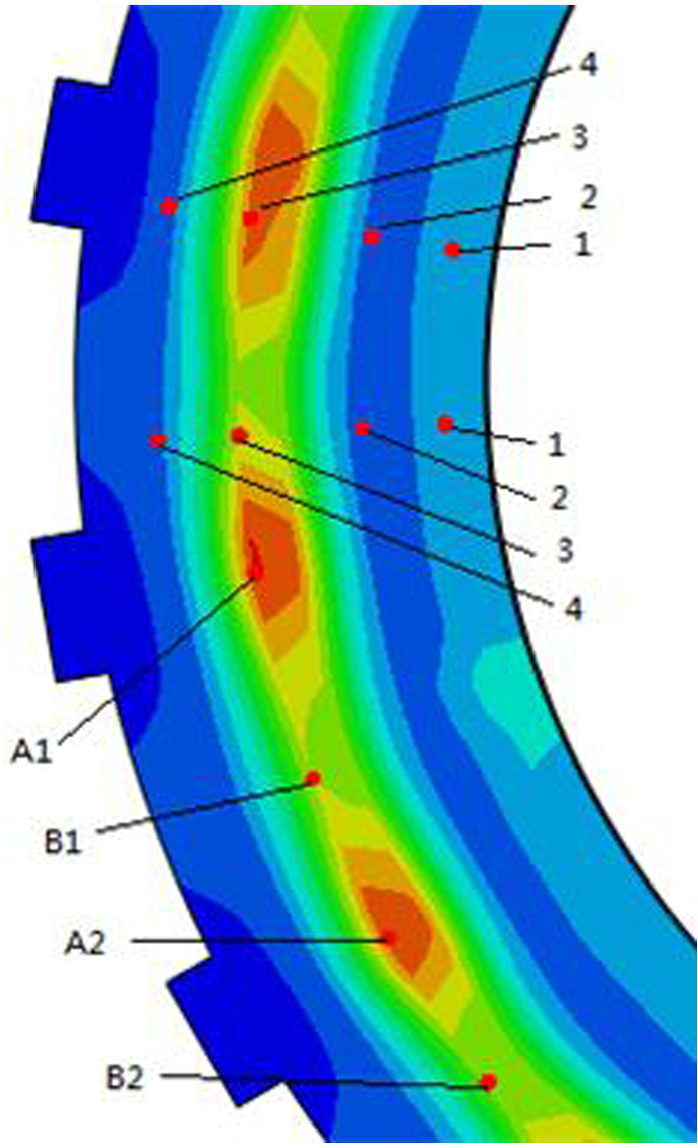
Local mark point.

Radial temperature distribution of the steel disk: (a) tooth crown and (b) cogging.

Radial temperature difference curves at 0.4 s.

Temperature curve for a radius of 106 mm.

Dual-steel 106 mm temperature difference curve.
The Mises stress curves at the radii of the tooth crown and cogging are shown in Figure 14. Mises stress values for the cogging and tooth crown at four positions in the radial direction are shown in Figure 15. The sliding time was 0.4 s, and the depth of the tooth crown and cogging stress and temperature are shown in Figure 16.

Mises stress versus time curves: (a) tooth crown and (b) cogging.

Stress values at each radius at 0.4 s.

Temperature and stress curves at each radius at 0.4 s.
Experimental
Figure 17(a) shows the radial average temperature of the dual-steel sheet, Figure 17(b) shows the 106-mm circumferential temperature, and Figure 17(c) shows the 106-mm circumferential temperature difference and the radial temperature difference. The symbols
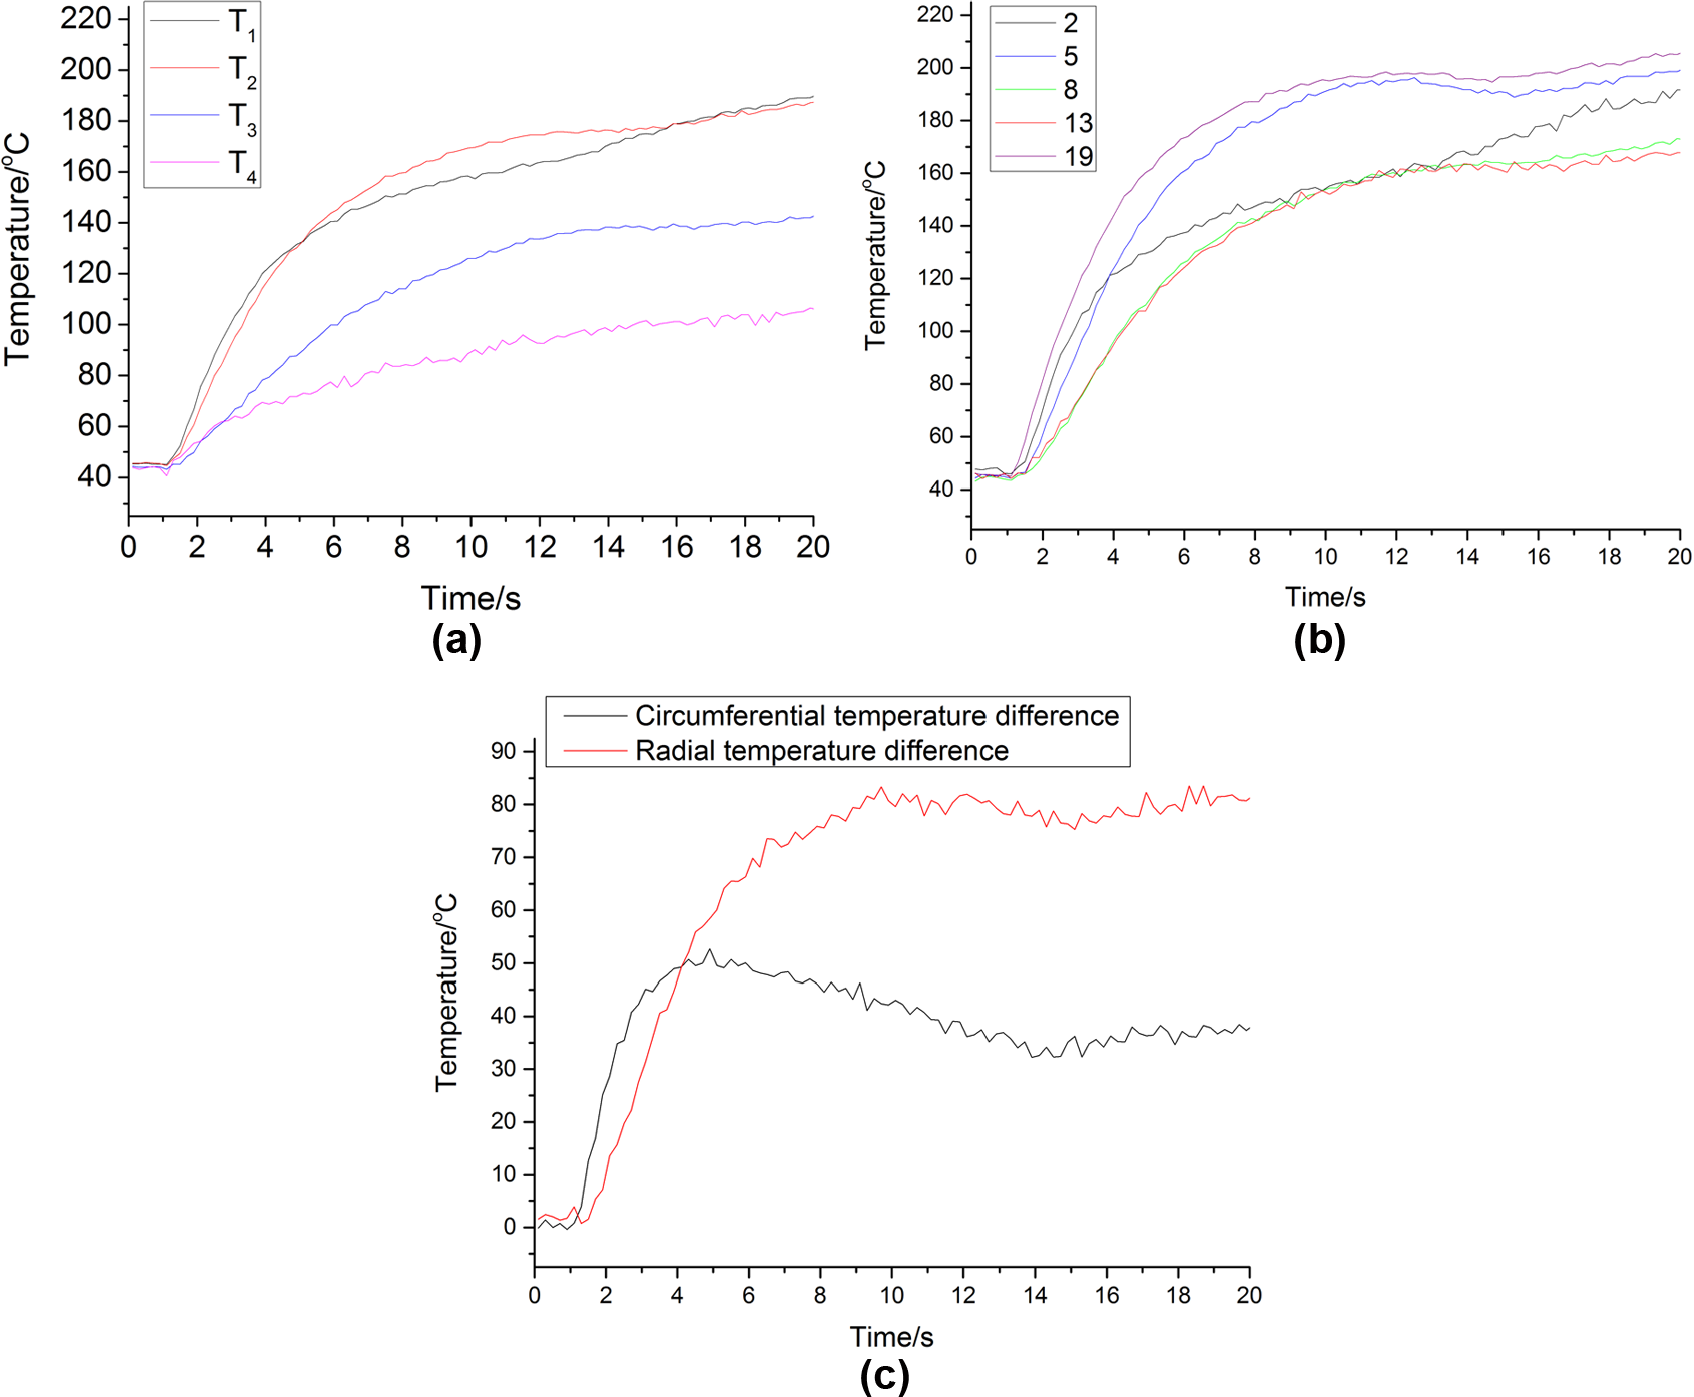
Dual-steel disk temperature profiles: (a) radial temperature curve, (b) 106-mm circumferential temperature curve, and (c) 106-mm maximum temperature difference curve.
Discussion
Simulation
As can be seen from Figures 5 and 6, mechanical stress is dominant in the initial stage of sliding friction, and no stress concentration area appears on the surface of the steel. With time, high-temperature and stress concentration areas appeared in the middle of the contact surface. Temperature and stress distributions were similar. Hot spots appeared on the surface of the dual-steel plate. High-temperature heat spots appeared below the tooth. In the process of transmission torque, the steel sheet is more likely to be deformed and destroyed owing to the high temperature and thermal elastic instability. 16 In this article, the temperature difference between the radial and circumferential directions of the dual-steel plate was analyzed.
Temperature field analysis
Radial temperature difference analysis
From Figure 10, the temperature along the radial direction first increased and then decreased, the highest cogging temperature was 133.1°C, and the tooth crown temperature was 92.8°C. The temperature at position 4 was higher than that at positions 1 and 2. When the clutch was combined, the temperature of the dual-steel sheet increased first and then decreased with time. At 0.4 s, the maximum temperature was reached. At the beginning of clutch engagement, the relatively large difference in speeds and the large heat flux made the central heat absorption insufficient to spread, resulting in a rapid temperature rise. The edge of the disk experienced convective heat transfer. The temperature rise was slow and the heat diffusion was fast, so the temperature rise was low. In the later stage, the speed difference of the friction pair decreased and the heat flux was small; the heat was diffused into the steel sheet, leading to the decrease in temperature.

At 0.4 s, the maximum heat flux was generated, resulting in a rapid temperature rise, easily generating hot spots and ablation. The steel plate temperature was analyzed at this moment. The maximum radial temperature difference appeared in the radial direction of the tooth crown. The maximum difference was
Circumferential temperature difference analysis
According to the temperature field, the maximum temperature difference appeared near the hot spot. The four points A1, B1, A2, and B2 were analyzed in the 106-mm case as shown in Figure 9. A1 and A2 correspond to the radii of the tooth crown, with B1 and B2 corresponding to the radii of cogging.
In order to better characterize the circumferential temperature difference, the mean values of two different points at the same radius were analyzed. The circumferential temperature difference is described by

By equation (9), the available dual-steel 106-mm maximum temperature curve as shown in Figure 10 indicates
The simulation results show that the maximum radial temperature difference is about twice that in the circumferential direction, and the radial temperature difference is the main factor that leads to the thermal failure of the dual-steel plate during the process of clutch combination.
Stress field analysis
Analysis of stress field with time
The combined stress is the equivalent stress accounting for both mechanical and thermal stresses. The comprehensive stress field distribution is not uniform: it is higher in the middle and lower on both sides, and there is a large stress gradient. Its distribution and temperature field are approximately the same. The maximum stress value of
Analysis of spatial distribution characteristics of the stress field
The maximum value of the composite stress was reached when the friction pair was engaged at 0.4 s. The maximum stress value of the tooth crown and cogging at the same depth was
Analysis of the stress field with the temperature field
The variation trend of stress was approximately the same as that of temperature. It increased and then decreased. The maximum value appears in the 106-mm radius, which shows that there is a strong coupling between stress and temperature in the process of friction pair combination.
Experiment
Temperature data analysis
In Figure 17(b), the numbers 2–13 represent the sensor number. It can be seen from the graph in Figure 17(a) that a high-temperature zone appeared in the center of the outer circle, and the simulation results are consistent with the results. As the clutch friction pair was in a state of sliding friction, a rise in temperature resulted. It can be seen from Figure 17(b) that the clutch starts to slide toward the end of the sliding friction time, and the maximum circumferential temperature difference appeared between 12 and 14 s, which is 80% of the total friction time. Figure 17(c) shows 106-mm circumferential temperature differences and radial temperature differences. The circumferential temperature differences were higher than the radial temperature differences in the early stage of sliding friction. The maximum circumferential temperature differences reached 51.2°C at 4 s and then decreased to 35°C–40°C. In the late stage of sliding friction, the radial temperature difference tended to be between 70°C and 85°C. The radial temperature difference was about twice that of the circumferential temperature difference, which verifies the simulation model results.
Analysis of steel surface topography
After the completion of the experiment, the case was opened for inspection, as shown in Figure 15. The friction plate and the dual-steel sheet did not exhibit obvious warpage. The dual-steel sheet had a burnt copper region in the round section and a bright spot in the inner circle. The outer side of the friction plate was more seriously affected, and the black material there may have been caused by oil overheating and carbonizing.
Comparison of experimental and simulated data
According to Figures 10 and 17, the simulation results for the friction interface temperature were consistent with the experimental results. According to the simulation results in Figure 14 and the experimental results in Figure 18, the simulation results were found to be similar to the experimental results. The radial temperature difference curves for simulation and experimental results as the maximum temperature shown in the process were shown in Figure 19. It shows that the simulation results have the same distribution trend as the experimental results.

Surface morphology of the steel sheet and friction plate.
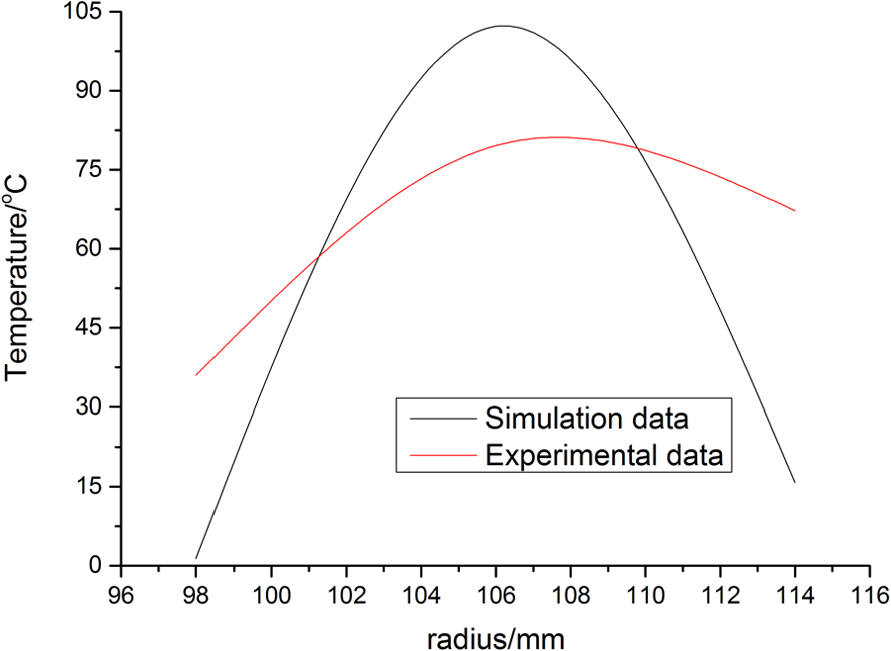
Radial temperature difference curves for simulation and experimental as the maximum temperature shown in the process.
The simulation data can be verified by comparing the experimental data with the simulation data, and the coupling relationship between stress and temperature fields can be confirmed from the simulation results. This process establishes a coupling temperature field distribution along the tip radius for high- and low-temperature characteristics of the slot radius.
Conclusion
This study presented a calculation model for heat flux density and contact area, and the wet clutch sliding friction process for a wet friction pair was simulated using the finite element method. Temperature fields and thermal deformation problems were examined based on the results of simulations and experimental measurements. Moreover, a test platform for wet friction joints and a temperature measurement system for wet clutch friction were established, and temperature data for a friction joint interface were analyzed. The following conclusions were drawn:
Combining finite element simulation and experimental measurement, it was found that the temperature and stress of the dual-steel sheet first increase and then decrease with time in the process of wet clutch friction pair engagement.
The distribution state of the disk hot spots was simulated. Hot spots appeared in the direction of the radius of the dual-steel tooth crown and formed a distribution along the circumferential direction. The hot spots were also stress concentration areas.
The difference between the radial and circumferential temperatures was analyzed. The maximum radial temperature difference was twice that of the circumferential direction, which was verified by the experimental results. The radial temperature difference was the main cause of the failure of the steel disk.
In the process of friction engagement, the stress at the node was significantly disturbed, which means that the thermal stress was not uniform during the contact process. This reflects the instability of the comprehensive stress state of the disk node.
Footnotes
Acknowledgements
Liyong Wang and Le Li conceived and designed the experiments, Hao Li performed the simulation and experiments, Le Li and Hao Li analyzed the data, Liyong Wang contributed reagents/materials/analysis tools, and Hao Li and Le Li wrote the paper.
Handling Editor: Jiin-Yuh Jang
Declaration of conflicting interests
The author(s) declared no potential conflicts of interest with respect to the research, authorship, and/or publication of this article.
Funding
The author(s) disclosed receipt of the following financial support for the research, authorship, and/or publication of this article: This work was supported by the National Natural Science Foundation of China (No. 51605035) and completed with support from the Beijing Finance Fund for Science and Technology Planning Project (No. KZ201611232032 and No. KM201611232004).