
Abstract
How to improve the accuracy and algorithm efficiency of bearing fault diagnosis has been the focus and hot topic in fault diagnosis field. Deep belief network is a typical deep learning method, which can be used to form a much higher-level abstract representation and find the distributed characteristics of data. In this article, a new method of bearing fault diagnosis is proposed based on Teager–Kaiser energy operator and the particle swarm optimization-support vector machine with deep belief network. In this method, the demodulation signal is obtained using Teager–Kaiser energy operator first. And then the time and frequency statistic characteristic of the demodulation signal is analyzed. Furthermore, the deep belief network is used to extract time and frequency feature extraction. Finally, the extracted parameters are classified by particle swarm optimization-support vector machine. The experimental results show that it not only has higher accuracy but also shortens the training time greatly, and it improves the accuracy and efficiency of fault diagnosis obviously.
Introduction
Rolling bearing is an important part of rotating machinery, and its common failure modes are wear, plastic deformation, corrosion, burn, and so on. According to statistics, most of the rotating machinery faults are caused by the failure of the rolling bearing. Faults occur in the bearings may cause fatal breakdown of machines, which may lead to personal injury and even serious accidents. Therefore, effective measures should be taken to diagnose these faults as early as possible. During the past decades, researchers have given wide attention to bearing fault diagnosis, and several methods have been adopted to conduct machinery fault identification. Traditional vibration analysis technique, such as fast Fourier transform (FFT), has been successfully applied in the fault of rotating machinery. But the method of FFT is failure to the non-stationary signal processing. Wavelet transforms (WT) and empirical mode decomposition (EMD) are excellent representatives for processing fault vibration signal. However, there is still something to be improved for these methods employed in the diagnosis of rolling bearings. WT has its drawback such as difficulty in selecting suitable basic function, where there are no standards or general rules of selection for different tasks. Similarly, as the wide scale of frequency and the costly computation of EMD, the first intrinsic mode function (IMF) is not a single characteristic component to extract failure patterns easily.
A critical technique for machine learning is extracting features from numerous measured signals. For example, support vector machine (SVM),1–4 neural networks, and gene expression programming have been employed in fault diagnosis to identify fault types. But the training of these machine learning techniques needs lots of high-quality data, and if the training samples cannot cover the testing distribution, they may be easily over fitted which would lead to a poor generalization especially for some complex classification problems. Recently, deep learning, as a new field of machine learning, has accelerated its application in pattern recognition, and has become a new platform. All kinds of deep learning algorithms, such as convolution neural network, deep neural network, and deep belief networks (DBNs; dynamic Bayesian), have been successfully applied in the field of object recognition, computer vision, and phone recognition.5–7 Furthermore, DBN, which is one of the famous unsupervised feature learning methods, has been widely studied to realize deep learning, as it has high-level representations of complex data.8–11 DBN was proposed by Hinton and Salakhutdinov. 12 It is a data multilayer perception neural network and is formed by a plurality of Restricted Boltzmann Machines (RBMs) stack formation. 13 Low level is represented by the details of the original data, and high level is represented by the characteristics of the data. DBN is able to form a much higher-level abstract representation through a combination of lower layer features and to discover the distributed characteristics of data so as to facilitate better classification and improve the accuracy of classification.
In this study, a novel hybrid model based on Teager–Kaiser energy operator (TKEO),14–16 DBN and particle swarm optimization (PSO)-SVM, 17 is presented for bearing fault detection and identification. This article is organized as follows. Next section deals with the basic principles of energy operator demodulation, which is followed by the section that explains fault diagnoses method based on DBN and PSO-SVM. In section “Application example of rolling bearing,” the experimental results show that the method is effective. Finally, conclusion is provided in the last section.
The basic principles of energy operator demodulation
A non-stationary signal with time-varying amplitude a(t) and time-varying phase

The instantaneous frequency is defined as

The energy operator

Furthermore, equation (3) can be expressed as

The change in general modulated signal is usually much slower than the change in the carrier signal.
So, a(t) and
Then, equation (4) can be expressed as

Similarly,

Instantaneous amplitude a(t) and instantaneous phase


Compared with the Hilbert transform, TKEO does not need the complex calculation, and computation of TKEO is relatively easier. The TKEO is suitable for the amplitude modulation signal with high SNR.
Fault diagnoses method based on DBN and PSO-SVM
The basic principle of DBN
DBN is a data multilayer perception neural network which is formed by a plurality of RBMs stack formation.
20
Low level is represented by the details of the original data and high level is represented by the characteristics of the data. Data pass DBN from low level to high level using abstraction gradually, which can mine essential characteristics of data deeply. Figure 1 is a DBN mode stacked by three RBMs. Every RBM is composed of visual layer (v) and hidden layer (h) and the layers are connected by weights, where the first visual layer
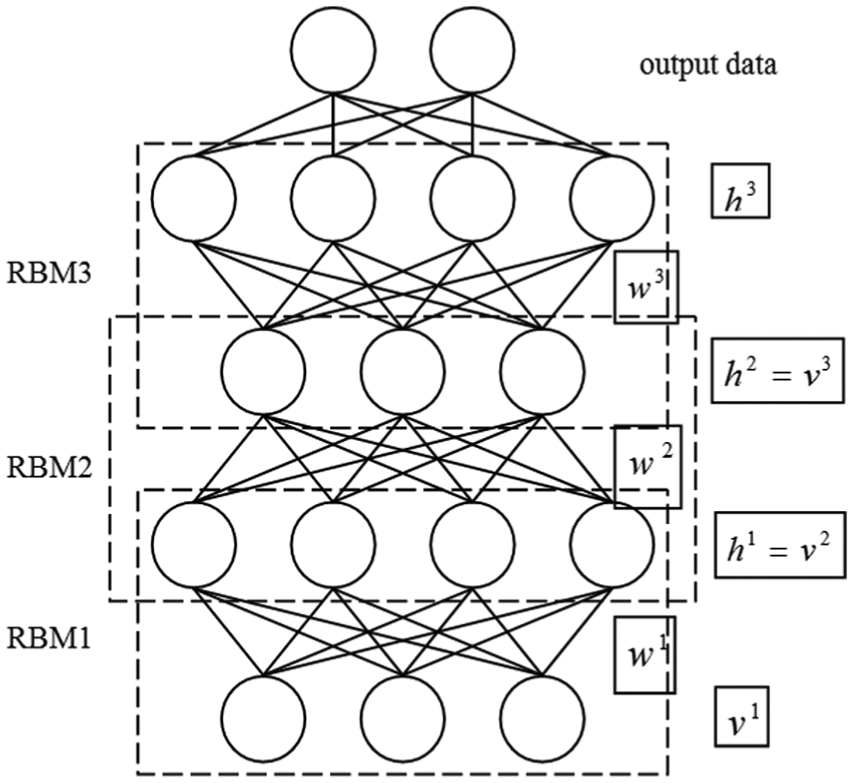
DBN mode stacked by three RBMs.
The learning process of DBN includes two parts: the forward stacked RBM learning from low layer to high layer and the backward fine-tune learning from high layer to low layer.
Forward stacked RBM learning
RBM is based on thermodynamic energy model where are a number of neurons in each layer of the grid, which are independent to each other. There are two states of activation and non-activation for those neurons, then usually is represented by binary 1 and 0. Suppose one RBM has n visual neurons and m hidden neurons, the v and h can represent the state of the visual and hidden layers,

where
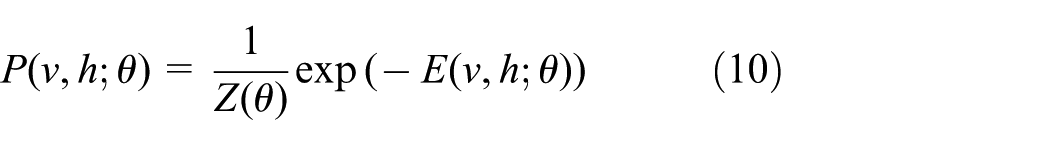

where
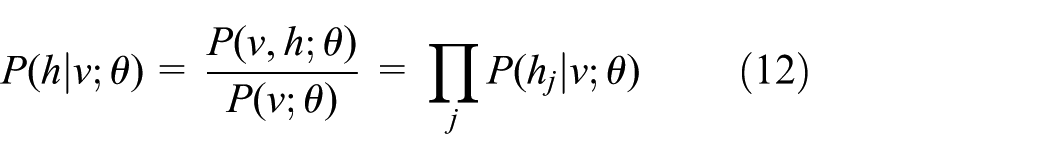

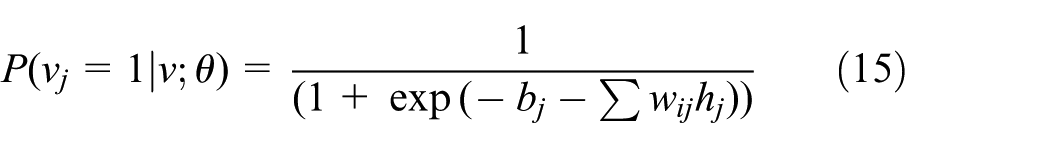
As a result of neither the visual layer nor the hidden layer exist connection, the activation function can be obtained by equations (12) and (13)

The parameter

The corresponding samples are obtained using Gibbs sampling for each training sample. Based on the derivative of the log likelihood probability


The parameter
RBM model is based on CD-K fast learning algorithm steps:
Determine the parameter training sample level S, the learning rate ε, and the number of hidden layer nodes m.
Initialization parameters. W, a, b are randomly selected smaller values.
Training data: in the t = (0,1, … k − 1) steps, successively sampling
According to the sampling value in (3) and the following equation, updating weights


Backward fine-tuning
After preprocessing of the data, the RBM in each layer is initialized, which form the initial DBN structure, and then do the backward fine-tuning training for DBN in Figure 2. Back-propagation (BP) algorithm is used to adjust entire network parameters
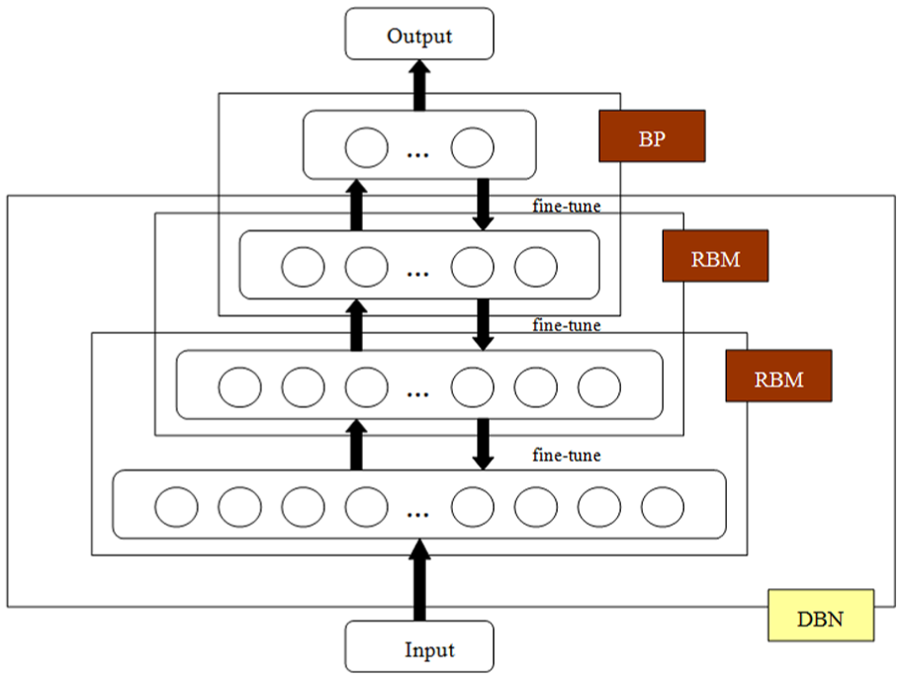
Backward fine-tuning training in DBN.
PSO-SVM algorithm
The basic principle of SVM
SVM is developed from the optimal classification surface in the case of linear separable. The basic idea can be illustrated in Figure 3. In the figure, triangles and five-pointed star represent the two types of samples. H is sorting line,

At this time, the classification interval is

Optimal classification line.
Particle swarm optimization
In practical application, the parameters selection has a great influence on the prediction results of the SVM. PSO proposed by Kennedy and Eberhart is a population-based global optimization technique and is inspired by social behavior of bird flocking or fish schooling. Due to its property of easy implementation and fast convergence with promising results, PSO algorithm is used to realize the parameters selection of classifier of SVM. The standard PSO algorithm can be based on the following equations
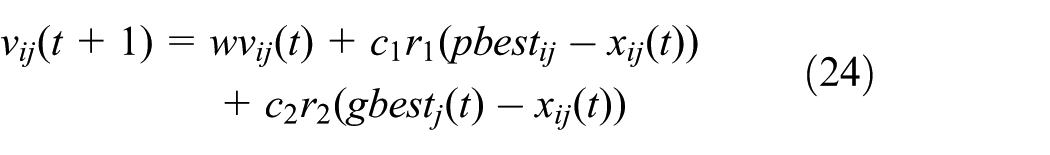

where
PSO-SVM
The unknown parameters of the SVM are set to the corresponding particle position vector X, and the PSO algorithm is used to optimize the penalty coefficient C and kernel function
The process of SVM parameters optimization with PSO is presented as follows in Figure 4:
Step 1: initialization. Generate the initial position and velocity of each particle.
Step 2: fitness evaluation. For t = 1, compute the fitness values. Fitness is the average classification accuracy of SVM classifier with k-fold cross validation. High fitness value indicates low classification error.
Step 3: update pbest and gbest according to the fitness value.
Step 4: according to equations (24) and (25) to update the position and velocity of the current particle.
Step 5: when the number of iterations or fitness condition is satisfied, the iteration is terminated; if not, it returns to step 2.

Flowchart of PSO optimized SVM parameters.
Classification method based on DBN and PSO-SVM
In this article, the time and frequency characteristic statistics of fault signal is used as input and the DBN is used for feature re-selecting. The DBN output is used as the input of PSO-SVM for fault recognition.
The sample data are pre-processed by the method of energy operator demodulation.
The time domain statistics characteristic (listed in Table 1) and the frequency domain characteristic statistics (listed in Table 2) are extracted.
For the extracted time and frequency statistic characteristic, the DBN is used for feature re-selecting.
Characteristic quantity extracted from DBN input to the PSO-SVM for fault recognition.
Time domain statistical features.

RMS: root mean square.
Frequency domain statistical features.

RMS: root mean square.
Usually, the peak value is the single peak maximum value of the vibration waveform. Peak factor can properly reflect the relative size of spikes. Root mean square (RMS) is an important index to judge whether the running state is normal in the mechanical fault diagnosis system. Kurtosis is very sensitive to the signal characteristics of impact. The normal value is about 3, if it is close to 4 or more than 4, it is shown that the impact vibration exists in the motion of the machine. If waveform factor is too large, indicating that the rolling bearing may be pitting; if it is too small, it is wear and tear. Impulse factor and crest factor are also used to detect the impact. Latitude factor is used to detect the abrasion of mechanical equipment. Frequency center mainly reflects the energy spectrum of the band focused on the location. RMS variance frequency and root variance frequency reflect the changes in the spectrum. The flowchart of the algorithm is shown in Figure 5.
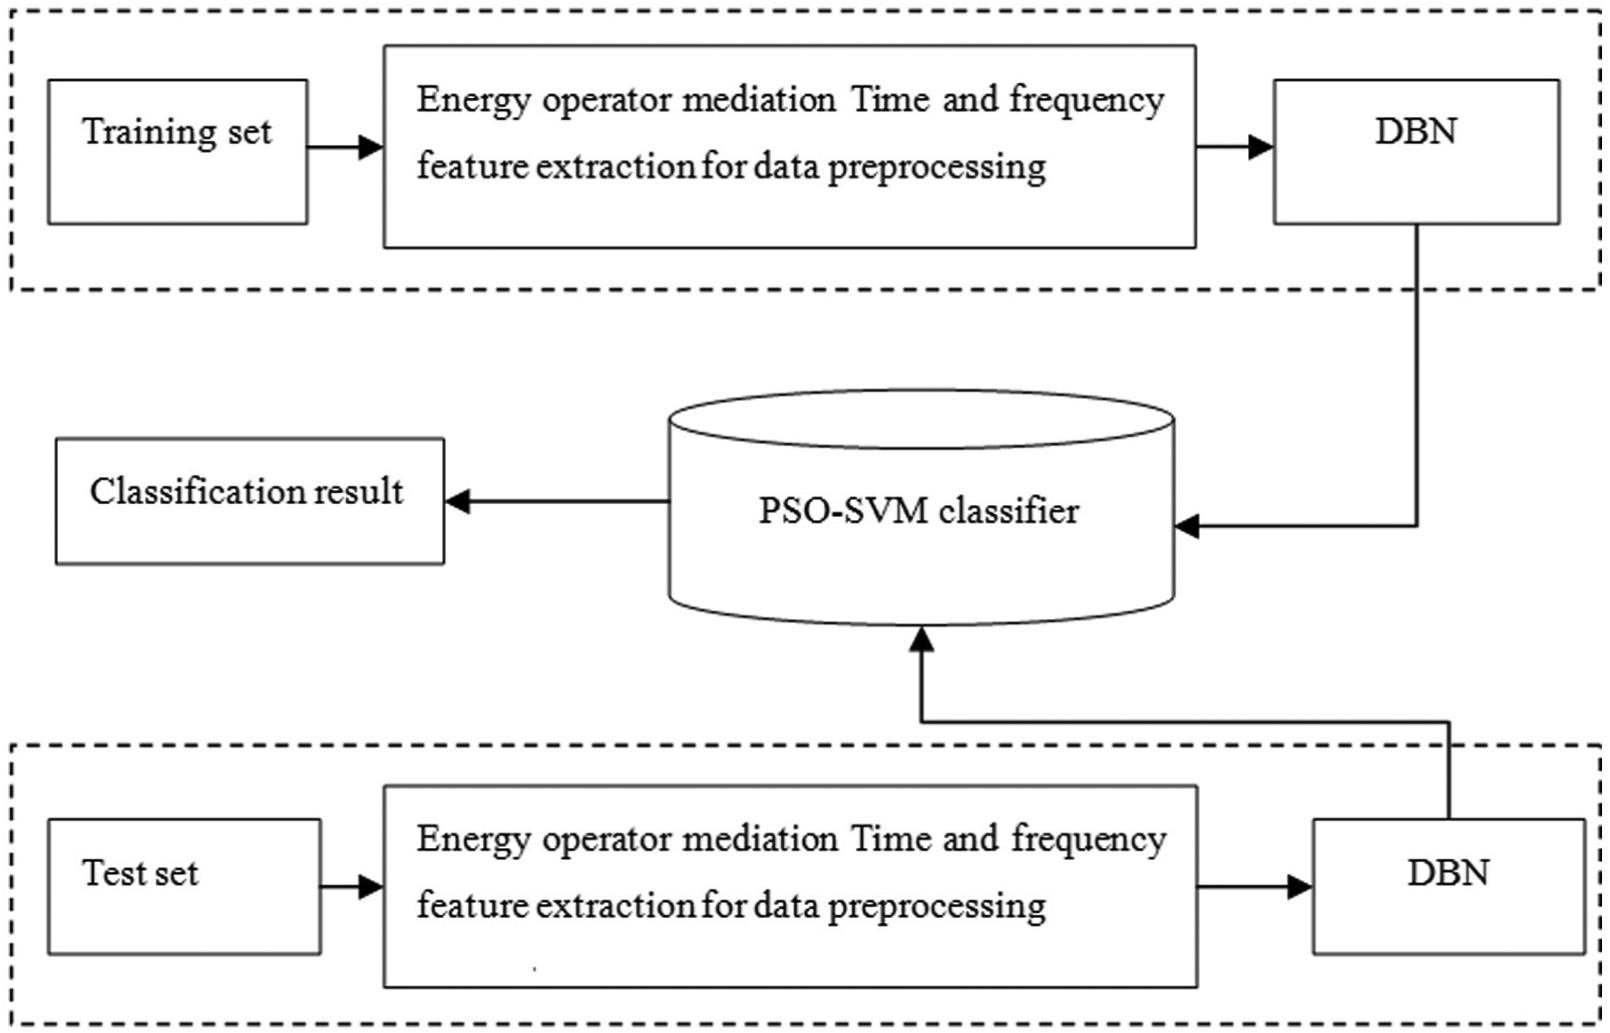
The flowchart of DBN and PSO-SVM.
The specific steps of the algorithm in Figure 5 are as follows:
Step 1. There are M bearing fault types, every kind of bearing fault conclude N groups (labeled data), as the test set.
Step 2. The test data in steps (1) is demodulated by TKEO.
Step 3. Calculate the time and frequency characteristic parameters of the data obtained in the step (2).
Step 4. The time and frequency features obtained in step (3) and labels (fault categories) are used as the input of DBN-PSO-SVM to extract features and optimize the DBN-PSO-SVM network.
Step 5. Test set a for unknown fault type, extracting time and frequency characteristics from Step 2 to Step 3.
Step 6. Input the time and frequency features of test set a to the optimized DBN-PSO-SVM to predict the fault type.
Application example of rolling bearing
We investigate rolling and fault simulation test bench in the United States Western Reserve University when the drive end bearing model is SKF6205 and the sampling frequency is 12 kHz. Single point faults were introduced to the test bearings using electro-discharge machining with fault diameters of 7, 14, and 21 mils. In this experiment, we choose the drive end bearing as the research object and the data set is shown in Table 3. There are seven kinds of fault types: normal bearing, inner ring fault (7, 14, and 21 mils), and outer ring fault (7, 14, and 21 mils). Each data set takes 500 points as a group of bearing data. Respectively, take 200 groups data, of which 100 groups is training and 100 groups is a test.
Bearing data set.

Energy operator demodulation for data preprocessing
Because the signal is affected by the noise, impact characteristic is not obvious. In order to extract the fault feature effectively, the data are preprocessed first. For example, we process the signal, 235DE (the fault signal of the outer race of the bearing drive end, and the failure frequency is 105 Hz) bearing data of the United States Western Reserve University, by the energy operator and the result is shown in Figure 6. The original signal is shown in Figure 6(a), and the instantaneous Teager energy waveform is shown in Figure 6(b). Compared with the two graphs, it is found that the periodic impulse of the original signal is not obvious, and it is obvious in the instantaneous Teager wave pattern. So, the Teager energy operator highlights the impact characteristics. The spectrum of the original signal is shown in Figure 6(c), and the spectrum of instantaneous Teager energy waveform is shown in Figure 6(d). There is no fault frequency in Figure 6(c), while we can clearly see a failure frequency and its harmonics in Figure 6(d). Therefore, the instantaneous Teager energy waveform can enhance the fault characteristics and can extract the fault characteristics of rolling bearings more accurately.
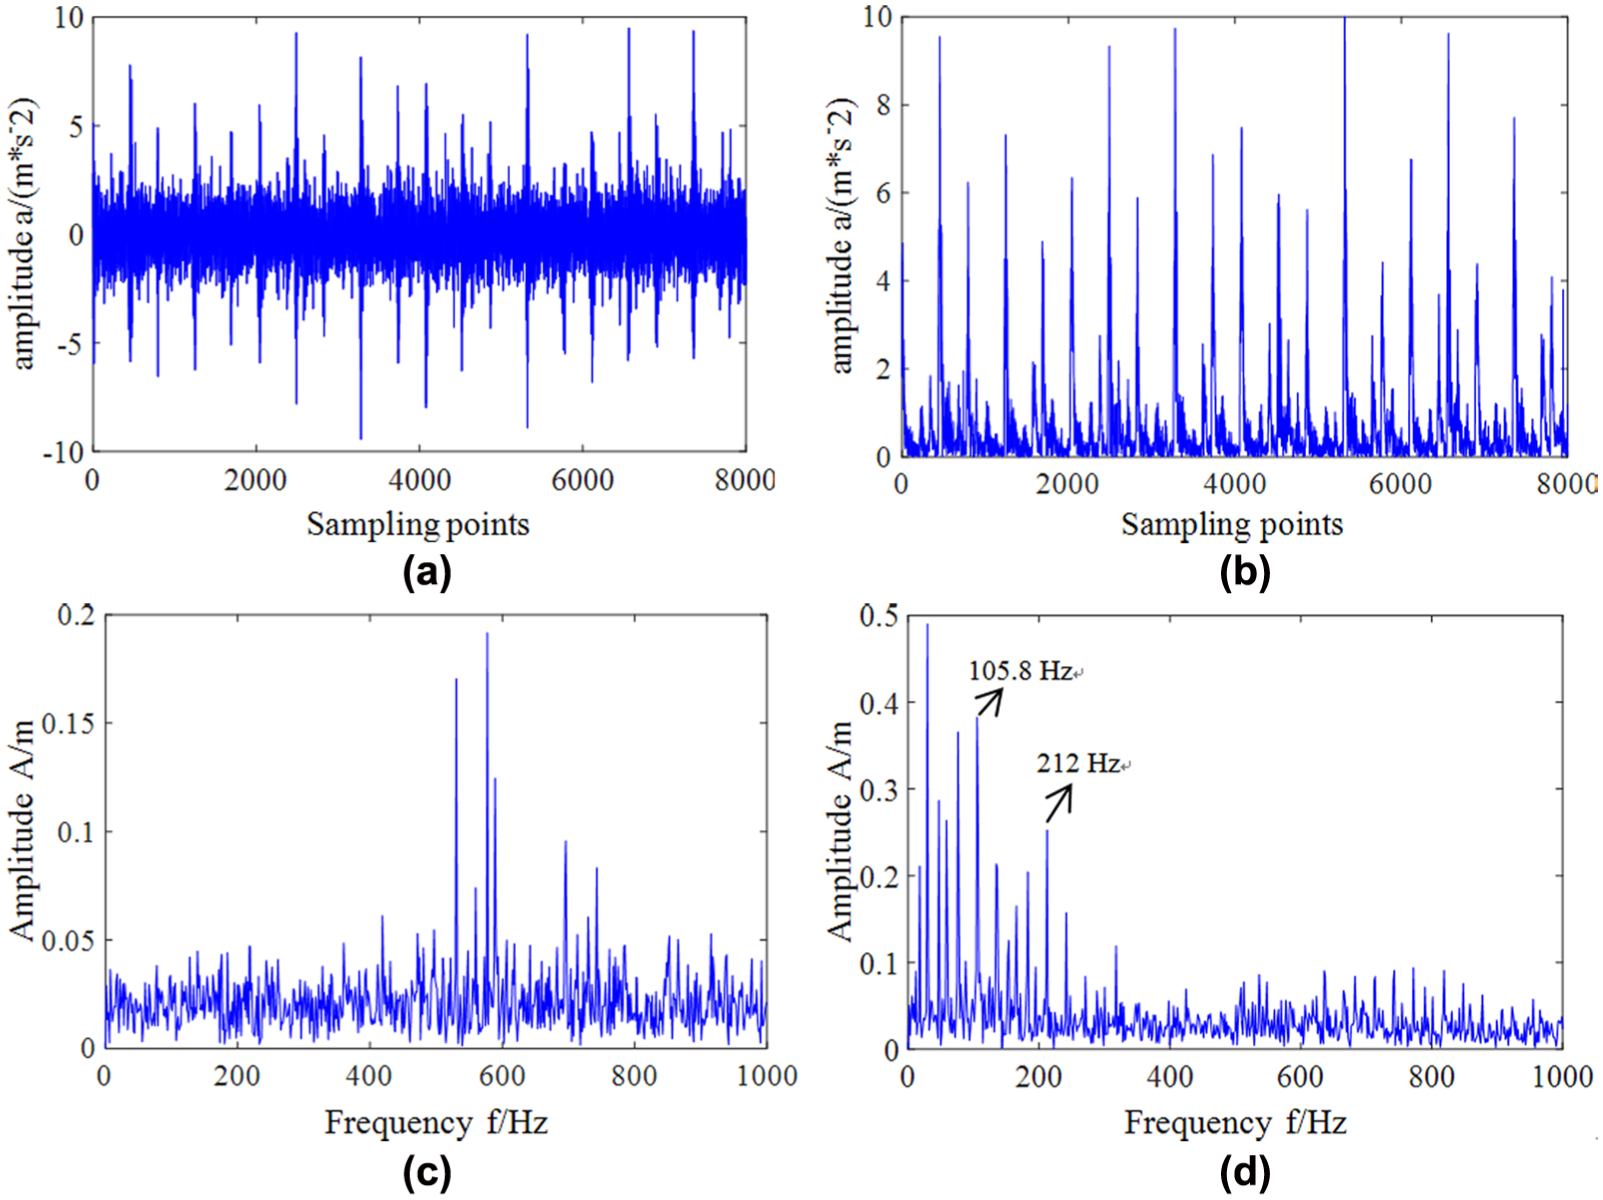
Spectra: (a) original signal, (b) instantaneous Teager energy waveform, (c) original signal, and (d) instantaneous Teager energy waveform.
The time and frequency feature extraction and DBN secondary extraction
To promote the DBN to process and improve the processing speed, the time frequency characteristic statistic of each set of data is obtained. The time and frequency statistics characteristics are imported into the DBN to extract features again. Before the grid training, to improve the network performance and shorten the training time, the parameters of the network need to be set up. The main parameters are set up as follows:
Set of hidden layers. In general, increasing the number of hidden layers can reduce the error of the grid and improve the accuracy, but it will make the grid more complex and increase the training time of the grid. In this article, through continuous tests between training time and grid error to find a better balance point. Therefore, this article adopts three layers of hidden layer design and the total network layer is five layers.
The number of nodes in hidden layers. Hidden layer nodes directly affect the training speed and generalization ability of the network. The empirical formula can be written as
Set of RBM learning rate. The learning rate determines weights change generated in training. Large learning rate leads to unstable system, and small learning rate leads to a long training time and slow convergence. Since this is the time and frequency feature statistics for secondary extraction, we do not need a lot of learning rate and only need to ensure that the system is stable, so we assign the RBM learning rate to 0.01.
Parameter initialization. Connections weights between the hidden layer and visible layer with zero mean, variance and standard deviation are normally distributed random numbers
After the parameters are set up, the time frequency statistic characteristic is entered into the DBN and the result is shown in Figure 7. In Figure 7(a), the three most sensitive features in the time and frequency characteristic statistic are displayed in three-dimensional (3D) space. In Figure 7(b), three features of DBN extracted from vibration signal are shown in the 3D space. In Figure 7(c), three features of DBN extracted from time and frequency features are shown in the 3D space. In Figure 7(a), the seven types of fault overlap together cannot be separated. The result in Figure 7(b) is better than that in Figure 7(a), while the faults cannot be recognized yet. And the faults have been shown in Figure 7(c) are clearly separated in addition to the faults types of 100 and 011. Therefore, we conclude that the method extracting feature with DBN could make features distribution in 3D space significantly better, but it still cannot completely separate the seven kinds of bearing failure.
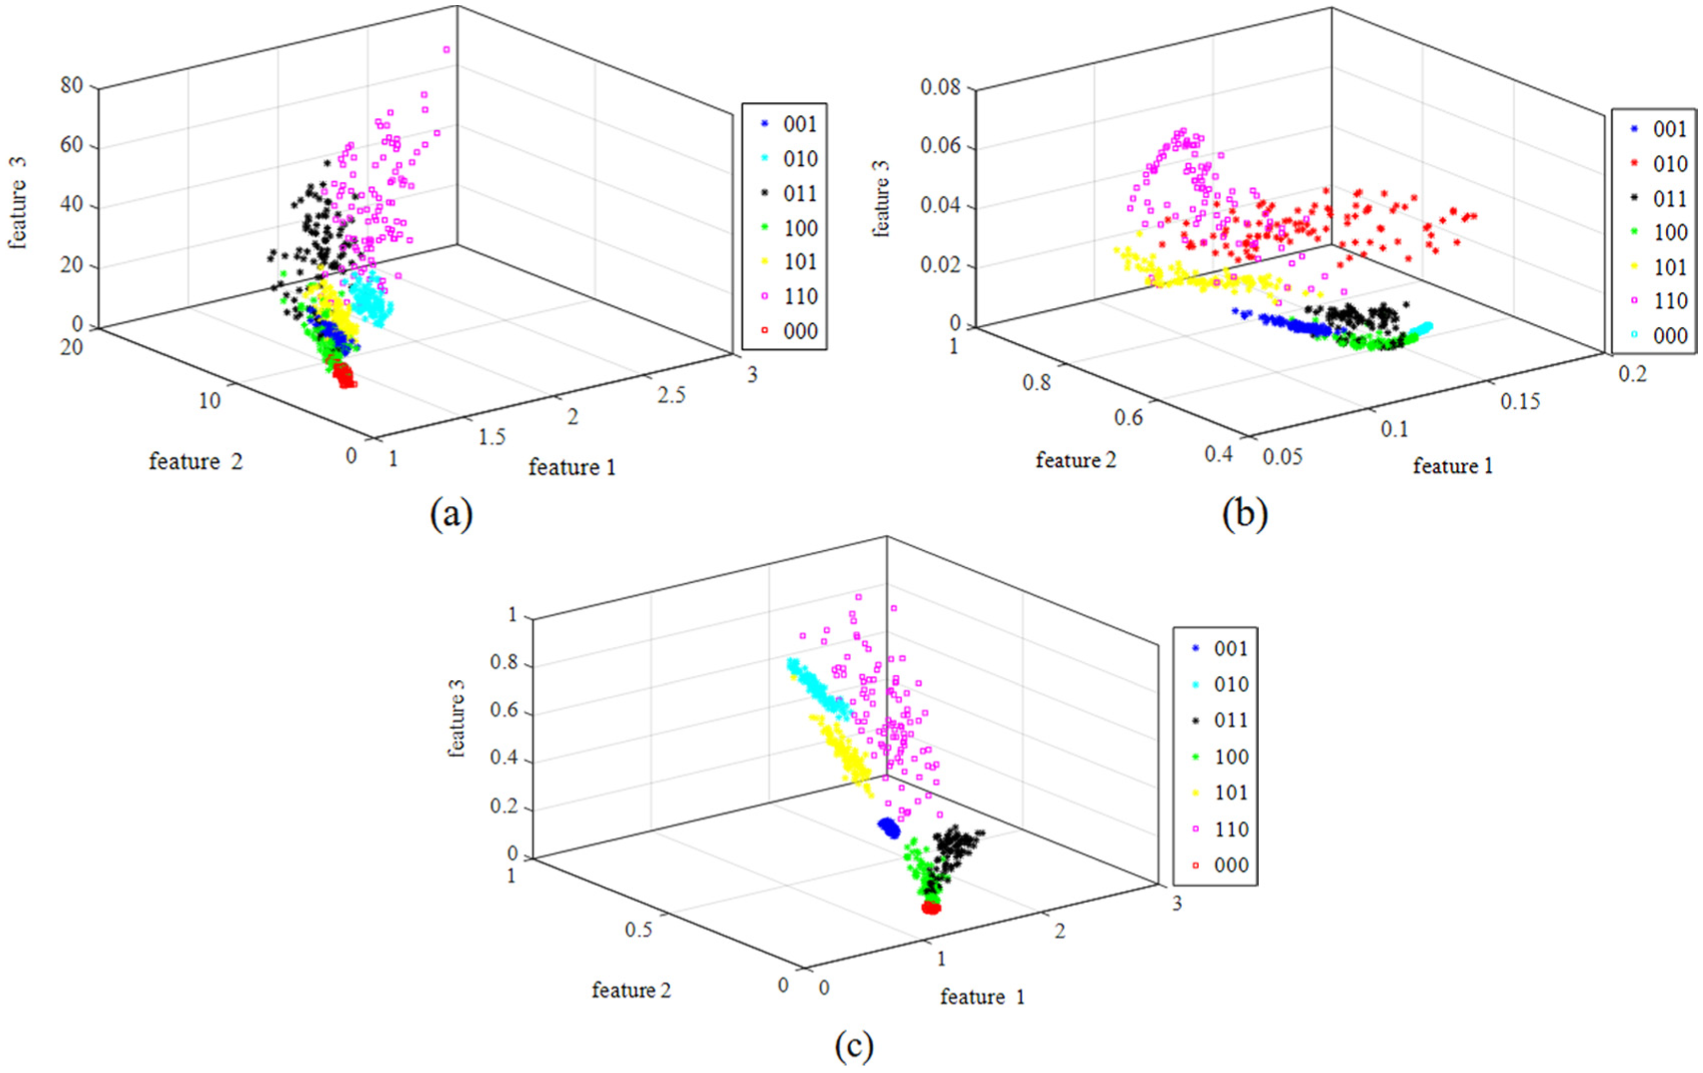
Three-dimensional graph: (a) time and frequency features, (b) features of DBN extracted from vibration signal, and (c) features of DBN extracted from time and frequency features.
PSO-SVM classification
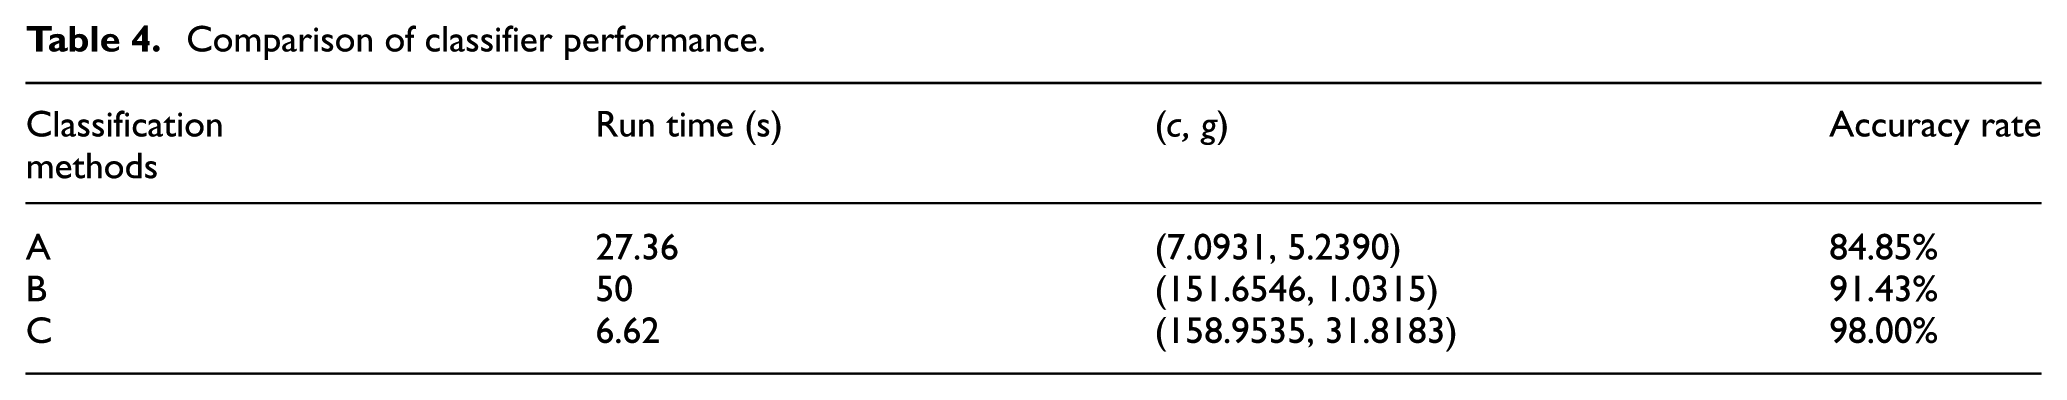
The time and frequency features and features extracted from DBN are, respectively, input to the PSO-SVM to be classified. The main parameters setting in PSO-SVM: population N = 20, iteration number is 100, learning factors c1 = 1.9, c2 = 1.7. By training, the suitability curve of the PSO-SVM is shown in Figure 8 and the classification accuracy is shown in Table 4 (A: time and frequency features as input; B: features extracted from original data with DBN as input; and C: features extracted from time and frequency features with DBN as input.) With the proposed method in this article to classify the bearing data of the Western Reserve University, we get the accuracy rate of 98%, and the accuracy improves by 13.2% and 6.6%, respectively. Through experiments, it is proved that the method proposed in this article not only has good recognition ability to the bearing fault, but also has high efficiency.

Particle swarm fitness curve: (a) time and frequency features, (b) parameters of DBN extracted from vibration signal, and (c) parameters of DBN extracted from time and frequency features.
Comparison of classifier performance.
In order to verify the performance of the algorithm further, we compared the algorithm with the following five ways to deal with features and then input the features to the PSO-SVM model. The five ways are described as follows: Way 1: original data are used as input. Way 2: Kurtosis is as input. Way 3: 13 groups time and frequency features are as input. Way 4: Feature extracted from original data with DBN. Way 5: Features extracted from time and frequency features with DBN. In Figure 9, the method in this article is used as a way of 6. The classification performance chart is shown in Figure 9. The two graphs prove that the method in this article has the best performance.
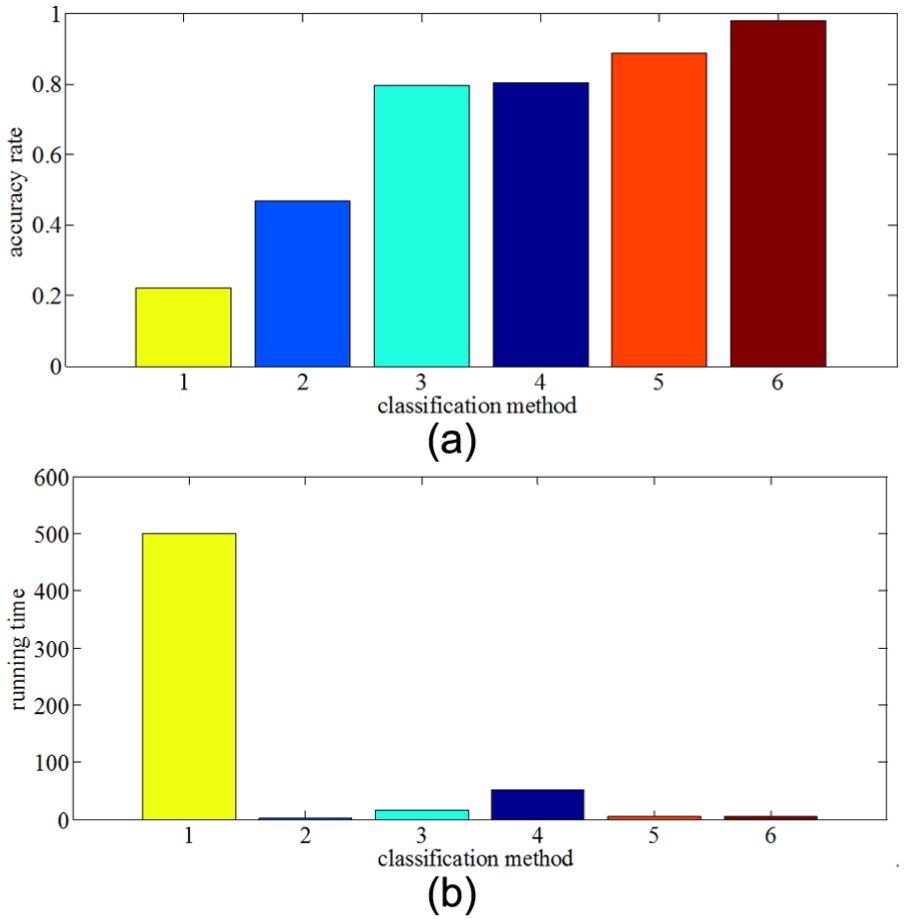
Comparison of classification performance of various methods: (a) different accuracy rate and (b) different running times.
Conclusion
This article presents a fault diagnosis method based on DBNs and SVM with energy operator demodulation. The instantaneous Teager waveform is obtained using the energy operator demodulation method and its time and frequency statistical features are acquired; DBN was used to extract features from time and frequency statistical features; and at last, the extracted features are input to PSO-SVM for fault classification.
As the input of traditional DBN is the original data and the original data are large, the running time is too long to be applied to the actual project. But with this method, it can be realized. Through the experimental study based on the data of Western Reserve University bearing, we proved that the method can classify faults quickly and accurately.
Footnotes
Handling Editor: Dong Wang
Declaration of conflicting interests
The author(s) declared no potential conflicts of interest with respect to the research, authorship, and/or publication of this article.
Funding
The author(s) disclosed receipt of the following financial support for the research, authorship, and/or publication of this article: This work was supported by the National Natural Science Foundation of China (No. 51475407), Hebei Provincial Natural Science Foundation of China (No. E2015203190), and Science and technology project of Hebei Province of China (No. 152177180).