
Abstract
With the effects of dynamic, multi-source, and uncertain features of disaster situations and information on the demand of supplies taken into consideration, this article establishes a scheduling model of a dynamic road network under road network damage conditions according to the min–max principle to make the entire ground scheduling process resemble an actual rescue scene. A scheduling model with collaborative air–ground transportation is proposed with the transport time, transportation cost, and utilization rate of the rescue aircraft taken into account. Results indicate that the model is feasible and effective under different damage degrees of road networks. An analysis of a comparative example among air transportation, road transportation, and combined air–ground transportation, shows that the combined air–ground transportation scheduling model could improve transportation efficiency and guarantee the timeliness and accuracy of rescue scheduling.
Introduction
Among the various measures for disaster resistance, rescue, and dealing with emergencies, a rescue method that combines air and ground transportation has the advantages of air transportation rescue,1,2 such as a fast response time, highly scientific and technological content, a good rescue effect, and a broad scope. Such a method also has the advantages of ground transportation rescue,3–8 such as flexible deployment, low costs, and weather resistance. Combining air and ground transportation is the most effective means of rescue and is universally adopted by many countries. However, given the dynamic, multi-source, and uncertain features of disaster situations and information on the demand of supplies, air rescue is restricted by landform, weather, and aircraft performance, while land rescue is influenced by road conditions. These factors affect emergency decision-making with regard to the distribution of multiple supplies, aircraft scheduling, and vehicle scheduling in combined air–ground transportation. A collaborative scheduling model with combined air–ground transportation can improve the efficiency and safety level of rescue operations while reducing the loss caused by emergencies.
The acquisition of dynamic demand forecasting information on the distribution of emergency supplies requires the resolution of a collaborative scheduling strategy between emergency relief materials and the transport capacity of combined air–ground transportation in this system. Current research on emergency resource scheduling problems includes static and dynamic scheduling of emergency resources; the former9–15 mainly selects the depot of this emergency operation from multiple alternative depots, determines the mobilization capacity of each depot, and then satisfies the demand for emergency resources by the largest margin. Barbarosoğlu et al. 9 addressed a two-stage random programming problem in emergency resource transport planning and constructed a helicopter-scheduling model and algorithm for emergency rescue. Özdamar et al. 10 studied multi-stage and multi-target problems in emergency rescue resource distribution and a disaster relief logistics decision support system. Liang et al. 11 adopted a new heuristic resource-constrained project scheduling algorithm to acquire a baseline scheduled plan of the rescue and help the decision-maker control the entire rescue project with high efficiency. Kusumastuti et al. 12 focused on a tsunami disaster in India and established a hierarchical model framework based on two phases, namely, before and after the disaster. This model framework included a multi-cycle maximum covered land problem, which decided the distribution sites in disaster-stricken areas, and an equipment distribution and location model; however, randomness was not assumed in the demand. Wex et al. 13 built a completion time and minimum relevant decision support model according to event severity to solve the reasonable allocation and planning problem of different rescue units. Aside from the aforementioned studies, static scheduling includes uncertain problems. For instance, Bozorgi-Amiri et al. 14 built a multi-target random programming model that included demand, supply, procurement, and transportation costs under uncertain disaster relief logistic information. This model considered uncertainty by setting a finite discrete scene rather than embodying uncertainty directly using random variables.
The combinatorial optimization problem of depots considers the static emergency resource scheduling problem. In reality, however, resource scheduling is usually implemented in multiple stages due to limited information, and the resource quantity scheduled in one stage is closely related to that scheduled in the previous stage. Therefore, a dynamic resource scheduling model16–25 has practical significance. Sheu 16 considered the above requirements, started from the prediction of future resource demand, analyzed the key influencing factors of resource scheduling, and achieved dynamic scheduling of resources. Lin et al. 17 considered a strategic scene with multiple disaster-stricken sites, vehicles, rescue cycles, soft time windows, and optimized transportation. From their findings, they proposed a multi-target integer programming model. However, this model considered already known mixed time–space demand and neglected budget restriction. These restrictive factors caused difficulty in the application of this model in actual scenes. Özdamar and Demir 18 used the hierarchical cluster and route procedure method to solve the problem of coordinating vehicle routing under large-scale distribution, evacuation, and rescue activities after a disaster. Pillac et al. 19 classified routing problems from information quality. After expounding on the general rules of dynamic routing, they proposed the concept of dynamic freedom degree and designed an effective approach to solve dynamics and uncertainty. Ferrucci et al. 20 used the Tabu Search algorithm to actively guide vehicles to regions with possible demand. They then proposed a new initiative real-time control method to deal with the dynamic vehicle routing problem. Zhang et al. 21 proposed an aviation emergency rescue framework that considers the influence of random wind at flight trajectories. The attributes in Table 1 are key elements in the algorithms used in these studies: “Core” refers to self-designed benchmarks; “Logistics” and “Routing sequence” refer to the field of rescue; “Multi-objective,”“Multi-commodity,” and “Multi-depot” refer to parameters; and “Binding with CPLEX” refers to the use of CPLEX to solve the problem.
Comparisons of the emergency logistics scheduling algorithms.

HOGCR: a hierarchical optimization guided “cluster and route” procedure.
Under combined air–ground rescue conditions, supplies and transport capacity should be collaboratively scheduled according to a dynamic change of resource demand, the distribution of aircraft and vehicle transport capacity, the dynamic topological structure of the road network formed by road network damage on ground segments, and the demand degrees for different types of supplies. Following these requirements ensures the shortest rescue time and the highest satisfaction. Most previous studies concentrated on a single mode of transportation or simplified multi-modal emergency transport scheduling models through theoretical abstraction without considering the influences of the transport capacities of aircrafts, vehicles, and road network damage on the combined air–ground transportation; thus, those previous models cannot be applied in actual emergency scheduling. In view of the flexibility of air transportation, the strong adaptability of road transportation, and with dynamic road network information under road damage condition and transport time taken as clues, a method that combines air and land transportation was proposed in this article, and a combined air–ground transportation scheduling model was built.
Combined air–ground transportation scheduling involves the following process: first, the material quantity demanded in each distribution center is inferred through the predicted material quantity demanded in each disaster-stricken site according to the division of distribution center/disaster-stricken site traffic zones. Then, the disaster-stricken site/distribution center traffic zones are divided according to the material quantity demanded in each distribution center. Afterward, aircrafts and all kinds of materials in the depot are distributed in a reasonable manner to the corresponding distribution center through the air scheduling mode. Finally, rescue supplies in the distribution center are distributed to each disaster-stricken site through the ground scheduling mode (Figure 1).

Flowchart of combined air–ground transportation.
Figure 1 shows the following: first, several traffic zones that combine depot/distribution center and distribution center/disaster-stricken sites are divided by distance, and a three-layer disaster relief network is established. Second, in view of the influence of road damage on ground scheduling, emergency traffic flow data are extracted, and a dynamic road network scheduling model under road damage conditions is constructed. Furthermore, a combined air–ground transportation scheduling model is established based on the shortest overall transport time. Finally, a combined air–ground distribution scheme is determined according to the rescue priority and material quantity demanded in each depot to complete the indirect emergency rescue and transportation scheduling mode from depots to disaster-stricken sites through distribution centers. This rescue method improves the response efficiency to natural disasters and the utilization ratio of resources in emergency rescue situations. Therefore, the contributions of this study can be summarized as follows:
The ground transportation scheduling model considers the restrictions of road damage caused by natural disasters on traffic flow, as these restrictions delay the transportation process and affect the overall scheduling result;
The combined air–ground transportation scheduling model considers the rescue priority of each disaster-stricken site, and the degree of demand satisfaction for supplies. A robust optimal path of a random time-varying road network was used to solve the model;
A method that combines air and land transportation is considered in this article to conduct uniform scheduling of aircrafts, vehicles, and materials during the emergency rescue process, and the coverage rate of the rescue network and the transportation efficiency are improved.
The remainder of this article is organized as follows: taking transport time as the clue, section “Model formulation” proposes a method that combines air and ground transportation and constructs a combined air–ground transportation scheduling model and algorithm. Section “Case study” designs a major calculated example of combined air–ground transportation, calculates the material quantity demanded in each disaster-stricken site and rescue priority, and then analyzes the scheduling result and road network damage status. Section “Comparative analysis of three modes of transportation” uses the data from section “Case study” for a comparative analysis of three scheduling schemes: air transportation, road transportation, and combined air–ground transportation. Section “Conclusion” concludes the article and suggests directions for further study.
Model formulation
This model involves a two-stage transportation mode in cities where a large-scale natural disaster happens. Emergency supplies are first transported by an aircraft from depots to the distribution center according to the material quantity needed in the disaster-stricken site and are then transported by ground vehicles from the distribution center to disaster-stricken sites. The combined air–ground transportation scheduling model is a comprehensive scheduling model that combines air and ground transportation scheduling. This model can improve the coverage rate of rescue and rescue efficiency. Given that air transportation possesses strong maneuverability and flexibility and that road transportation is strongly adaptable to schedules and low cost, a combined air–ground transportation scheduling model is established by considering the overall transport time as a clue and by combining dynamic road network information under road damage conditions.
An air transportation scheduling problem involves a distribution service from depots to the distribution center and subsequent reasonable distribution of rescue aircraft and rescue supplies. A dynamic road network scheduling problem is a process in which vehicles execute a distribution service for multiple disaster-stricken sites from the distribution center and subsequently distribute rescue vehicles and supplies in a reasonable manner. Within the divided distribution center/disaster-stricken site group, only one distribution center is present alongside several disaster-stricken sites, sufficient vehicles, and limited supplies. Vehicles are required to be reasonably arranged to transfer rescue supplies from the distribution center to disaster-stricken sites within the shortest time and to optimize the corresponding objective function when the set constraint conditions are met. An emergency rescue route is mainly determined during ground scheduling on the basis of the running time of each segment in the road network. If the operation safety and reliability of ground scheduling are guaranteed, then the route with the shortest distribution time is selected as the first choice in this emergency rescue. For a complicated road network and with full consideration of the required type and quantity of emergency rescue resources and the degree of damage along the actual road segment, the demands of different disaster-stricken sites are balanced based on the shortest overall transport time, rescue priority, and the degree of material demand satisfaction.
Assumptions, variables, and parameters
Assumptions
The data of the emergency resource distribution and demand are acquired;
One-type of vehicle provides the transportation service in the rescue operation, and the maximum capacity of the vehicle is determined;
The distance of material distribution is calculated using the Euclid linear distance formula and is equal to the vehicle running time, that is, time and distance can be converted within the same unit;
A sufficient number of rescue vehicles are available in the distribution center, and they can simultaneously distribute and depart;
Each vehicle has sufficient reserve oil and will not stop running because of oil exhaustion;
Material storage in the depot is insufficient to meet the demand in disaster-stricken sites.
Constant variables and parameters
Constant variables and parameters (Tables 2 and 3).
Model constant variables.

Model variables.

Models
The combined air–ground transportation scheduling model is divided into two major parts, namely, air transportation scheduling and ground transportation scheduling, which correspond to Plans 1 and 2 below, respectively. First, several traffic zones combine the depot/distribution center and distribution center/disaster-stricken site by distance. Materials from each depot are transported to the distribution center through the air transportation scheduling mode, and the materials in the distribution center are transported to different disaster-stricken sites through the ground transportation scheduling mode.
Plan 1
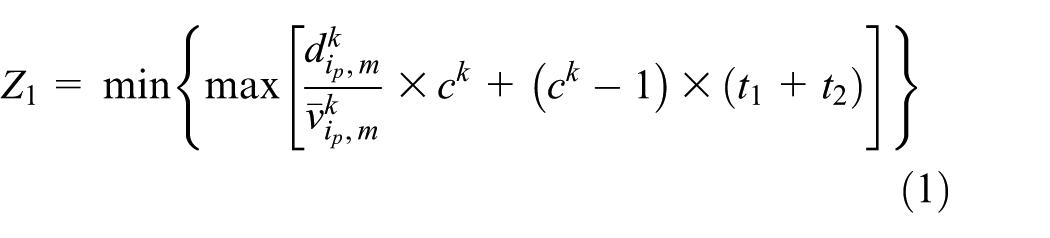
For each depot-distribution center group, within time interval t, transportation cost


Constraint conditions are


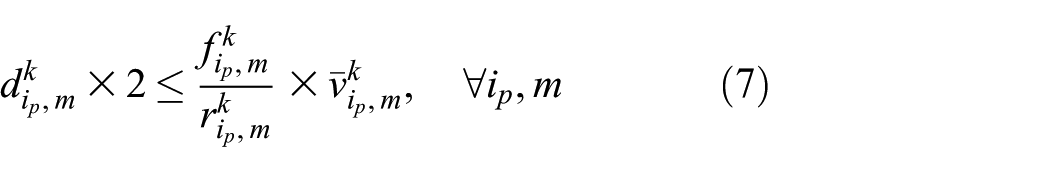


Constraint condition (4) ensures that within any time interval and for any depot, the total distributed quantity is smaller than the supplied quantity. Constraint condition (5) ensures that within a certain time interval, the total distributed quantity of each depot is smaller than or equal to the demanded quantity of the distribution center. Constraint condition (6) ensures that the total distribution mileage of any aircraft shall not exceed its maximum range. Constraint condition (8) ensures the non-negativity of the actual distributed quantity and increases the practical significance of the problem. Constraint condition (9) means that for any aircraft, the transportation frequency should be an integer greater than 1.
Plan 2
For each distribution center/disaster-stricken site group, within a given time interval t,

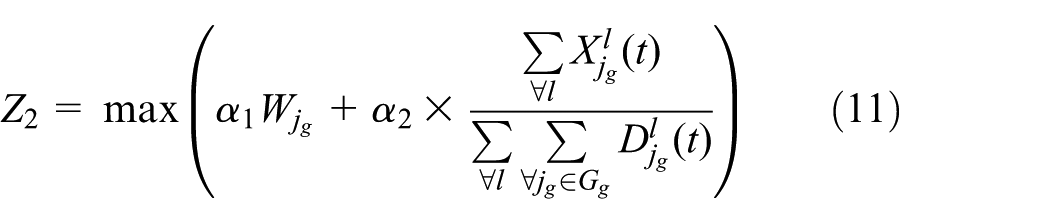
where


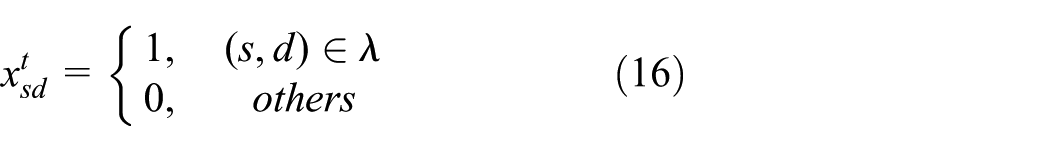

Constraint condition (12) ensures that within any time interval, the total distributed quantity of the distribution center to any disaster-stricken site is greater than or equal to the minimum demanded quantity in this site and shall not exceed its actual demanded quantity. Constraint condition (13) ensures that within any time interval, the sum of the actual distribution quantities of all disaster-stricken sites within group g shall not exceed the supplied quantity of the corresponding distribution center. Constraint condition (14) represents any integer whose set priority is from 1 to 5. Constraint condition (15) ensures the non-negativity of the actual distributed quantity and increases the practical significance of the problem. Constraint condition (16) means that road segment (s,d) in the road network is used by route λ within time interval t. Then,
Model solving
The combined air–ground transportation scheduling model comprises two parts, namely, air transportation scheduling and ground transportation scheduling. The air transportation scheduling stage mainly realizes the distribution of rescue aircrafts and relief materials, and the ground transportation scheduling stage mainly realizes the distribution of rescue vehicles and materials and the programming of the shortest distribution route. When the demanded material quantity and rescue priority of the disaster-stricken site are already known, several traffic zones that combine the depot/distribution center and distribution center/disaster-stricken site are divided by distance. The demanded material quantity of the distribution center is predicted according to the demanded material quantity and division of traffic zones of the disaster-stricken site.
Solving process of the air transportation scheduling model
Step 1: the transportation frequency scheme is determined.
First, the aircraft flight radius (the product of flight time of an aircraft full of fuel and its average flight speed on the airway route is used in this article to express
Step 2: the final transportation frequency is determined.
One, multiple, or no scheduling schemes of aircraft transportation frequency may have been obtained through step 1. If no
Step 3: relief materials are distributed.
Considering that relief material
For other depot/distribution center traffic zones, the corresponding air transportation scheduling schemes can be solved according to the above steps.
Solving process of the ground transportation scheduling model
Step 1: the road network information is extracted.
Within any distribution center/disaster-stricken site traffic zone, relative positions between the distribution center and disaster-stricken sites are determined, distances among road segments in the road network are measured, and travel time
Step 2: route programming is performed within the group.
The FHWA road impedance functional model is used to calculate time impedance
Step 3: relief materials are distributed.
Given the influence of rescue priority
For other distribution center/disaster-stricken site traffic zones, the above steps can be used to solve corresponding ground transportation scheduling schemes.
The general organization of the solving pseudocode of the solved combined air–ground transportation model is shown in Figure 2.

Diagram of the solving process of the model pseudocode.
Case study
Experimental design and data
The following calculation example is designed to verify the feasibility and effectiveness of the combined air–ground transportation scheduling model. The Sichuan earthquake case acquired from the National Earthquake Scientific Data Sharing Center is considered as background. Three major regions (centering on Nanchong, Yibin, and Kangding) are assumed to have been affected by this earthquake. In total, 25 counties and cities under the jurisdiction of these regions need relief. The damage degrees of the different disaster-stricken sites vary, which means that the sites require different emergency rescue services.
Eight cities (Guangyuan, Dazhou, Mianyang, Luzhou, Xichang, Chengdu, Aba, and Daocheng, all of which have airports) are selected in the low-altitude emergency rescue system as depots of this calculated example. The depot/distribution center traffic zones a, b, c… are divided by distance, and all materials of the depots within traffic zones are transported to three distribution centers (with airports) through the air transportation scheduling mode. Furthermore, with the distribution center as the starting point, traffic zones 1, 2, 3, … are divided according to distribution center/disaster-stricken sites. All materials in distribution centers within traffic zones are transported to subordinate disaster-stricken sites (without airports) through the ground transportation scheduling mode. The division of traffic zones is shown in Figure 3.
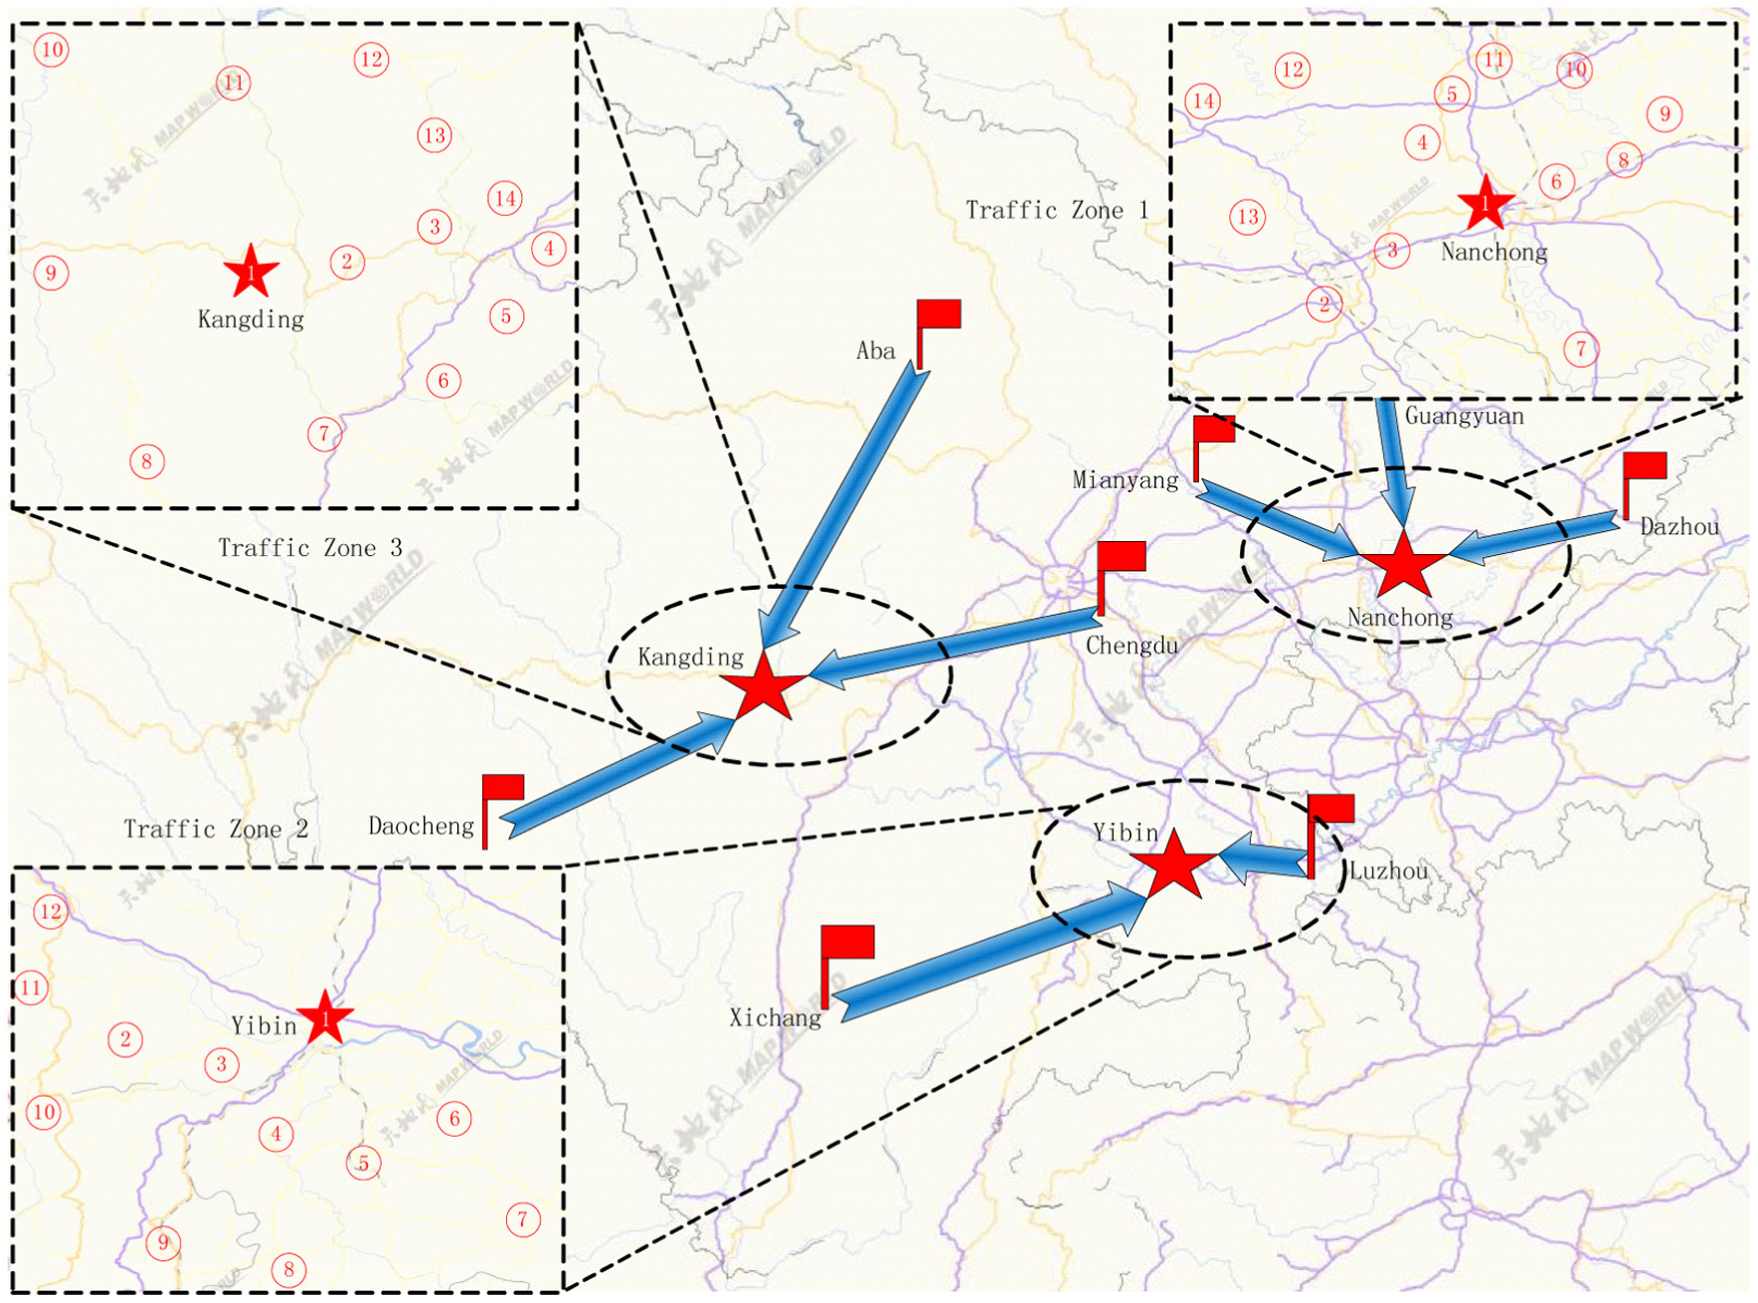
Division of traffic zones.
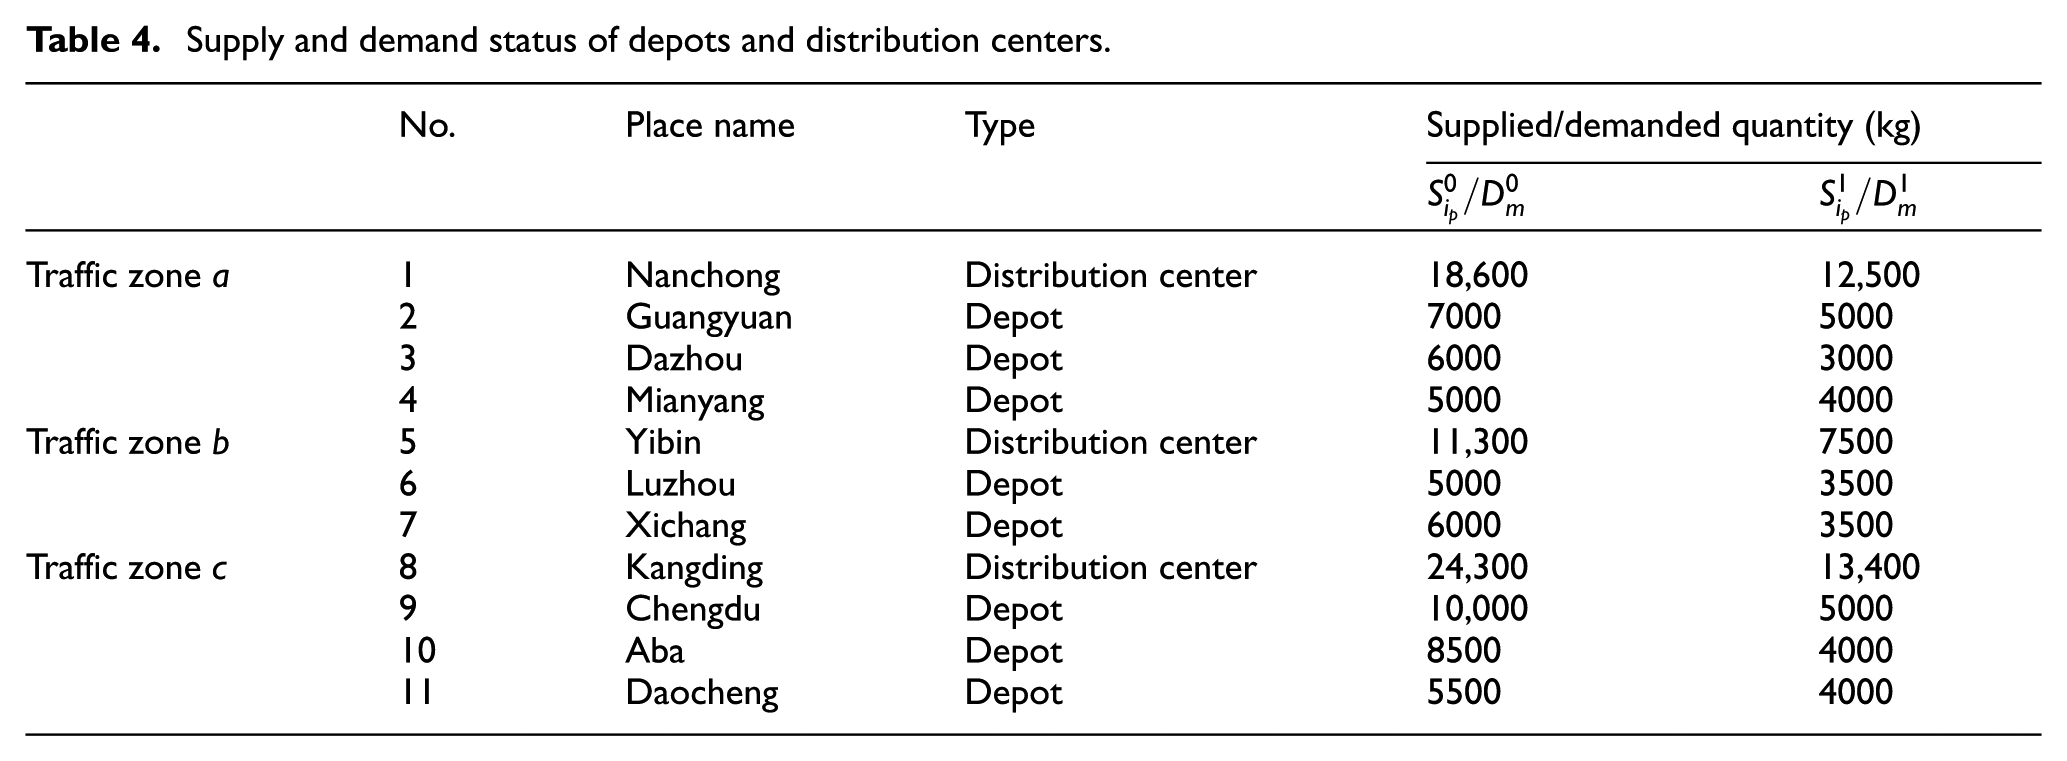
The supplied quantities of depots and demand details of distribution centers are shown in Table 4. This calculated example involves four rescue aircraft models: Mi 171, Mi 8, Y-7-100, and Y-5 B(K). The performance parameters of different aircraft models are shown in Table 5.
Supply and demand status of depots and distribution centers.
Aircraft performance.

In the distribution/disaster-stricken site group, the distribution center of traffic zone 1 is Nanchong. Its supplied quantity
Rescue status of disaster-stricken sites (traffic zone 1).

Distances from the distribution center to disaster-stricken sites, distances between disaster-stricken sites, and the traffic volume within traffic zone 1 are shown in Figure 4 (concentric circles represent disaster-stricken sites, and solid points represent road network nodes).

Distances between points and traffic volume distribution within traffic zone 1.
The distribution center within traffic zone 2 is Yibin City. Its supplied quantity
Rescue status of disaster-stricken sites (traffic zone 2).

Distances from the distribution center to disaster-stricken sites, distances between disaster-stricken sites, and traffic volume within traffic zone 2 are shown in Figure 5.
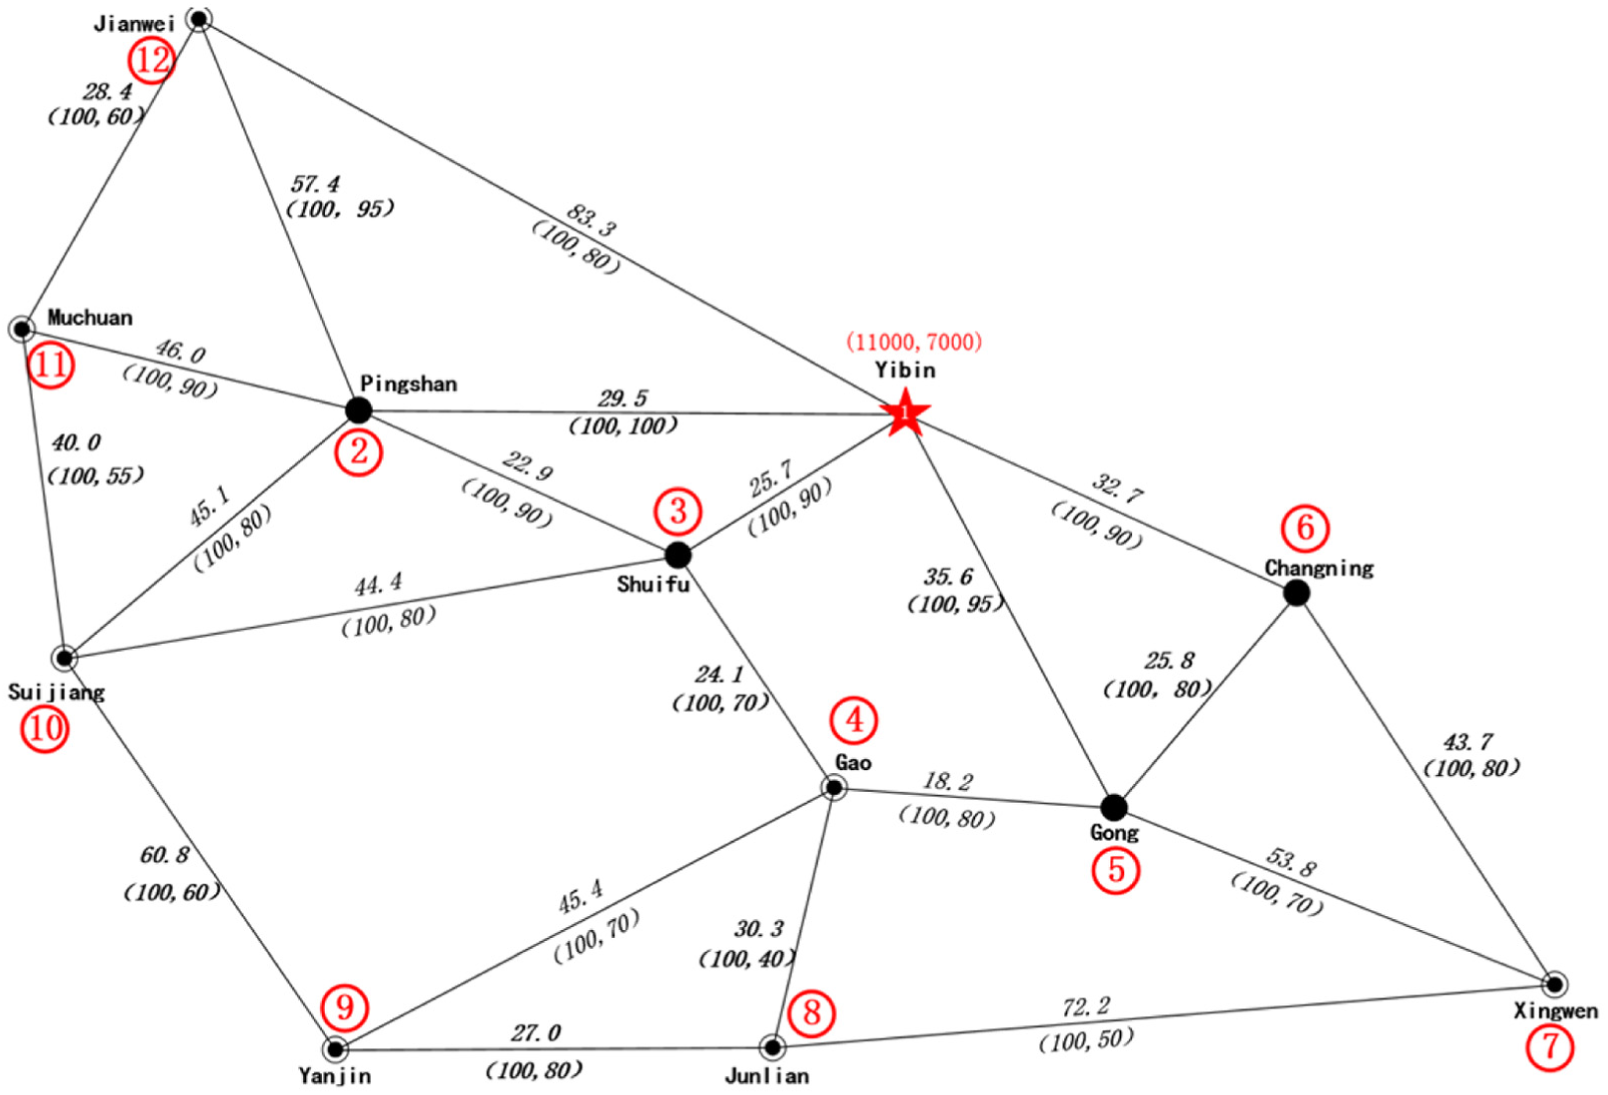
Distances between points and traffic volume distribution within traffic zone 2.
The distribution center within traffic zone 3 is Kangding. Its supplied quantity
Rescue status of disaster-stricken sites (traffic zone 3).

Distances from the distribution center to disaster-stricken sites, distances between disaster-stricken sites, and traffic volume within traffic zone 3 are shown in Figure 6.

Distances between points and traffic volume distribution within traffic zone 3.
For traffic volume distributions in Figures 4–6, the vehicle travel time in each segment can be calculated according to the road impedance model. The time impedance formula
Results
MATLAB is used to compile a multi-target program to solve the combined air–ground transportation scheduling model. The obtained air transportation scheduling results are shown in Table 9. The transport time is the longest running time spent distributing materials from the depots to the distribution center, and the aircraft utilization ratio is the ratio of the actual loading weight of the aircraft to its payload.
Air transportation scheduling results.

For different material demanded quantities (obtained by the sum of the demanded quantities of different disaster-stricken sites under the jurisdiction of the distribution center) of different distribution centers, the corresponding aircrafts are allocated to perform the distribution task. If the quantity of aircrafts is limited, then a multi-trip transportation mode can be adopted. For example, the Chengdu depot has two Mi 8 and one Y-7-100 aircrafts within traffic zone c, and storage quantities of durable goods and consumables are 10,000 and 5000 kg, respectively. Aba has two Mi 171 and one Y-7-100 aircrafts, and the storage quantities of durable goods and consumables are 8500 and 4000 kg, respectively. Daocheng has one Mi 171, one Mi 8, and two Y-5 B(K) aircrafts, and the storage quantities of durable goods and consumables are 5500 and 4000 kg, respectively. The demanded quantities of the distribution center in Kangding for durable goods and consumables are 24,000 and 13,000 kg, respectively, for a total of 37,000 kg. The air transportation scheduling results calculated through the model in Plan 1 are from Chengdu to Kangding. Two Mi 8 aircrafts simultaneously transport 5800 kg of relief materials once (either durable goods or consumables), and one Y-7-100 aircraft transports 9200 kg of relief materials twice, for a total of 15,000 kg. From Aba to Kangding, two Mi 171 aircrafts simultaneously transport 8000 kg of relief materials once, and one Y-7-100 aircraft transports 4500 kg of relief materials, for a total of 12,500 kg. From Daocheng to Kangding, one Mi 171 aircraft transports 3600 kg relief materials, one Mi 8 aircraft transports 2900 kg relief materials, and two Y-5 B(K) aircrafts transport 2000 kg of relief materials, for a total of 9500 kg. The total air transportation scheduling quantity of the three depots within traffic zone c is 37,000 kg. This scheduling method improves the aircraft utilization ratio while guaranteeing the shortest transport time, and each rescue aircraft is maximized. Given these decision-making results, the longest aircraft scheduling time is 1.176 h, with the average utilization ratio reaching as high as 95.0%.
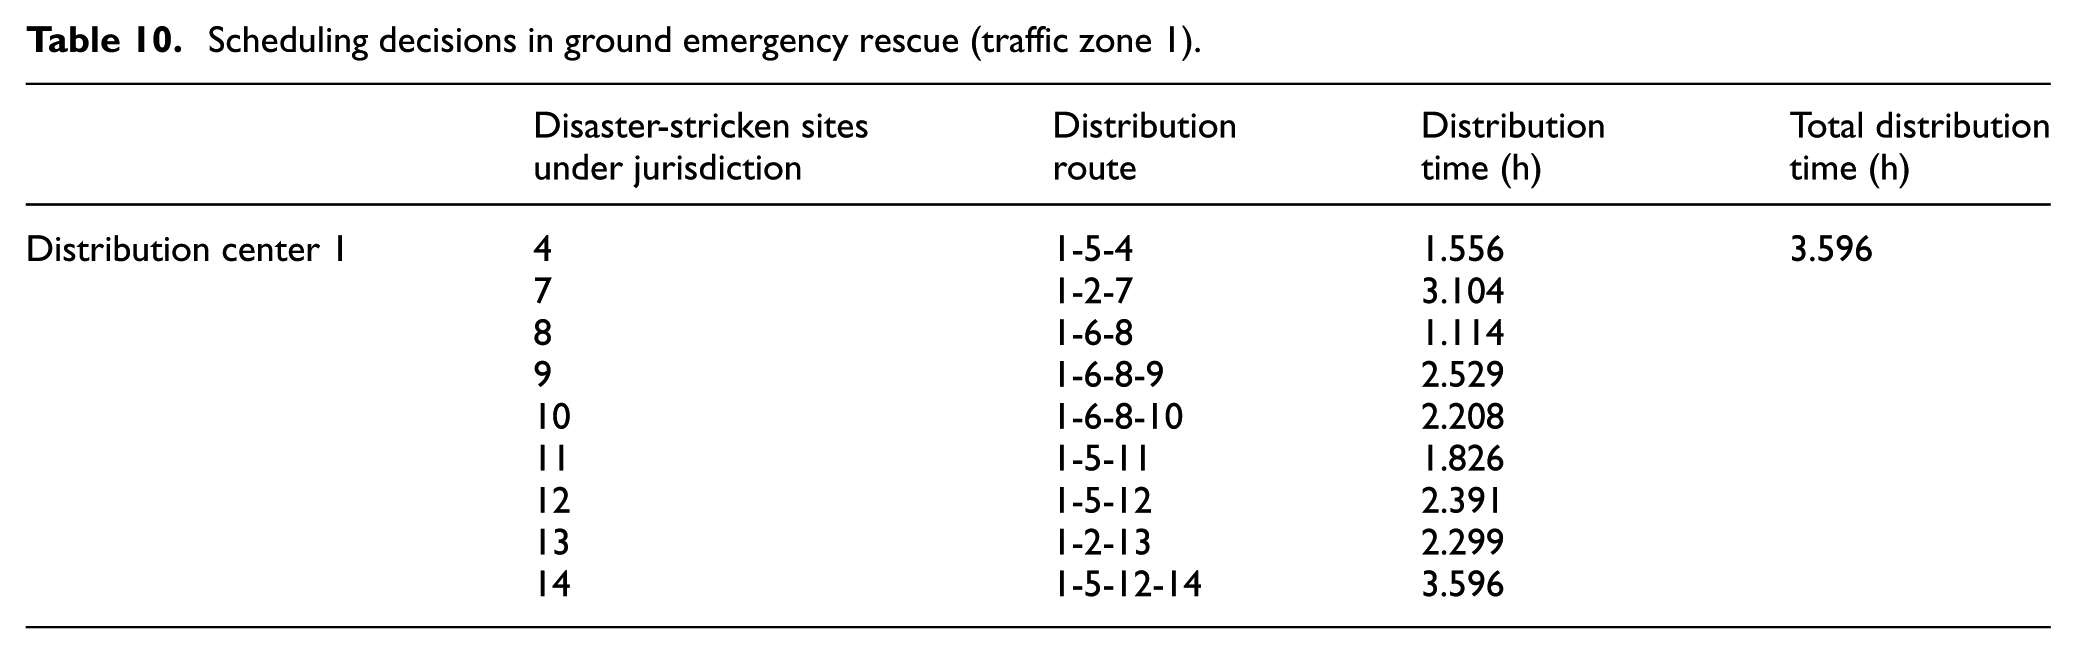
Ground transportation scheduling results are divided into three parts by traffic zones. These results are then divided into route selection and material distribution. The scheduling results of traffic zone 1 are shown in Tables 10 and 11; those of traffic zone 2 are shown in Tables 12 and 13; and those of traffic zone 3 are shown in Tables 14 and 15. The material distribution route is decided by the min–max principle. Distribution time is obtained by calculating the unobstructed travel time of vehicles and time delay caused by impedance. The average speed of rescue vehicles is 40 km/h. The total distribution time is the longest distribution time of the vehicle from the distribution center to the disaster-stricken site. The material satisfaction degree refers to the ratio of material quantity distributed by the distribution center to the disaster-stricken site to the demanded material quantity of the disaster-stricken site.
Scheduling decisions in ground emergency rescue (traffic zone 1).
Rescue materials distribution (traffic zone 1).

Scheduling decisions in ground emergency rescue (traffic zone 2).

Rescue materials distribution (traffic zone 2).

Scheduling decisions in ground emergency rescue (traffic zone 3).

Rescue materials distribution (traffic zone 3).

The demanded material quantity of each disaster-stricken site is first set with a comprehensive consideration of air and ground transportation scheduling results. For example, the demanded quantities for durable goods and consumables of the disaster-stricken site Xichong County are 2300 and 1400 kg, respectively; those of Wusheng County are 1500 and 1100 kg, respectively; those of Peng’an County are 1400 and 1000 kg, respectively; those of Yingshan County are 1900 and 1200 kg, respectively; those of Yilong County are 1500 and 1100 kg, respectively; those of Nanbu County are 2100 and 1500 kg, respectively; those of Yanting County are 1800 and 1200 kg, respectively; those of Shehong County are 2400 and 1900 kg, respectively; and those of Santai County are 3700 and 2100 kg, respectively. Therefore, the demanded quantities of the corresponding distribution center for durable goods and consumables are 18,600 and 12,500 kg, respectively.
Furthermore, the depot/distribution center traffic zones are divided according to the demanded quantity of the distribution center, guaranteed flight safety condition, and the optimization of three goals, which includes the shortest overall transport time, the lowest transportation cost, and the highest aircraft utilization ratio. In addition, the air transportation method is used to distribute all kinds of materials from the depots to the corresponding distribution center. For example, for the traffic zone whose distribution center is Nantong City, the depots in this distribution center are divided into Guangyuan, Dazhou, and Mianyang, and their storage quantities of durable goods and consumables are 7000 and 5000 kg, 6000 and 3000 kg, and 5000 and 4000 kg, respectively. Therefore, the total quantity of materials that can be transported to Nantong City is 18,000 and 12,000 kg. Hence, all materials of the depots are transported to Nantong City according to Plan 1, and the aircraft scheduling strategy is as follows: from Guangyuan to Nanchong, one Mi 171 aircraft, one Mi 8 aircraft, and one Y-7-100 aircraft are used to transport for one trip; 7000 kg durable goods and 5000 kg consumables are transported, consuming 0.993 h, and the aircraft utilization ratio is 96.7%. From Dazhou to Nanchong, one Mi 171 aircraft transports for two trips, and one Y-5 B(K) transports for one trip; 6000 kg durable goods and 3000 kg consumables are transported, consuming 1.176 h, and the aircraft utilization ratio is 94.7%. From Mianyang to Nanchong, one Mi 8 transports for one trip, one Y-7-100 aircraft transports for two trips, and one Y-5 B(K) aircraft transports one trip; 5000 kg durable goods and 4000 kg consumables are transported, consuming 0.852 h, and the aircraft utilization ratio is 90.9%. Within traffic zone a, the overall air transportation scheduling time of 1.176 h is the longest transport time, and the average utilization ratio is 94.1%.
Finally, the two goals, which include the shortest transport time and weighing, the maximization of the rescue priority, and the material satisfaction degree of disaster-stricken sites, are optimized according to the already divided distribution center/disaster-stricken site traffic zones and with consideration of the delay caused by road impedance. In addition, the ground transportation scheduling method is utilized to distribute all materials in the distribution center to disaster-stricken sites according to Plan 2. The ground transportation scheduling strategy is as follows: the route from Nanchong City to Xichong County is Nanchong City–Gulou County–Xichong County, the delay time calculated according to the traffic flow and road impedance formula is 0.158 h, and the material distribution time spent passing this route is 1.556 h. The delay time, distribution time, and material demand satisfaction degree from Nanchong City to disaster-stricken sites under the jurisdiction can be obtained in the same way. Within traffic zone 1, the overall ground transportation scheduling time of 3.596 h is the longest transportation time, and the material demand satisfaction degree is 96.47%. Other traffic zones can follow this route, and the scheduling results of the calculated example can be solved through MATLAB according to Plans 1 and 2. In this calculated example, traffic zone a + traffic zone 1 = 1.176 + 3.596 = 4.772 h; traffic zone b + traffic zone 2 = 1.067 + 4.301 = 5.368 h; and traffic zone c + traffic zone 3 = 1.166 + 4.547 = 5.713 h. Therefore, the overall air transportation scheduling time of this calculated example is 5.713 h.
Comparative analysis of road network damage
A comparison is conducted between the ground transportation scheduling process under road network damage and under no road network damage. First, the degree of road network damage is determined according to the traffic capacity of the damaged road segment. For example, when the traffic capacity of the damaged road segment is (100,60), then the road network damage degree is 40%. When the traffic capacity of the damaged road segment is (100,80), then the road network damage degree is 20%. The degrees of road network damage under other conditions can be obtained in the same way. Scheduling time delays caused by road network damage of various traffic zones are calculated according to the time difference between two different conditions in rescue scheduling. The comparative analysis results of traffic zones are shown in Tables 16–18.
Comparative analysis of delay time under different road network damage conditions (traffic zone 1).

Comparative analysis of delay time under different road network damage conditions (traffic zone 2).

Comparative analysis of delay time under different road network damage conditions (traffic zone 3).

Finally, the relationship between the degree of road network damage and the delay time is analyzed, and MATLAB is used to fit road network damage degree and delay time, as shown in Figure 7. The red, green, and blue curves in Figure 7 represent a fitting relationship between the degree of damage and the delay time within traffic zones 1, 2, and 3, respectively.

Fitting diagram of road network damage and delay time.
Discussion of road network damage
Figure 7 shows that the degree of road network damage and delay time mainly demonstrate a direct proportional relationship, which indicates that serious road network damage increases the delay time of rescue scheduling. Apart from road network damage caused by disasters, other factors influence rescue operation, such as weather conditions, human behavior, and the continuous effect of secondary disasters. Hence, not all points in Figure 7 demonstrate a direct proportional relationship. In addition, the distribution route under the influence of road network damage and that without the influence of road network damage are not completely the same, as shown by the analysis of distribution routes in Tables 16–18. In an actual emergency rescue operation, routes with slight damage and relatively unobstructed roads instead of routes with close distances should be selected for zones with serious road network damage. In this way, considerable rescue time can be saved, and a technical guarantee is provided for rescue operations. Therefore, the influence of the degree of road network damage on the emergency rescue process is considered in this article, thereby making the proposed method consistent with actual rescue conditions.
Comparative analysis of three modes of transportation
Basic data
This section compared the three emergency rescue methods proposed in this article, namely, air, ground, and combined air–ground transportation rescue, by designing a calculated example (Figure 8). Basic information of various zones is shown in Table 19. The four aircraft models shown in section “Comparative analysis of road network damage” conduct the rescue operations, the aircraft properties are shown in Table 5, and the obtained average speed of rescue vehicles is 40 km/h. When the emergency scheduling mode is combined air–ground transportation, zone 1 can be the transshipment point of ground transportation, that is, the distribution center. When only air or ground transportation rescue is selected, zone 1 can be regarded as one node in the transportation network. Zone 11 has one Mi 8, one Y-7-100, and one Y-5 B(K), whereas zone 15 has one Mi 171 and one Y-5 B(K). In this example, the supplied material quantity of the depot is assumed to be sufficient, and other assumptions are shown in section “Assumptions, variables, and parameters.” Only one type of relief material is considered, and the fixed loading/unloading time and refuel time of aircrafts are set to 20 min.

Traffic distribution diagram of different zones.
Basic information of different zones.

Results and analysis
Air transportation scheduling results
Scheduling scheme of aircrafts setting off from zone 11 (Table 20).
Scheduling scheme of aircrafts setting off from zone 15 (Table 21).
Scheduling decisions of aircrafts setting off from zone 11.

Scheduling decisions of aircrafts setting off from zone 15.
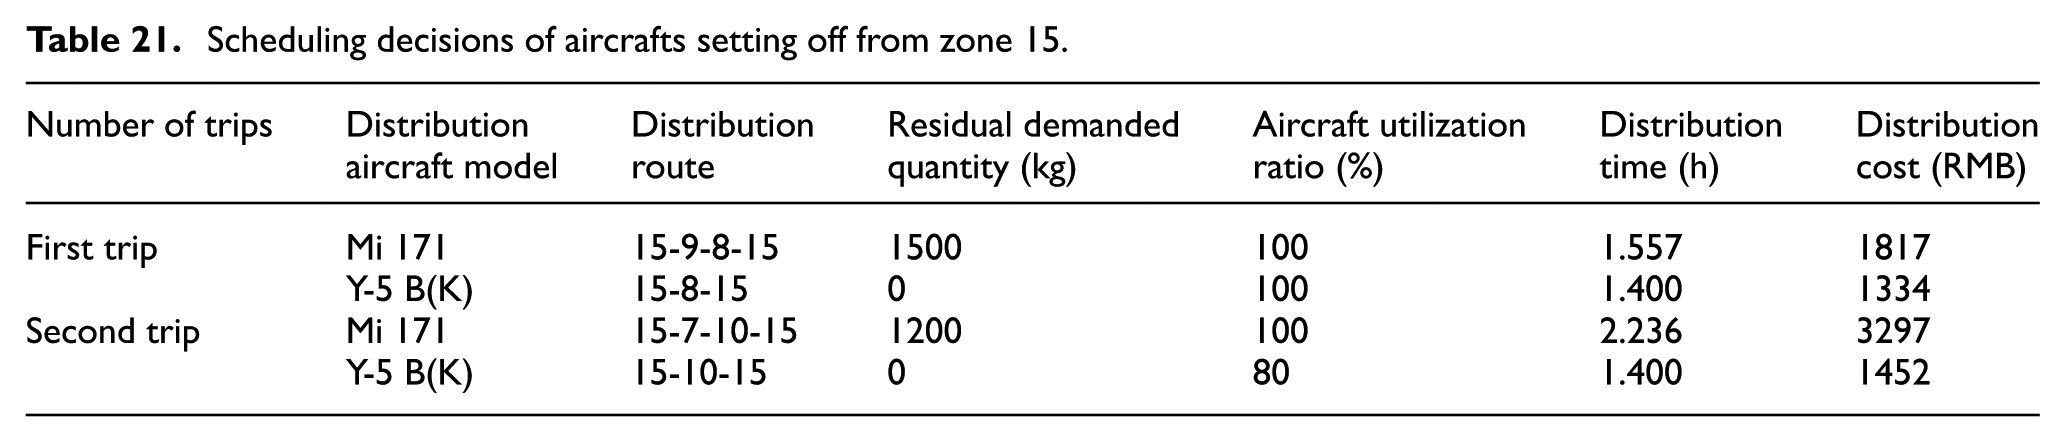
Tables 20 and 21 show that the distribution time of Y-7-100 setting off from zone 11 is 0.607 + 1.646 = 2.253 h, that of Mi 8 is 1.39 h, and that of Y-5 B(K) is 1.11 + 1.11 = 2.22 h. Therefore, the scheduling time of aircrafts setting off from zone 11 is 2.253 h, and the distribution cost is RMB 6752. The distribution time of Mi 171 setting off from zone 15 is 1.557 + 2.236 = 3.793 h and that of Y-5 B(K) is 1.4 + 1.4 = 2.8 h. Hence, the scheduling time of aircrafts setting off from zone 15 is 3.793 h, and the distribution cost is RMB 7954. In summary, the total air transportation scheduling time is 3.793 h, the total transportation cost is RMB 14,706, and the average aircraft utilization ratio is 97.3%.
Ground transportation scheduling results
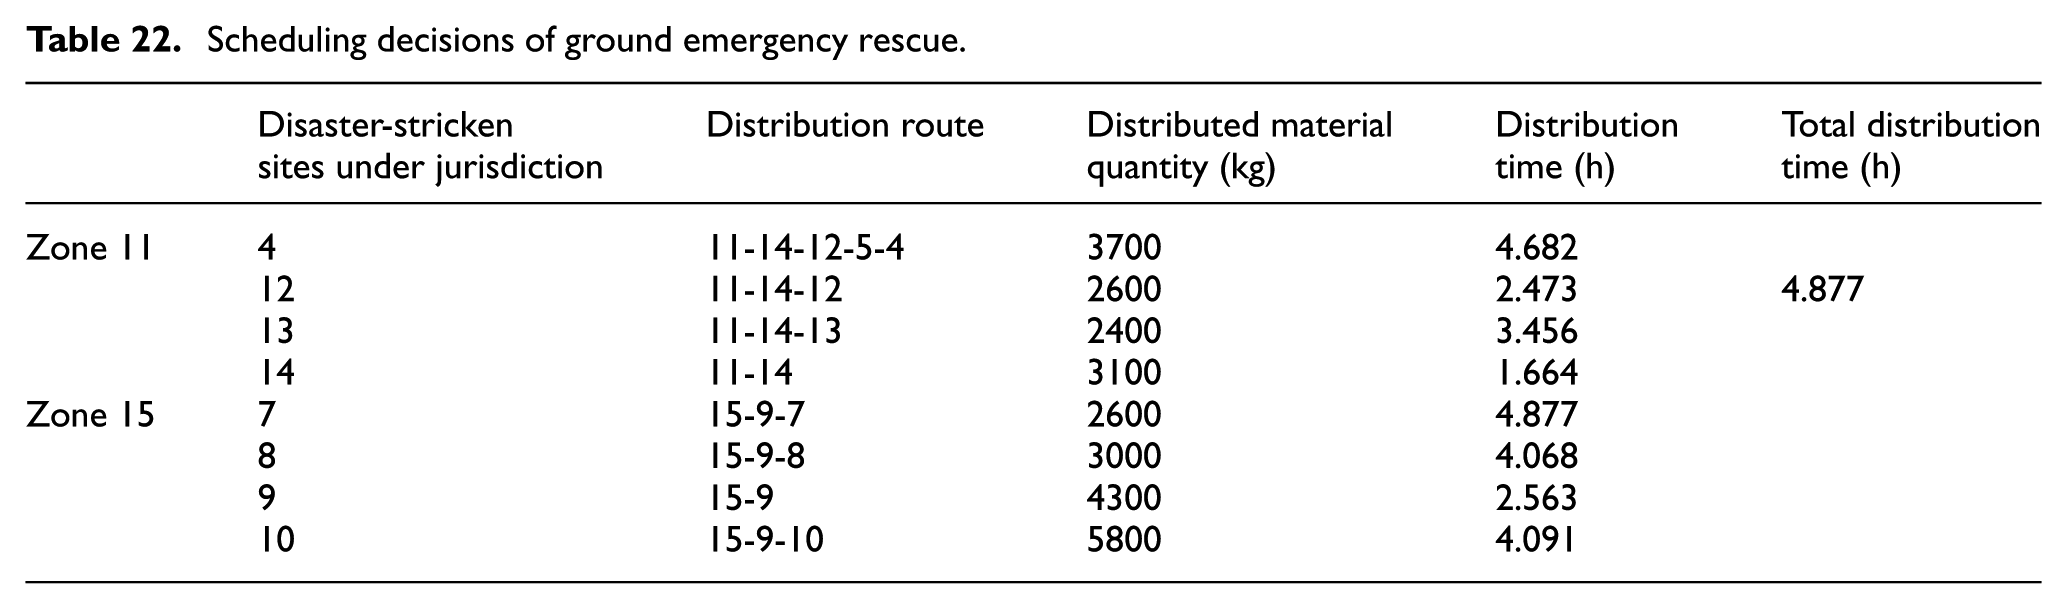
Ground transportation scheduling results (Table 22).
Scheduling decisions of ground emergency rescue.
Combined air–ground transportation scheduling results
Air transportation scheduling scheme (Table 23).
Ground transportation scheduling scheme (Table 24).
Air transportation scheduling decisions in combined air–ground transportation.

Ground transportation scheduling decisions in combined air–ground transportation.

Discussion of scheduling results
The analysis of results shows that when only air transportation rescue is used, the overall scheduling time is 3.793 h, the average aircraft utilization rate is 97.3%, and the air transportation cost is RMB 14,706. When only ground transportation rescue is used, the overall scheduling time is 4.877 h. However, when the proposed air–ground transportation rescue method is used, the overall scheduling time is 4.398 h, the average aircraft utilization rate is 99.3%, and the air transportation cost is RMB 11,363. A comparison of the three transportation methods is shown in Figures 9–11. Although the overall scheduling time of the proposed air–ground transportation rescue method is relatively long, the average aircraft utilization rate increases by 2.05% and air transportation cost decreases by 29.42% compared with using air transportation only. Compared with the use of the ground transportation mode only, the scheduling time of the proposed air–ground transportation rescue method is shortened by 10.89%. In summary, the proposed combined air–ground transportation scheduling model improves scheduling efficiency and the utilization of highly efficient aircrafts.

Comparison of over-scheduling.

Comparison of the average aircraft utilization rate.

Comparison of the air transportation cost.
Given that the air scheduling plan results from the ground scheduling plan, and the ground scheduling mainly depends on the demand of supplies and the traffic state of the road network, we first analyze the connection between independent and dependent variables in Plan 2.
As Figure 12(a) shows, when the value of traffic flow equals zero, no other vehicles are present in the network except for an ambulance. Thus, we can obtain the minimum travel time, that is, the unimpeded travel time. As the traffic flow increases, travel time also increases until it reaches saturation value. Figure 12(b) shows that, while the demand has not been satisfied, a positive correlation is found between satisfaction and supplies, until the stable satisfaction value 1 is reached. The above two figures explain the variables that affect performance in ground scheduling. Figure 12(c) and (d) is scatter diagrams that show how travel times affect travel time and scheduling cost. Figure 12(e) shows the positive correlation between aircraft utility and supplies until the two variables reach an equal value.
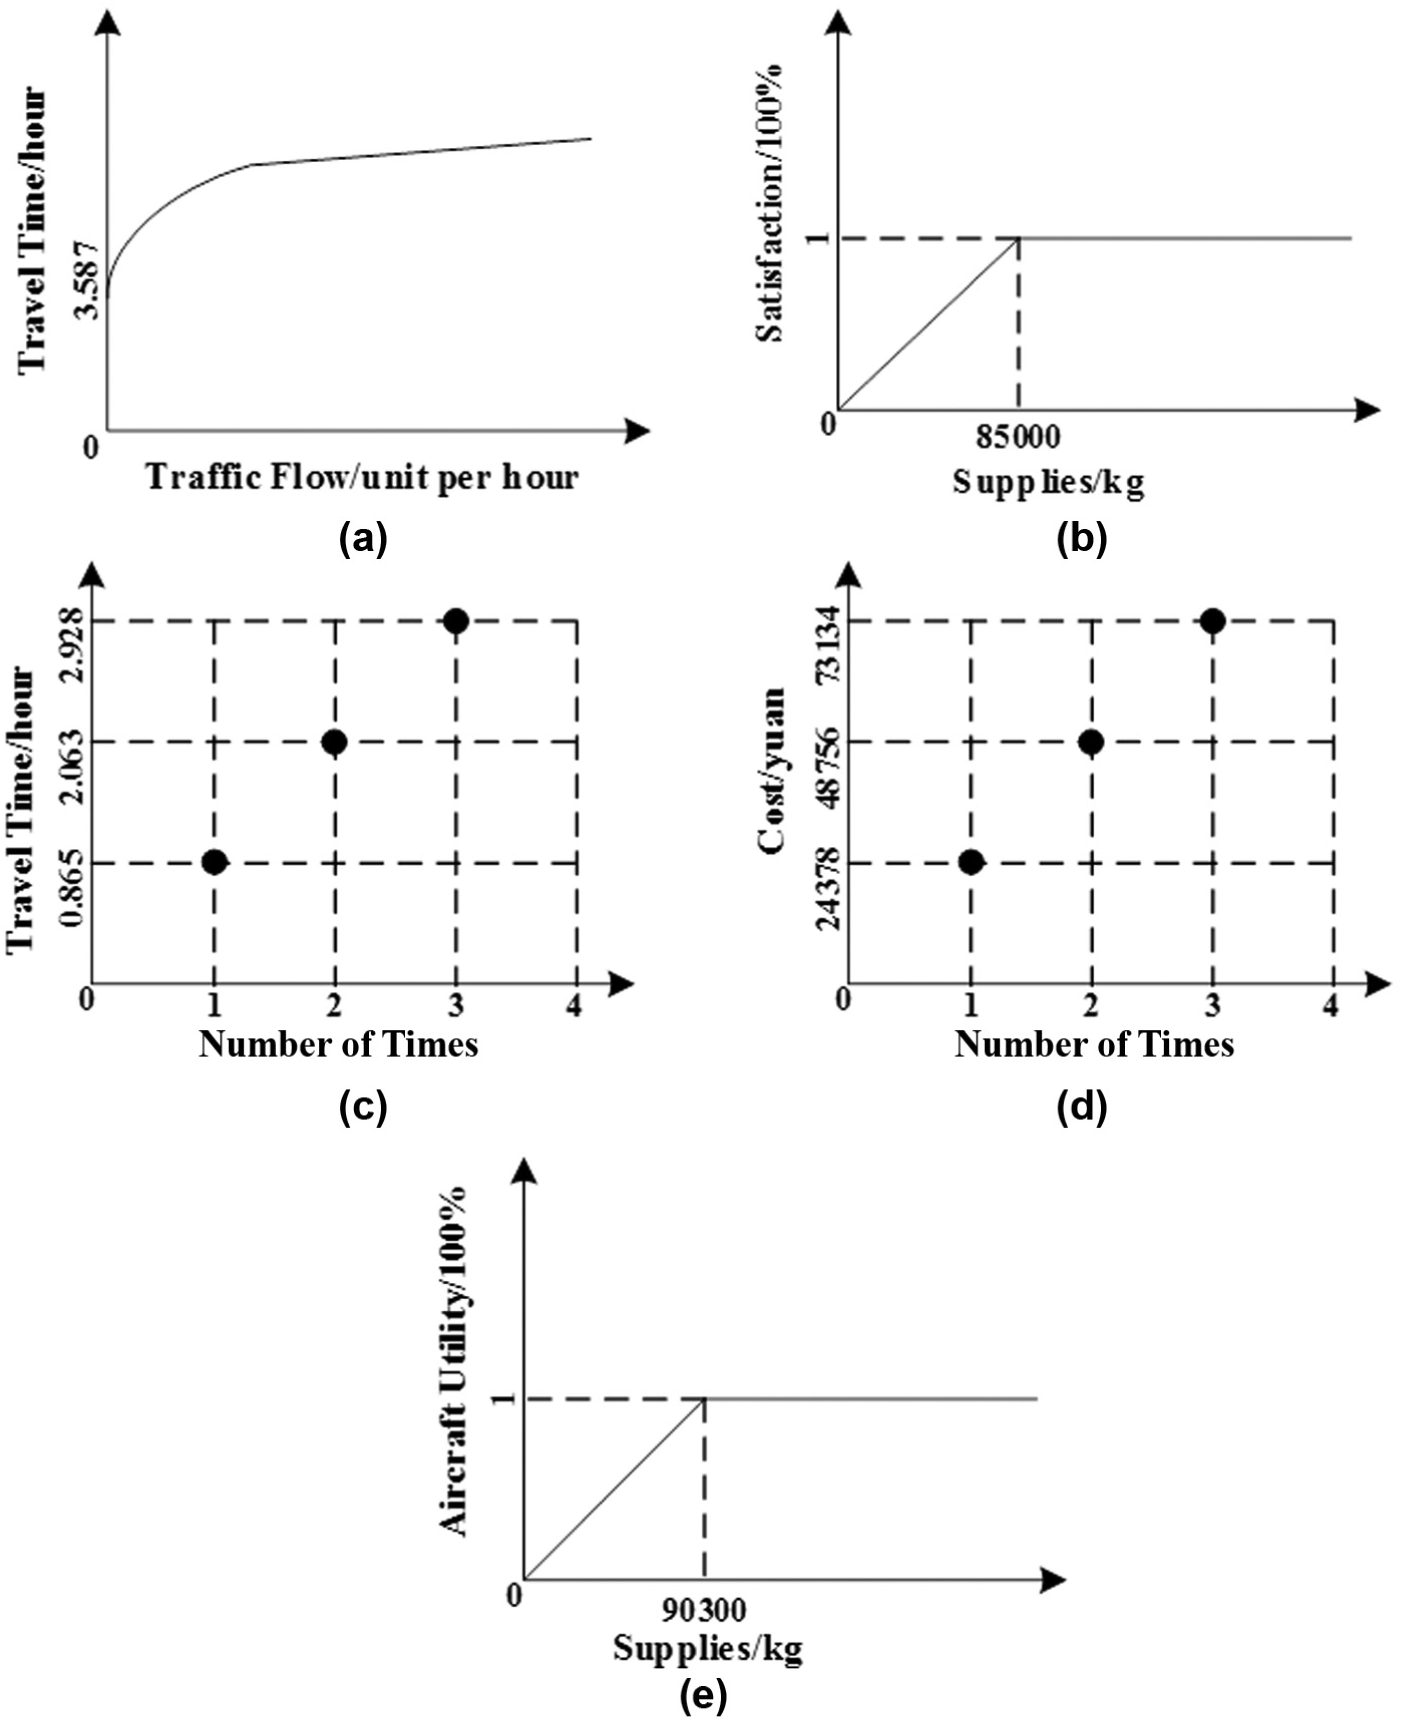
Diagram with the trend and the performance of the model: (a) diagram with traffic flow and travel time, (b) diagram with supplies and satisfaction, (c) diagram with number of times and travel time, (d) diagram with number of times and cost, and(e) diagram with supplies and aircraft utility.
Conclusion
This article proposed a combined air–ground transportation scheduling method to resolve the deficiencies of air transportation alone during the emergency rescue process. An air–ground transportation scheduling model that merges air and ground transportation scheduling was completed based on the scheduling model of dynamic road networks under conditions in which roads were damaged. The following conclusions are made based on the above analyses:
Emergency traffic flow data were extracted, and a dynamic road network was analyzed within the limitations of road damage caused by natural disasters with vehicle traffic flow taken into consideration. In accordance with rescue priorities and demanded material quantities in different disaster-stricken sites, the ground transportation scheduling model was constructed with the shortest transport time and the maximum sum of components as optimization goals.
The combined air–ground transportation scheduling model was established with different rescue priorities and degrees of material satisfaction of different disaster-stricken sites and the shortest overall transport time taken into consideration. The model considered a method that combines air and ground transportation to uniformly schedule aircrafts, vehicles, and materials during an emergency rescue process. The proposed method improved the coverage rate of rescue networks and transportation efficiency.
With the use of data from Sichuan earthquake-stricken sites, a calculated example was designed, MATLAB was used to solve the calculated example, scheduling results were analyzed, and the feasibility of the combined air–ground transportation scheduling model was verified.
Nevertheless, combined air–ground transportation can be improved further. First, for the scheduling model of a dynamic road network, the road network is simplified and the straight-line distance between two points is used to replace the actual distance, thereby resulting in inaccurate scheduling results. Furthermore, air transportation scheduling does not consider the influences of other factors, such as meteorological and human factors, and properties of the aircraft itself, in scheduling results for the large combined air–ground transportation scheduling model. This lack of consideration may result in certain errors between the calculated delayed transport time and that in actual situations. Finally, the model has a few fixed timeframes, such as the loading/unloading time and refuel time of air transportation; these frames are insufficiently flexible.
Future studies on road networks should achieve data accuracy based on geographic information system (GIS), and flight delay time will be calculated in future modified models. Follow-up research can add a time window to provide a flexible and highly efficient scheduling time, which will be of high theoretical value and research significance.
Footnotes
Handling Editor: Fakher Chaari
Declaration of conflicting interests
The author(s) declared no potential conflicts of interest with respect to the research, authorship, and/or publication of this article.
Funding
The author(s) disclosed receipt of the following financial support for the research, authorship, and/or publication of this article: This study was supported by the National Science Foundation of China (Nos U1633119 and 71271113) and the Fundamental Research Funds for the Central Universities (No. NS2016062).