
Abstract
Structural health monitoring of the truss structure is often confronted with spatial incomplete measured data due to the reasons of the cost of the sensors, the inaccessibility of some locations, and the sensor damage subject to the harsh service environments in practical cases. For the unmeasured member, the response estimation approaches can be used to predict the response from a limited set of measured data and a finite element model. This article aims to seek the strain estimation algorithms that are able to reduce the expensive computation with uncertain loading conditions to lend themselves to be embedded at the sensor level, such as applied on a wireless fatigue strain–digitizing sensor. There are two algorithms presented and referred as the augmented Kalman filter and the modal expansion in this article. A numerical example is performed to investigate the accuracy and efficiency of algorithms by quantifying estimation errors. The adjustable parameters that are controllable in advance such as the noise covariance for the filter-like algorithm and the modal orders for the modal algorithm are discussed and demonstrated. Based on the aforementioned parameters, the two proposed algorithms are able to generate promising results where the time and frequency domain estimated strain signals in good agreement with simulated signals with the noisy contamination and white noise or narrowband ambient excitation. It is shown that the two algorithms are considered to be competitive and interchangeable as the potential solutions for online estimation.
Introduction
Structural health monitoring (SHM) takes a breakthrough of care and maintenance of engineering structure by making use of structural and environmental information and measurement technologies to make the structure have self-sensing and self-diagnostic abilities. Truss structures are commonly used as the support skeletons such as aircraft wings, crane booms, derricks, scaffolds, transmission towers, offshore platforms, and steel bridges.1,2 It is an inevitable problem to implement the SHM strategy and extract response data from a large number of members and joints of a truss structure. However, due to the cost of the sensors, the inaccessibility of some locations and the sensor damage subject to harsh service environments in practical cases, it is difficult or sometimes impossible to acquire the required data on the truss structure.3,4
In some cases, vibration data from a limited number of sensors are used to estimate input information by field experiences 5 or by system inversion techniques 6 and then to extrapolate indirectly responses at unmeasured locations. The problem of load inversion is often ill-posed, 7 and the results are sensitive to measurement noises and modeling errors. Recently, the Bayesian filter approaches have been proposed in the literature to provide a series of recursive solutions that may be the input and the unobservable system states with the corresponding uncertainties. Ching and Beck 8 estimated the unknown state of a structure using incomplete output data and uncertain dynamic loading. Bernal 9 proposed a damage detection method to employ the whiteness test based on linear Kalman filter (KF) innovations. To lower the impact on the accuracy of the state estimation due to the unknown input, Gillijns and De Moor 10 have proposed a KF-based joint input-state estimation algorithm where the input estimation is performed prior to the state estimation step. The algorithm was then introduced in structural dynamics by Lourens et al., 11 extending the algorithm in combination with reduced-order models. Maes et al. 12 developed the algorithm by considering the inherent correlation between process noises and measurement noises. The standard KF is used by Papadimitriou et al. 13 to estimate strain responses at unmeasured members using acceleration measurements. Jo and Spencer 14 verified that the combination of acceleration and strain measurements for the standard KF could obtain better estimates. The extension of the standard KF estimation is achieved by a dual implementation of KF to estimate the unknown input and the system state simultaneously.15,16 Lourens et al. 17 presented an augmented Kalman filter (AKF) technique to identify dynamic force, which is also shown how joint input-state estimation can be achieved by including the unknown forces in the state vector and estimating this augmented vector using a standard KF. Meanwhile, state estimation can also be performed for nonlinear or time-varying system. The nonlinear filters are further developed for the simultaneous estimation of the system states, unknown input, and system parameters. Naets et al. 18 presented an augmented extended KF approach to estimate system state, input, and model parameters with a model reduction technique for a minimal computational cost. Al-Hussein and Haldar 19 utilized the weighted global iteration technique to achieve the unscented KF with unknown input. However, once there are too many unknown parameters, the required Jacobians are commonly computationally expensive and do not lend themselves to be embedded at the sensor level.
Another approach to estimate structural responses at unmeasured locations is the modal expansion (ME) technique. Wan et al. 20 presented a type of modal response reconstruction method based on the empirical mode decomposition in the presence of closely spaced modes. Iliopoulos and colleagues21,22 made use of the ME algorithm to estimate the strain responses using a limited number of response data obtained from in situ measurements on an offshore monopile wind turbine. The system model used in the strain estimation is constructed based on a finite element (FE) model of the structure.
With recent developments in wireless sensing devices, the sensor network with distributed computational capabilities at the sensor level can now be realized. Authors’ research group has developed a type of wireless fatigue strain–digitizing sensor and got good application in the local component. 23 The novel sensor furnishes the in situ fatigue life prediction straightforwardly with the embedded rain-flow counting algorithm. In order to obtain the fatigue information of a truss structure with a large number of members in practical service environments, this article studies the strain response estimation algorithms to predict the strain responses on the truss members from sparse strain measurements without requiring excessive computational resources. Two algorithms AKF and ME are selected because they should not make a significant contribution to footprint so as to be embedded at the sensor level for online estimation. The two-state estimation algorithms make use of a model of the structure and a limited number of response data for the prediction of the dynamic strain in the truss structure. A numerical example on a steel truss bridge is performed to investigate the accuracy and efficiency of algorithms. The quality indicators in time and frequency domain are introduced to compare the quality of the strain estimates. The adjustable parameters to effects of strain estimates such as noise covariance and error covariance for the AKF algorithm and the modal orders for the ME algorithm have also been discussed.
Theoretical approaches
Strain response estimation based on AKF
A structural system with n degrees of freedom formulated using

where
Considering the state vector

where
in which
Note that the system input

where
Combining equations (2) and (3), we have the augmented state equation

where
The classical discrete-time observation equation can be given by

where
The KF algorithm can be designed to generate the minimum-variance unbiased estimates once some assumptions are given.

It is noted that
Measurement update
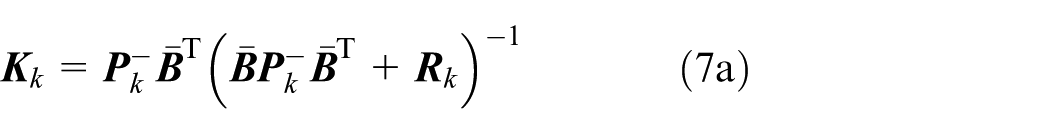


Time update


where
Strain response estimation based on ME
Based on the modal superposition approach, the displacement vector

where
The strain is the partial derivative of the displacement. We get

where

For most practical problems, it is not necessary to use all strain mode shapes; only few modes in lower frequency range is taken into account when considering the measure and identifying reason. Therefore, the aforementioned can be expressed as
We can consider that several sets of strain responses at all the measured locations of strain vector are reassembled and referred to as the known vector


where

where
It is noted that the required modal order number m can be chosen by introducing the modal assurance criteria (MAC) that is used to check the modal orthogonality. According to the vibration theory, a perfect modal identification should have a good modal orthogonality assuring that the off-diagonal elements of the MAC matrix are approximately zeros. Nevertheless, the number of identified modes from the measured data does not necessarily have to be matched with the numerical modes. The MAC matrix can be calculated by
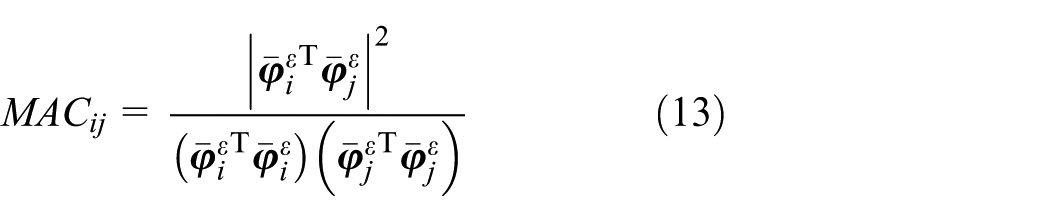
where
Numerical examples
Truss model and sensor placement
To investigate the accuracy and the efficiency of the two strain estimation algorithms for the truss structure, a two-dimensional truss is studied as a numerical example. It is modeled for a true steel truss bridge. The truss structure comprises 16 joints and 29 members, as shown in Figure 1. The height of the truss is 11 m, and the length of the horizontal chord is 8 m. The right side of Figure 1 is an example of the H-shape section that has the web plate of 420 × 12 mm2 and the flange plate of 460 × 20 mm2. Also, the intact elastic modulus of the truss member is 210 GPa and the added mass of every gusset plate on the truss is 90 kg.

Schematic diagram of the truss model and its H-shape member.
Strain sensors are assumed to place at a limited number of measured locations, as shown in Figure 2. Only three strain sensors are deployed on the corresponding truss members (Element 8, 9, and 10). In practical cases, the wired fiber Bragg grating sensors or the wireless strain sensors (e.g. wireless fatigue strain–digitizing sensor 23 ) are available, and the long-enough gage length is necessary to avoid adverse effects of local stress.

Sensor placement (e.g. wireless fatigue strain–digitizing sensor 23 ).
The presented strain estimation algorithms are validated using the simulated strain responses based on the sensor placement to predict strain responses on other members. As such, the estimated accuracy can be measured by comparing the results of the predicted and the simulated signals. In this article, the time response assurance criterion and frequency response assurance criterion (TRAC and FRAC)
27
are chosen, which are used to analyze the correlation for one set of responses from the predicted


where
Strain response estimation under white noise excitation
A series of white noise ambient excitation are applied on Node 8 along the vertical direction degree of freedom. The time and frequency domain load data are shown in Figure 3. The strain responses can be calculated by the Newmark-beta method. The sampling rate is set to 500 Hz. The simulated strain response signals based on the sensor placement are shown in Figure 4. The standard deviation of the noise process of data “jamming” is equal to 2.7 με (approximately 3% noise to signal ratio).

White noise excitation shown in time and frequency domain.

Example of measured time and frequency domain strain signals.
Researchers15–17 have proven the covariance matrix of the process noise Q plays a key role on the quality of the response estimation, and the covariance matrix can be defined as a diagonal matrix with a proper standard deviation of the process noise. The initial estimate error covariance matrix also strongly influences the quality of the response estimation. If the estimation errors which can be indicated by the TRAC and FRAC are regarded as the function of the covariance matrices, the mapping relation depends on the L-curve. 17 Figure 5 lists the corresponding standard deviation (SD) values of the noise covariance and the error covariance of Element 26 in order. The plots do not seem like a perfect L-curve, however, the value SD = 1010 N of the standard deviation can be chosen in advance for the noise covariance and the error covariance, respectively.

Relationship between quality indicators and adjustable parameters of AKF: (a) noise covariance and (b) error covariance.
The strain modal identification is carried out according to the frequency domain decomposition method
28
because of an ease of use and its ability to identify closely coupled modes. A total of four modes can be identified from the strain responses and normalized by the reference point as shown in Figure 6. The corresponding modal frequencies are 5.37, 11.23, 26.37, and 35.16 Hz, respectively; the first three of which are matched with the peak values in Figure 4(b). Figure 7 shows the MAC matrices of the identified and the calculated modes with very good orthogonality. Herein, the first three order strain mode shapes are chosen to form the truncated mode matrix

Identified strain mode shapes.

Illustration of MAC values.
Figure 8 shows the time and frequency domain strain responses at Element 26 estimated by the AKF and ME algorithms. It is observed that the AKF and ME are able to provide a highly accurate estimation even using the noisy contaminated data. The estimated and real data are nearly overlapped. An overview of the TRAC and FRAC values are given in Figure 9. Some trends are illustrated as follows: the quality indicators that stand for the estimation errors show better results on the truss members near the measured locations (Element 8, 9, 10); the maximum value of the TRAC by the AKF algorithm from the unmeasured member is 0.993, and the minimum value of the TRAC by the AKF algorithm from Element 21 is 0.918; all the TRAC values by ME algorithm are more than 0.95; and the lower estimation errors are shown in FRAC values whether by the AKF or ME algorithm. That is partly because the range of the data selection is different. For the FRAC, the data points are required only on the low-frequency band. The effect on the higher frequency band is commonly ignored.

Time domain and frequency domain comparison of estimated and simulated strain responses at Element 26.

Quality indicators of strain estimates.
Note that when we run the programs based on the MATLAB codes in a 4G memory space in 32-bit system, the computer times for AKF and ME algorithms are less than 3 and 1 s, respectively, which are much less than the sampling time of 10 s. Meanwhile, considering the input information about the load amplitudes and locations are assumed unknown, the advantage of computational reduction of the two algorithms is even more prominent. However, the development of the embedded algorithm needs to be further discussed at the next work, especially for the optimized sensor placement and to consider the new sensor cost.
Strain response estimation under narrowband noise excitation
The truss structure (in fact, many engineering infrastructures) is commonly subjected to the low-frequency excitations on a narrow band, such as a truss bridge tested during the vehicle traffic and the offshore platform forced by the wave loading. A series of colored ambient excitation are also applied on Node 8 but with the frequency band of approximately 10–15 Hz. Figure 10 shows the time and frequency domain load data. The simulated strain response signals are contaminated by 3% noise to signal ratio, and only three strain sensors are deployed on the truss members as shown in Figure 2.

Narrowband noise excitation in time and frequency domain.
In Figures 11 and 12, the estimated strain responses in time and frequency domain and the TRAC and FRAC values are illustrated. The estimated and real strain time histories closely coincide with each other. The trend of the quality indicators shows an agreement with the white noise’s example. However, the strain estimates by the ME algorithm give more satisfactory results than by the AKF algorithm even though the optimized sensor placement has not be further studied. The minimum value of the TRAC by the ME algorithm is 0.843, and for the AKF algorithm, the value goes below 0.8. However, we cannot fully prove that the results from the ME algorithm are better than the AKF or a class of Bayesian filter algorithms because the KF-like state estimation techniques with uncertain loading condition have not been elaborated and validated in this preliminary study. The two strain estimation algorithms presented for the real application are still competitive and interchangeable.

Time domain and frequency domain comparison of estimated and simulated strain responses at Element 26.
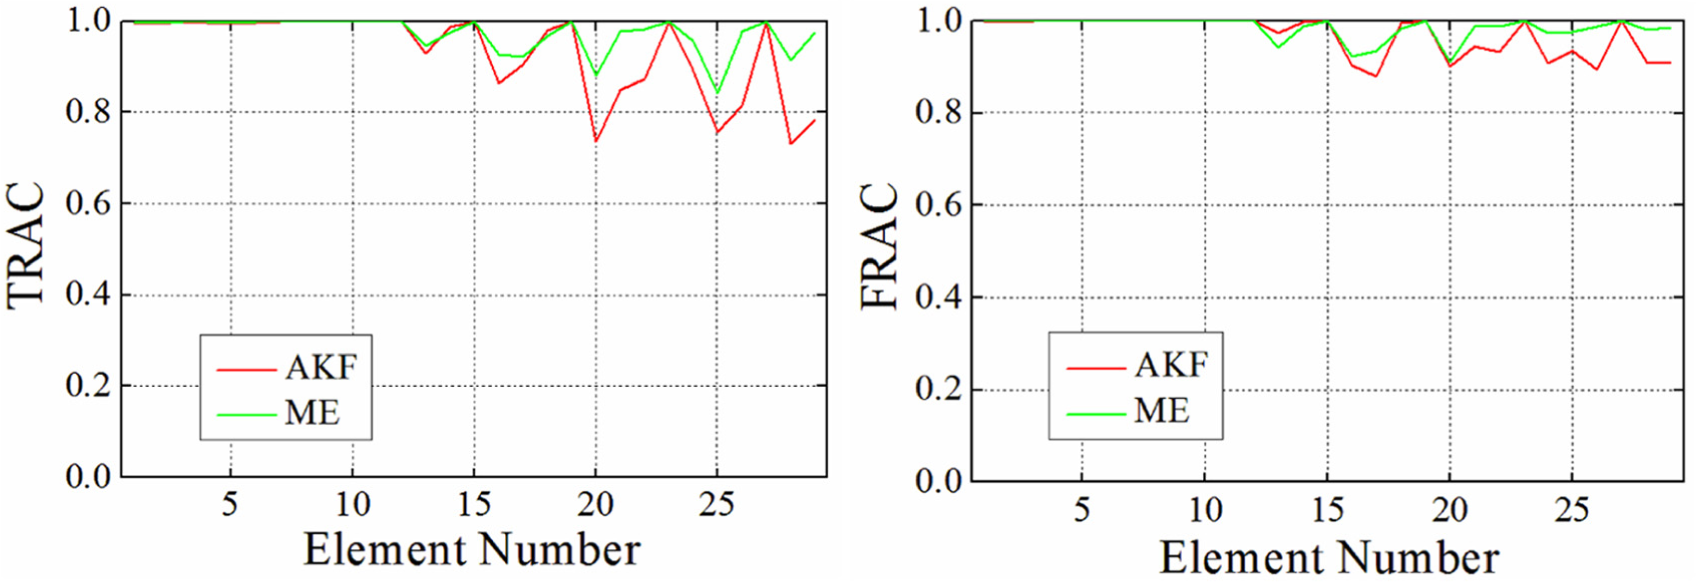
Quality indicators of strain estimates.
Conclusion
This article presents the strain response estimation methods for unmeasured members in the truss structure. The aiming point is to seek some ease-of-use algorithms that reduce the expensive computation to lend themselves to be embedded at the sensor level, such as applied on a wireless fatigue strain–digitizing sensor. The AKF and the ME algorithms are introduced to predict the strain responses at unmeasured locations by combining a limited set of strain response measurements and a FE model.
A numerical example on a two-dimensional truss structure is undertaken to focus on checking the estimation errors. The adjustable parameters that are controllable in advance such as the noise covariance for the AKF algorithm and the modal orders for the ME algorithm have been demonstrated by investigating the L-curve for the AKF algorithm and the modal identification and MAC for the ME algorithm. Based on the aforementioned parameters, the two algorithms are able to generate promising results where the time and frequency domain estimated strain signals in good agreement with simulated signals with the noisy contamination and uncertain loading conditions on white noise or narrowband ambient excitation. The computer times of the algorithms were much less than the sampling time. It is shown that the two algorithms presented can be considered to be the potential solutions for online estimation.
Footnotes
Handling Editor: Francesco Massi
Declaration of conflicting interests
The author(s) declared no potential conflicts of interest with respect to the research, authorship, and/or publication of this article.
Funding
The author(s) disclosed receipt of the following financial support for the research, authorship, and/or publication of this article: The paper is financially supported by National High Technology Research and Development Program of China (“863” Project) with grant no. 2014AA110401.