
Abstract
In this study, two-dimensional heat transfer distribution on the leading surface and trailing surface in a rotating smooth channel with typical boundary condition of four surface heating was investigated experimentally for the first time. The Reynolds number, based on channel hydraulic diameter (80 mm) and the bulk mean velocity, ranges from 15,000 to 30,000, and the highest rotation number is 0.359 with the Reynolds number of 15,000. The mean density ratio is about 0.11 in this work. The obtained result showed that rotation has an important effect on the heat transfer distribution along the span-wise direction. On the leading side, rotation-induced secondary flow makes the Nu/Nu0 at the edge area of the wall surface (Z/D = 0 and Z/D = 1) is higher than that on the middle area (Z/D = 0.5). On the trailing surface, the trend of Nu/Nu0 ratio along the span-wise direction is reversed. Along the stream-wise direction, the Nu/Nus ratio increases with the rotation number monotonously on the trailing side. However, on the leading side, with the increase in rotation number, the Nu/Nus does not decrease monotonously along the stream-wise direction, there is a slight enhancement along the stream-wise direction. The secondary flow induced by rotation enhances
Introduction
The increasing demands about the higher efficiencies of gas turbine engines need the engine designers to develop effective cooling technologies because the turbine inlet temperatures of gas are far beyond the working temperature even melting point of material. To resolve this conflict, lots of cooling techniques were applied to protect the turbine blade. Internal forced convection is one of the most classical and popular method used to keep an adequate temperature in the blade material. As one of the effective type for the internal forced convection, serpentine passage in the middle section of a turbine blade has been investigated, improved, and applied in the turbine blades for more than 30 years. Over the past several decades, a vast amount of studies dealing with internal cooling of turbine blades have been reviewed by Han and colleagues.1,2
The flow and heat transfer for the coolant within the internal channel of the turbine blade is typical heat transfer in rotating channels. The history of studies on the heat transfer in rotating channels can stretch back to 1989. Wagner and collegues3,4 reported detail measurements in a rotating channel. They concluded that rotating increases the heat transfer up to 3.5 times on the trailing surfaces and decreases to 40% on the leading surfaces compared to non-rotating results in the inlet passage. They also found that four parameters influence the heat transfer in a rotating passage: coolant-to-wall temperature ratio, Rossby number, Reynolds number, and radius-to-passage hydraulic ratio. Then, many researchers started to investigate the heat transfer in a rotating channel. Kukreja et al. 5 used the Naphthalene sublimation technology to investigate a rotating two-pass square channel. They also found that the rotation-induced Coriolis increases the mass transfer on the trailing wall and reduces the mass transfer on the leading wall. Such trend was also observed by other researchers.6–10 However, all the works focused on the averaged heat transfer distribution along the channel based on the copper plate technique. In a rotating internal cooling channel, rotation-induced secondary flow and centripetal buoyancy force make the flow and heat transfer more complexity; therefore, more detailed information about two-dimensional (2D) heat transfer data along the whole surface in the rotation channel is needed for turbine blade designers.
Bons and colleagues11,12 presented a detail measurements by particle image velocimetry (PIV) and an infrared (IR) detector to show the flow field and heat transfer distribution in a rotating square smooth channel with a Reynolds number of 8100 and the max rotation number of 0.2. According to the velocity data, they found that, on the leading side, there is a strongly distorted stream-wise profile indicative of a buoyancy effect, which is helpful for investigators to understand the phenomena of the heat transfer distribution in the rotating channel. However, they did not obtain the velocity data within the boundary layer, which is very important to explain the phenomenon of heat transfer. What’ s more, due to the different resistance of the four heater on the four walls, the thermal boundary conditions of their investigation are not symmetrical; this causes the max difference of 20% between the four walls. As we all know, heat transfer and flow are coupled to each other; therefore, thermal boundary condition is very important for the investigation in a rotating channel, which has been verified by Han and Zhang’s 13 investigation. In 1992, Han investigated the influence of the different thermal boundary condition in a rotating channel. Three cases of thermal boundary conditions were studied: (A) four walls uniform temperature, (B) four walls uniform heat flux, and (C) leading and trailing walls hot and two side colds. The investigation found that the value of Nu/Nu0 on the leading side for three cases is case B > case C > case A, and on the trailing side is case A > case C > case B. However, on the trailing side, the difference of Nu/Nu0 among the three cases decreases comparing with the leading side.
Liou et al. 14 first investigated the heat transfer in a rotating internal channel by thermography liquid crystals (TLCs) with a Reynolds of 10,000 and the rotation number ranging from 0 to 0.2. The article obtained the detailed local Nusselt number distributions on the leading and trailing walls. From the detailed data, the work found that there was a critical rotation number, Roc. Below Roc, rotation has no prominent effect on the regional-averaged Nusselt number ratios of the regions after 180° sharp turn in a rotating two-pass cooling passage, which was very useful for practical tests of computational models. However, in their experiments, the air was hot and the channel wall was cool, which caused the opposite direction of the buoyancy force in the channel. Therefore, the heat transfer data under the effect of buoyancy force is not reliable. Then, Liou and colleagues15–17 used IR to measure the temperature in a radially rotating twin-pass smooth-walled parallelogram channel with the Reynolds number and rotation number ranging from 5000 to 20,000 and 0 to 0.3, respectively. In the experiment, they used two stainless steel heating foils to heat the leading and trailing side, and the other two sides of the channel are cold. They generated a heat transfer correlation determining the area-averaged Nusselt numbers over the inlet and outlet legs and over the turning region.
Yang et al.
18
experimentally investigated the heat transfer is a smooth rotating multi-passage channel. They discussed about the effect of rotation, turning vane, trailing edge ejection, and channel orientation on heat transfer with the Reynolds number ranging from 10,000 to 40,000 at rotation numbers up to 0.32. They found that rotating utilizes a positive and negative effect on heat transfer on leading and trailing side on the radial inward flow, respectively. And, the turning vane decreased the effect of hub turn area under rotating conditions. Heat transfer with
Furlani et al. 19 investigated the effects of rotation and buoyance forces inside a triangular channel. The Reynolds number is 10,000, rotation numbers ranges from 0 to 0.6, and buoyancy numbers quale to 0, 0.08, and 0.7. In his work, PIV is used to capture the flow field in the channel. They found that on the cross-section, rotation-induced secondary flows turned out to be strongly symmetric and characterized by a single main vortex. Buoyancy forces have only marginal effects that result in increased velocity peaks.
Recently, Mayo et al.,20–22 from von Karman institute for fluid dynamics (VKI), investigated the detail characterization of the flow and heat transfer distribution in a rotating ribbed channel with time-resolved particle image velocimetry and TLC. The wall with ribs was leading side when the channel rotating clockwise and trailing side when rotating counter-clockwise. Due to the visualizing test technology, they obtained the detail distribution of flow and heat transfer between the sixth and seventh ribs, which was really helpful for other researchers to understand the effect of rotation in the rotating channel. However, in their experiment, only the ribbed wall was heated, the other three walls were cold, which causing the distribution of heat transfer on the edge of the measured wall is not same with four wall heated. Therefore, the obtained data are not reliable comparing with the real engine boundary condition with four walls heated.
As mentioned above, heat transfer investigations in rotating channels have been investigated for decades. However, most of the investigations based on the copper plate technology are averaged heat transfer data. Detail distribution of heat transfer is needed for engine blade designers. There are some investigations11,14,15,20,21 focused on the detail 2D heat transfer, however, in their investigations, the thermal boundary conditions are not same with the real engine blade, which is a critical factor on heat transfer. 13 The empirical 2D heat transfer data with the four walls heated (similar to the real engine blade) is not only useful for engine blade designers but also useful for validation of computational fluid dynamics (CFD). This work will introduce a new setup with four transparent heated walls, on which the visualizing test technology, such as TLC and PIV, can be used. This article also measured the detail distribution of heat transfer on the leading and trailing surface with TLC, and a new detail method of the TLC measurement will be shown in this work. The Reynolds number ranges from 15,000 to 30,000, and the rotation number ranges from 0 to 0.359. The heat transfer data will be an important thermal boundary condition for our future work focusing on the velocity measurement with PIV.
Experimental setup and measure procedure
Rotating facilities
A schematic of the rotating facility is given in Figure 1, which has been mentioned in our previous work. 23 The rotating facility consists of a 1-m diameter disk, where all test sections and data acquisition modules are mounted. The rotating frame is driven by a direct current (DC) motor. In the facility, the coolant air, provided by a blower, passes through a flow meter and then transports to the rotating facility via a rotary joint. After that, the air traverses along the vertical hollow shaft. Before entering the test section, the air passes through a settle chamber (Screen & Honeycomb), which is used to smooth the inlet air of the test section. At the outlet of the test section, a screen is used to decrease the effect of the outlet reverse flow. A balance weight is fixed on the opposite side of the disk to ensure the balance of the rotating system. Due to the good balance of the facility and low rotating speed, the vibration of the facility is very small. Thermocouples are used to measure the temperature on the rotating frame. All the cold ends of thermocouples are placed on the aluminum-made rotating disk. Due to the good performance of thermal conductivity of aluminum, the temperature of the disk is relatively constant and even. The absolute temperature of the rotating disk is measured by a thermal resistance. The analog signals of the thermocouple are converted into digital ones before transmitted to the non-rotating facilities by signal slip rings. The heating slip ring is used to provide the heavy current (up to 2 A) for heating the channel.
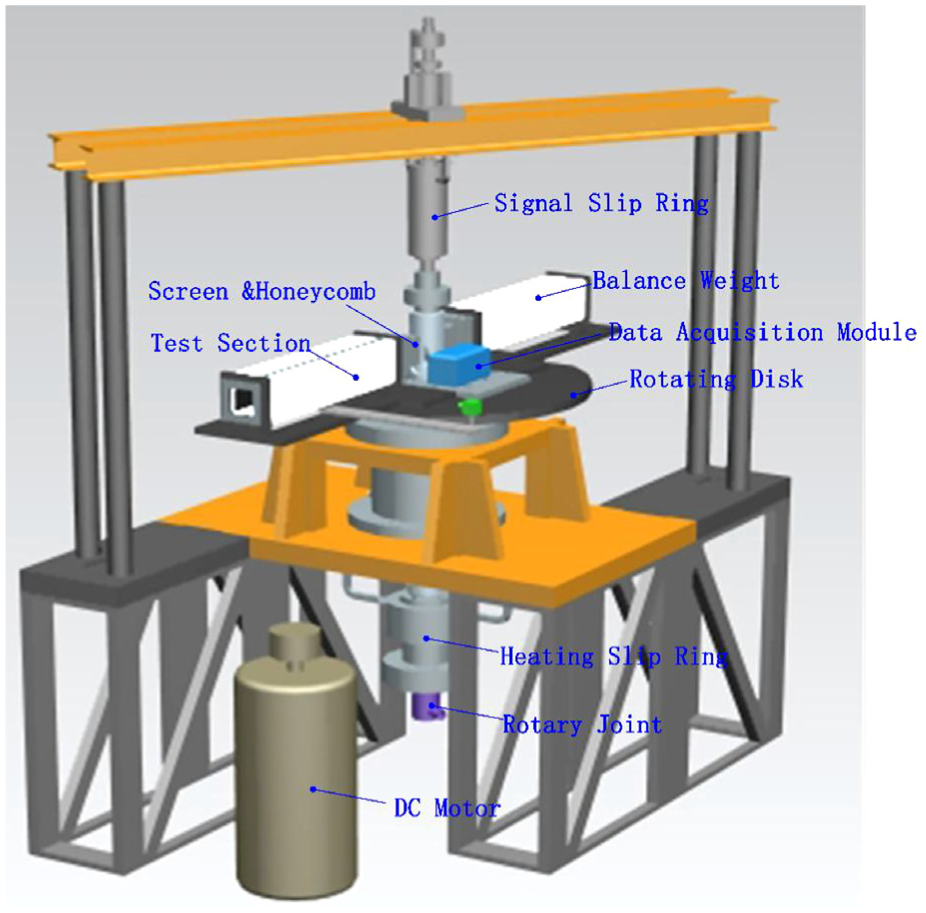
Rotating facility.
Test section
The dimension of test channel is shown in Figure 2 and the experimental variables are shown in Table 1. The square cross-section channel is 700 mm long and is manufactured from Plexiglas. Four Plexiglas walls with 15 mm thickness were formed a dismountable channel, and the internal size of the channel is 80 mm × 80 mm. At the inlet of the channel, there are screens and honeycombs to smooth the inlet air of the test section; this method can control the turbulence intensity less than 1% at the entrance. 23 To make the boundary layer transition happen earlier, 2-mm high trip wires are fixed at the distance of 50 mm from the inlet of the channel on the four sides in the channel. At the outlet of the channel, a screen is used to decrease the effect of backflow at the outlet.

Test section.
Ranges of the experimental variables.

To provide the heat flux, four 1-mm-thick thin film indium tin oxide (ITO) heater glasses are pasted on each inlet side of the channel walls by ultraviolet (UV) light cure adhesive. As the width-to-thickness ratio of each ITO heater glass is 1/80, the one-dimensional (1D) wall conduction is permitted and the conductive heat flux through the ITO heater glass is negligible. 12 The coating thickness of ITO heater glass is nominally 1350 ű4% and the light transmittance can be up to 84% at the visible wavelength of the visible spectrum, according to the manufacturer, Guangdong Jimmy Glass Technology Limited. With these coatings, the heater glass can operate up to 300°C. In the experiment, the coating is heated to around only 50°C; therefore, there is no noticeable change about the transmission of light, and the change of the resistance within 1%. The total size of the ITO heater glass is 80 mm × 700 mm. At each side of the ITO heater glass, 6-mm-long conductive tapes are used between the ITO heater glass and 15-mm-thick Plexiglas to provide the uniform electrical contact without disturbing the flow in the channel. Due to the install of conductive tapes, the actual length of the heated wall is 600 mm. Therefore, there is 50 mm long on each end of the wall without heating. Heat insulation shims are used to decrease the conductive loss from heated part to cold part at each end of the wall between the channel and support device. Four adjustable resistors are in series with each ITO heater glass, and the four ITO heater glasses in series with their adjustable resistors are in parallel, the heat flux of each ITO heater glass can be controlled by the independent adjustable resistor. In this work, the four ITO heater glasses were adjusted with the same heat flux to provide the symmetrical heat flux boundary condition for the four walls. A 10-mm-thick air chamber, made by Plexiglas and placed outside of the channel, is used as the heat insulator layer to decrease the heat loss of the channel. In order to reduce the additional heat loss of angle area, four thermal insulation material strips are used on the corner of the channel in the air chamber without obstructing the light of the channel. The transparent channel can simulate the constant heat flux walls without obstructing light, which can be used for some measurements based on visualizing test technology. With this transparent channel, PIV and TLC can be used to investigate the detail flow and heat transfer in the rotation channel.
TLC measurement
In this work, steady-state TLC method is used to measure the wall temperature. Wide-band liquid crystal (R40C20W) and black paint (SPBB) provided by Hallcrest are used to obtain temperatures on leading and trailing surfaces. Figure 3(a) shows the total calibration device of the liquid crystal. The device consists of a digital camera (3264 × 2448 pixel), two light-emitting diode (LED) illuminants, and one wall covered with liquid crystal on the surface. All the equipment are installed on the rotary disk. Two LED illuminants, put on the outside of the air chamber, can provide symmetrical light on the measured surface. The camera has a data memory of 8 GB, which can record the image during the experiment. Since the experiment is carried out at thermal-steady state, two thermocouples are used to monitor the stability of the heated wall, and a Bluetooth-baseband controller is used to control the exposure of the camera when the channel is thermo-stable. In Figure 3(b), a new designed copper-based calibration device is used to calibrate the liquid crystal. The calibration device consists of a silicone heating film and a copper plate. Due to the good thermal performance of the copper plate, the difference of temperature on the whole copper wall is less than 0.3°C, monitoring by 15 thermocouples embedded in the 5-mm-thick copper plate. The uniform surface temperature method is used to calibrate the liquid crystal, 24 and the calibration surface is heated with an increments of 1°C. With the 60° angle of view, the camera can record the whole image of the measured wall. It is clear that the angle of view has an important influence of the liquid crystal; therefore, a pixel-level calibration method is used to eliminate the error of liquid crystal caused by angle of view. The image of the measured surface has a pixel of 2925 × 390, and due to the same temperature on the copper plate, the temperature of each pixel about the measured wall can be obtained. The hue value is used to calibration the relationship with temperature. When calibrating the hue–temperature relationship, each pixel has a calibration curve, which can eliminate the error caused by difference of the view of angle and light source. The MATLAB’s RGB2HSV function (RGB means the Pixel values of Red, Green and Blue respectively, and HSV means the hue, saturation, value) is used to get the hue values, and the values are all normalized to a scale of 0–255. The RGB2HSV function used the following algorithm to calculate the hue

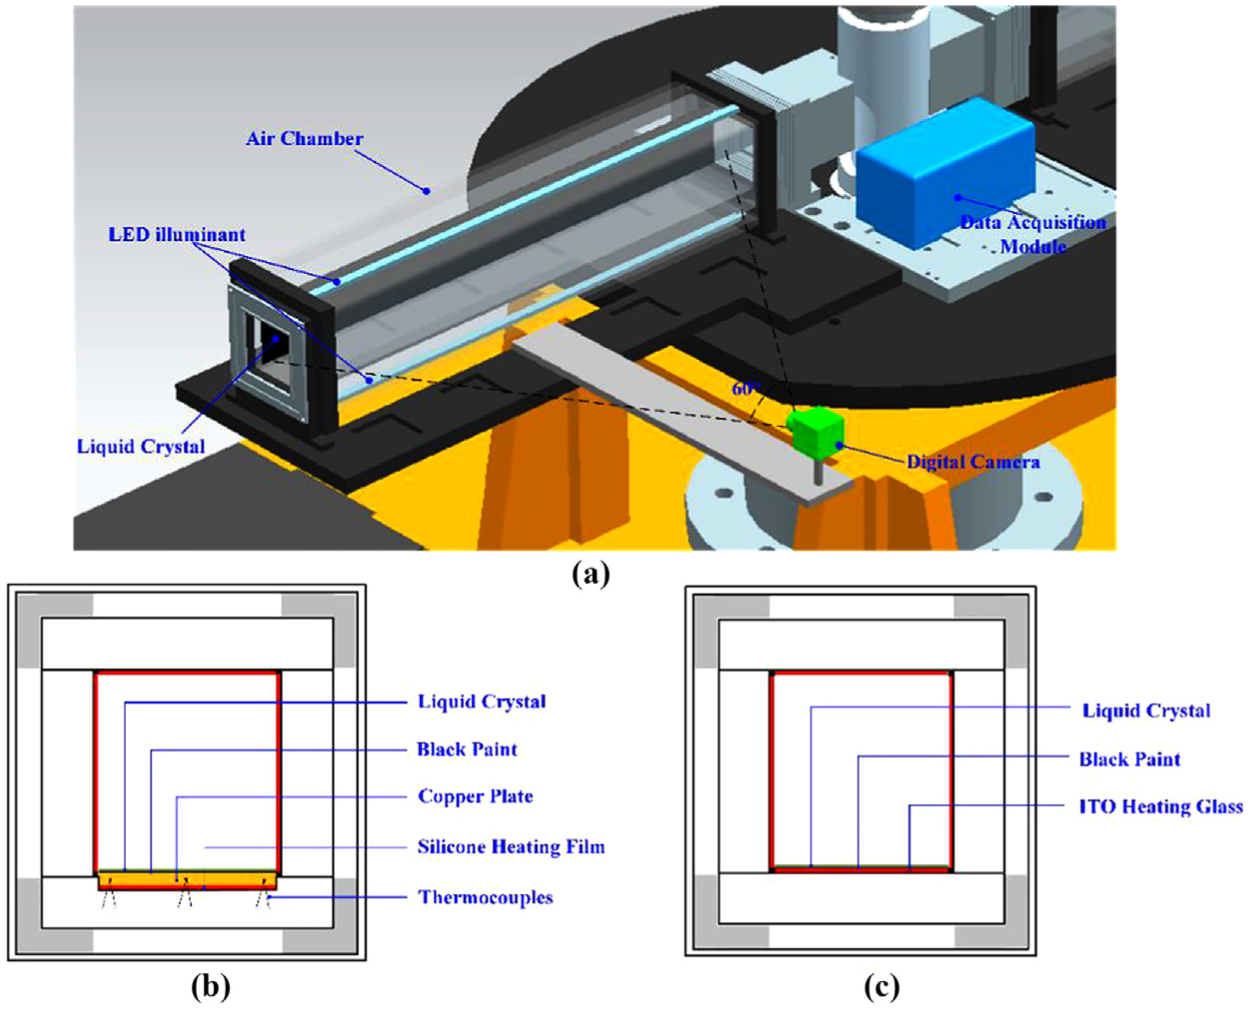
Calibration device of liquid crystal: (a) total calibration devices, (b) copper-based calibration device, and (c) ITO-based measurement device.
RGB is the Pixel values of Red, Green, and Blue, respectively. Max and min are mathematical operators, which means maximum and minimum, respectively.
Many researchers have recommended another algorithm to calculate the hue value21,24

In most of the cases, the hue values calculated by the RGB2HSV function and equation (2) are approximately equal to each other based on the published experimental results. 25 In this work, we use equation (1) to calculate hue value.
Figure 3(c) shows the spraying coating on the test surface. In the experiment, the calibration method is no in-situ; therefore, the calibration plate and the test section were painted with the same sample of TLCs at the same time in order to avoid any error resulting from the hue dependence with respect to the coating thickness and TLC preparation.
In this work, since different pixel has different calibration plot. We cannot present all the calibration plots. We just present the calibration curve at the center position of the measures surface to show the characteristic of TLC used in this work. In Figure 4, the calibration curve is fitted to a fifth-order polynomial to make sure the R2 > 0.99.

Typical calibration curve for the TLC measurements at the center position of the measured surface.
Data reduction
Velocity profile and turbulent intensity (Tu) are important for the heat transfer in the channel, which depends mainly on the settle chamber (Screen & Honeycomb) at the inlet of the channel. In this work, settle chamber is same with the work in Wei et al., 23 in which the velocity and Tu data are measured by hot wires. The Reynolds number in Wei et al. 23 is 18,391; therefore, the velocity profile and Tu data can be a useful reference. Figure 5 shows the velocity profile and Tu data in Wei et al. 23 Due to the inlet settle chamber, the Tu data of the main flow are less than 1%.

The velocity profile and Tu data in Wei et al. 23
The local heat transfer coefficient (h) is calculated by measuring the heat flux transferred to the air flow from the ITO heated wall (qnet), the local wall temperature (Tw), and the local bulk mean temperature (Tb)

qnet is calculated by performing the energy balance of a surface element on each film heater, the Joule power generated by the ITO heater glass (qjoule) includes the heat energy transferred by conduction to the channel walls (qloss), and by convection to the fluid (qnet). Since the Plexiglas is opaque to IR radiation, the radiation loss can be ignored

The conductive loss through the heated wall is computed by assuming 1D conduction
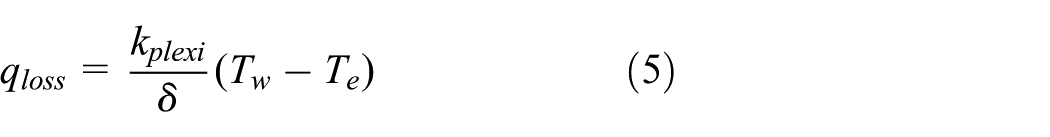
kplexi is the thermal conductivity of the Plexiglas wall (0.18 W/(m K)) and δ is the thickness of Plexiglas wall (15 mm). The inner temperature of the measured wall Tw is measured by liquid crystal, and the temperature of the outer side of the measured wall, Te is measured by 35 thermocouples glued on the outside of Plexiglas wall. Since Tw is the pixel-level local temperature, to obtain the local qloss, Te is also the local temperature by fitting the temperature based on the 35 thermocouples along the stream-wise and span-wise on the opposite side of the Plexiglas. The position of the thermocouples can be seen in Figure 6.
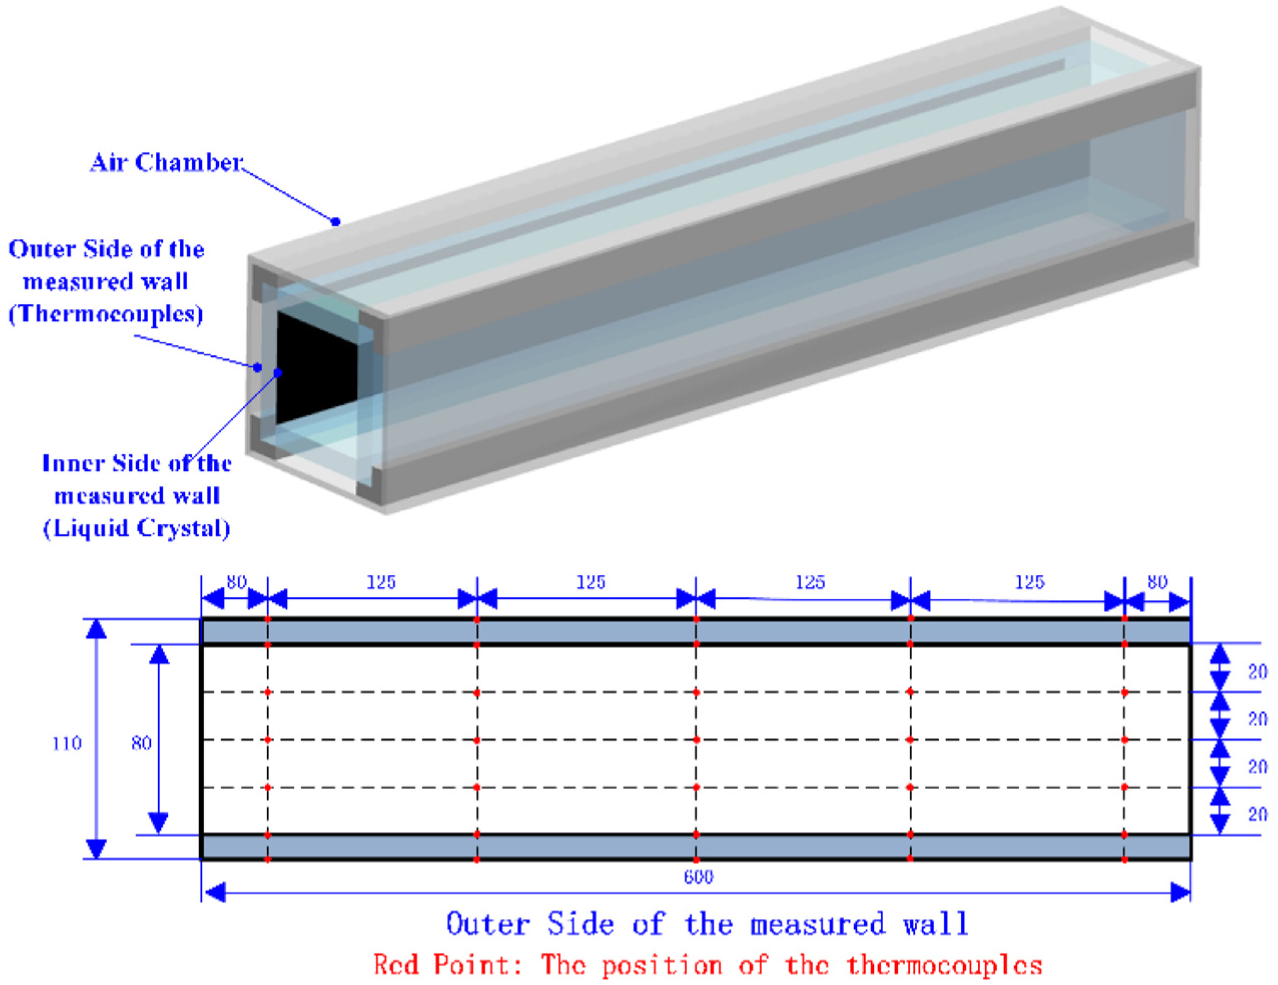
The position of the thermocouples on the outer side of the measured wall.
The local bulk temperature Tb is calculated by local energy balance method as follows
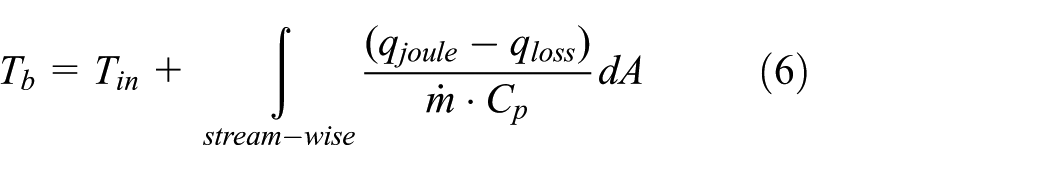
Tin is the temperature of the inlet flow,

The local Nusselt number (Nu) can be calculated by local heat transfer coefficient (h), hydraulic diameter of the channel (D), and thermal conductivity of the air flow (kf).
All the experimental data are recast in term of dimensionless form, introducing Reynolds number (Re) and rotation number (Ro) as followed


where ρ is the density of the air flow, U is the mean average velocity of air flow, D is the hydraulic diameter of the channel, μ is the viscosity of air flow, A is the surface area of the heated wall, Ω is the rotational speed, and r is the position of the radius of the measured position.
The Dittus-Boelter/McAdams correlation is used to provide a basic comparison. The Dittus-Boelter/McAdams is used to calculate the Nusselt number (Nu0) for fully developed turbulent flow through a smooth stationary pipe. Thus, the heat transfer enhancement (Nu/Nu0 ratio) is given as (Prandtl number (Pr) = 0.71)

Uncertainty analysis
According to error transfer theory, the data uncertainty is estimated by the method offered by Kline and McClintock. 26 In this work, the uncertainty of the dimensionless parameters Re, Ro, and Nu are discussed.
In the experiment, the uncertainty of the thermocouples is ±0.1°C, and the uncertainty of the flow meter is ±2%. A field-programmable gate array (FPGA) module is used to measure the rotating speed, which gives the accuracy of the angle of 0.0038° and that of the time is 20 ns. The FPGA module gives the uncertainty of the rotation speed of
For Nu, the uncertainty of the wall temperature provided by the TLC and the qloss should be paid more attention. The uncertainty of the wall temperature comes from the determination of the relationship between the hue and the temperature. As mentioned above, in order to avoid any error resulting from the hue dependence with respect to the coating thickness and TLC for the hue, the calibration plate and the test section were painted with the same sample of TLC at the same time. What’s more, when calibrating the TLC, the pixel-level method was used, which eliminate the error causing by the view of angle, light source. Hysteresis effects are not expected since the temperature of the coating did not exceed the maximum working temperature of the TLC. And, the TLC will be changed and then the re-calibrating is repeated to eliminate the effect of aging within 4 h. The main uncertainty of the TLC comes from the error of the fitted curve of each pixel. There are around 1.14 million hue–temperature relation curves. When fitting the relation curve, the error can be reduced if the number of portions is increased; in this work, 20 sample temperature points are used to fit the fifth power relation curve for every pixel, and the maximum uncertainty is about ±0.5°C. It is impossible to avoid the vibration of the channel under rotating condition, which will change the relative position between the camera and the measured surface. Thanks to the low rotating speed and good balance of the rotation rig, the vibration is not serious in the experiment. For the maximum rotating speed, the relative movement between the camera and measured surface is less than 5 pixels. In order to eliminate the relative movement, a mark is used on the measured surface, which can help us to measure the same position of the surface and using the pixel’s relation curve.
When calculating qloss, the heat loss transferred from the 15-mm-thick Plexiglas is assumed as 1D conduction. However, the heat conduction in the 15-mm-thick Plexiglas is a three-dimensional (3D), which causes the uncertainty of qloss. In this work, we define the uncertainty of the qloss is the ratio between the total heat flux along the direction of stream-wise and span-wise with the qloss. Equation (11) shows the calculation of the uncertainty of the Nu. The maximum about the uncertainty of the Nu is 6.3%. The detail uncertainty of the qloss and Nu for each Reynolds numbers and rotation numbers can be seen in Tables 2 and 3 in Appendix 2

Results and discussion
Data validation
Figures 7 and 8 show the 2D temperature and Nusselt number distribution on the whole surface with Re = 15,000, 20,000, 25,000, and 30,000 under static conditions. In Figure 7, the temperature on the surface is controlled within the limited work condition of the TLC (40°C–60°C). Due to the coolant air in the channel, the temperature on the edge of the channel wall is lower than that on the middle of the channel wall. The temperature increases along the stream-wise direction. In Figure 8, the trend of the Nusselt distribution is reverse with the distribution of temperature in Figure 7. The Nusselt number is higher in the inlet of the channel, and decreases along the stream-wise direction in the channel.

Two-dimensional distribution of temperature on the surface in the static conditions at different Reynolds numbers.

Two-dimensional distribution of Nusselt number on the surface in the static conditions at different Reynolds numbers.
Figure 9 shows the comparison of the Nu along the channel wall between this work with Liou et al.’s 15 work (Re = 20,000, D = 32.17 mm) and Azad et al.’s 27 work (Re = 10,000, 25,000, D = 16.9 mm) in static conditions. From Figure 9, it can be seen that the Nu in this work fits well with that of the Liou et al. 15 along the whole channel. It is easy to see that the trend of the Nu along the channel in this work is same with that in the Liou et al. 15 and Azad et al. 27 What’s more, the detail distribution of the temperature and Nu in Figures 7 and 8 shows the receivable trend; therefore, the data in this work are reliable.

2D distribution of Nu/Nu0 ratio
In a rotating channel, rotation has an important effect on the heat transfer on the trailing and leading surfaces. The results presented in this section are expressed as Nu/Nu0 to discuss the effect of rotation. Figure 10 shows the 2D distribution of the Nu/Nu0 on the leading and trailing surfaces at different Reynolds numbers and rotation numbers. Along the stream-wise direction, the Nu/Nu0 ratio decreases on both leading and trailing surfaces. However, on the span-wise direction, the trend of Nu/Nu0 ratio is different between the leading and trailing surfaces.

The two-dimensional distribution of Nu/Nu0 on the leading and trailing surfaces at different rotation numbers.
On trailing surface, the Nu/Nu0 at the edge area of the wall surface (Z/D = 0 and Z/D = 1) is lower than that at the middle area (Z/D = 0.5) at all rotation radius, and the difference increases with the increase in rotation numbers and Reynolds numbers. On leading surface, the Nu/Nu0 ratio is almost same along the span-wise directions at lower rotation radius (X/D = 2, 3, 4) for different Reynolds numbers. With a higher rotation radius (X/D > 5), the Nu/Nu0 at the edge area (Z/D = 0 and Z/D = 1) is lower than that at the middle area (Z/D = 0.5) at lower rotation numbers, while higher than that at the middle area (Z/D = 0.5) with higher rotation numbers for different Reynolds numbers. The phenomenon is attributed to the secondary flow in the channel.
Figure 11 shows the sketch of the rotation-induced secondary flow in a rotation channel. 28 The flow impinges to the middle area of trailing surface, and reverses from surface at the edge area of the trailing surface, which caused the Nu/Nu0 is higher at around Z/D = 0.5 than that at Z/D = 0 and 1. The larger rotation radius or the larger rotation number is, the higher difference of the Nu/Nu0 between the middle and edge area arises. On the trailing side, secondary flow reverses from the surface at Z/D = 0.5 and impinges to the surface at Z/D = 0 and 1, that is the reason why the trend of distribution on the span-wise direction reverses between the leading and trailing sides shown in Figure 9.

Sketch of secondary flow in a rotating channel. 28
The distribution of Nu/Nus ratio
The distribution of Nu/Nus ratio along the leading and trailing walls at different Reynolds numbers is shown in Figure 12. Rotation enhances the local heat transfer on the trailing side, and decreases the local heat transfer on the leading side. On the trailing side, the Nu/Nus ratio is increasing with the increase in X/D, except for area close to the outlet. There is a slight decrease in the area close to the outlet, and this is due to the outlet effect. The effect of the outlet weakens with the increase in the Re. On the leading side, the Nu/Nus weakens along the stream-wise. There is a slight increase in Nu/Nus (which has been also called critical point 10 ) at different X/D for different Re and Ro, which has also been found by many researchers.10,11 Bons and Kerrebrock 11 attribute the critical point of heat transfer to the reverse flow in the boundary layer on the leading side. He draws the conclusion by the strongly disorder stream-wise profile in his experiment using PIV. However, the paper of Bons did not find the reverse flow precisely. Since the buoyancy effect is increase with rotation number, in this work, the critical point arises with the increase in rotation number at the position of X/D = 4 or 5. This phenomenon is an important reference for us to investigate the flow field in the future work with PIV.
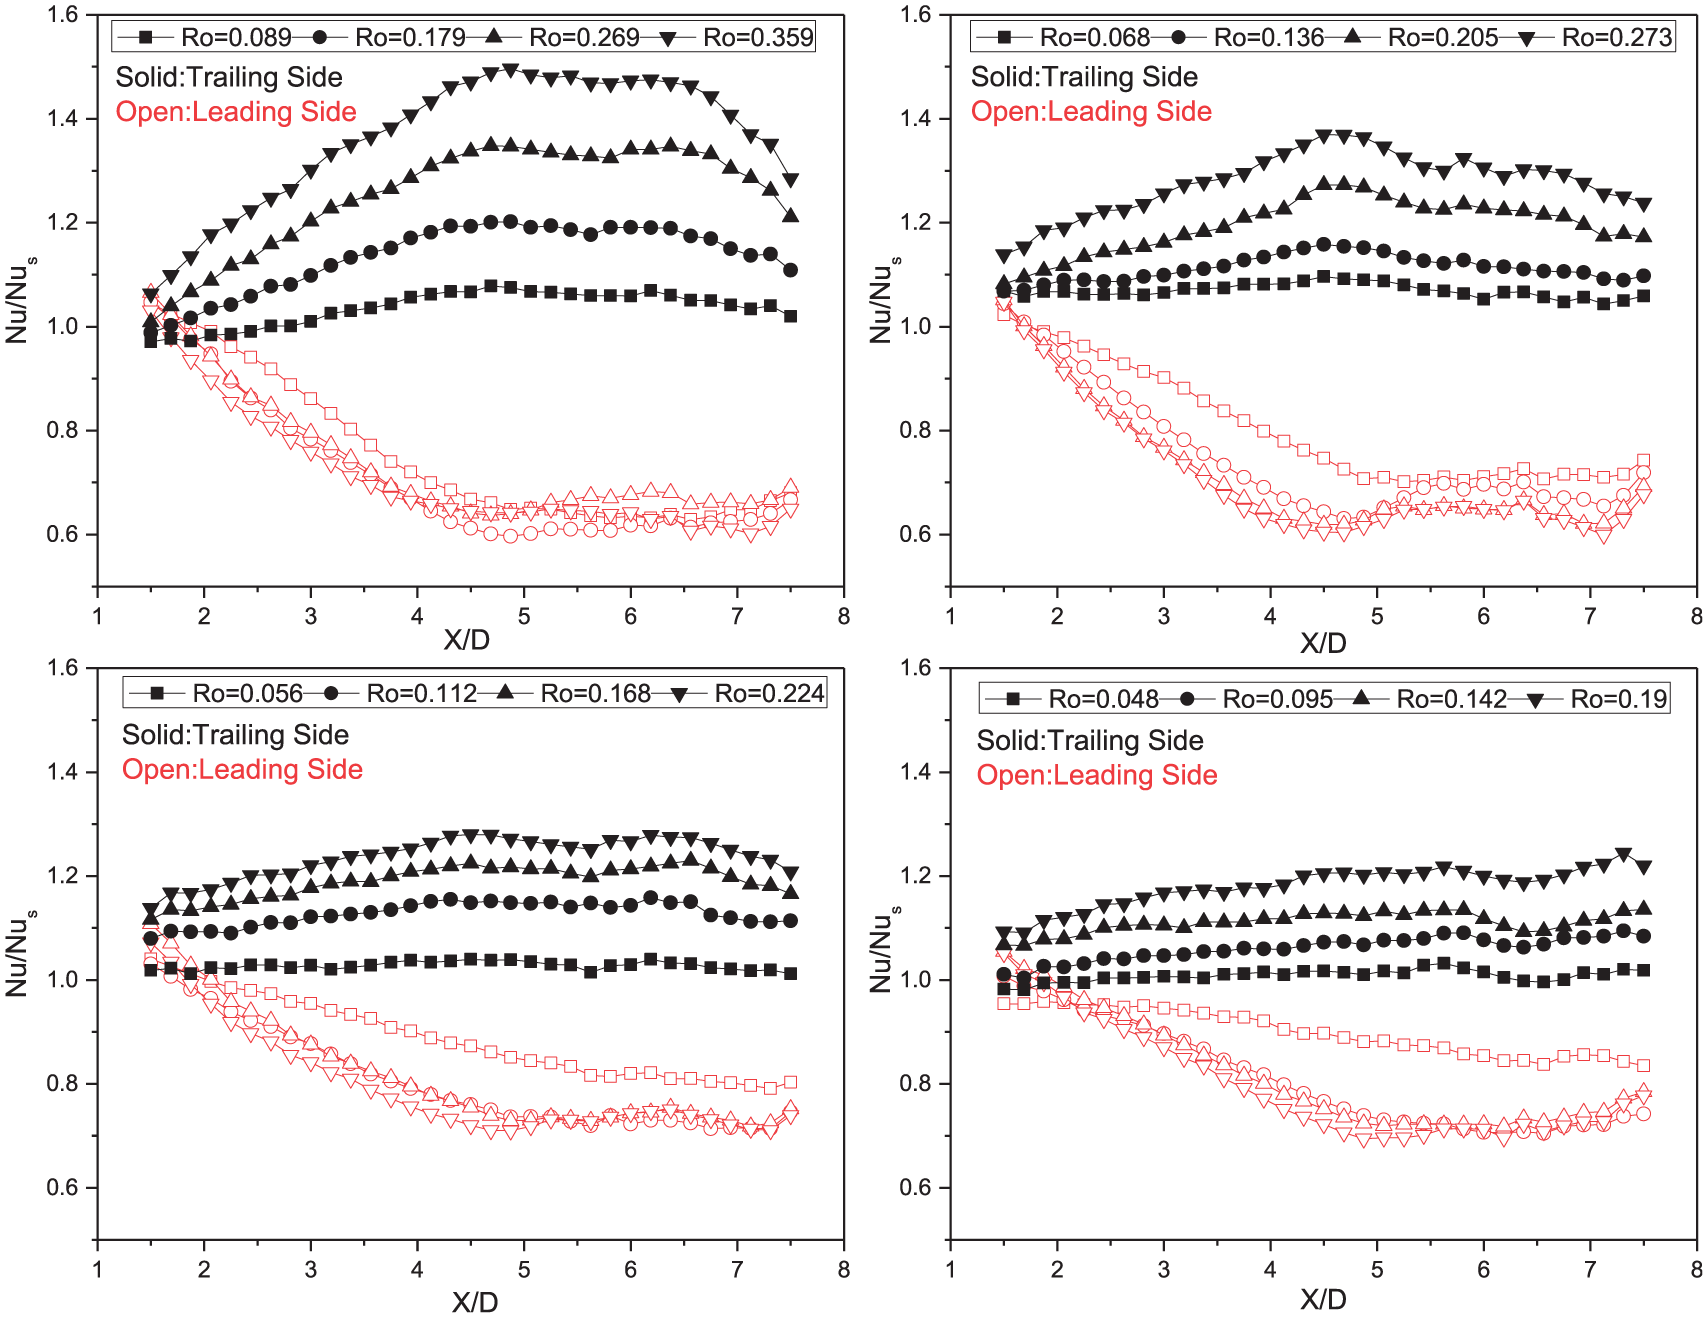
The distribution of Nu/Nus ratio along the leading and trailing walls.
The distribution of
ratio
Figure 13 shows the

In a rotation channel, rotation-induced secondary flow changed the flow and heat transfer. In order to illustrate the effect of rotation on the averaged heat transfer, Figure 14 shows the averaged

The averaged
The effect of buoyancy number
In a rotation channel, the centrifugal buoyancy effects cannot be ignored especially when the rotation effects are evident. The buoyancy number (Buo) is always employed to quantify the strength of buoyancy force. In this study, Huh et al.’s 29 method was followed to study the effect of buoyancy number. According to the definition of Buo

According to Figure 15, the

The averaged
Conclusion
An experimental study was undertaken in a smooth rotating channel on a new setup with four wall heated by TLC. The experiments were performed with Re = 15,000, 20,000, 25,000, 30,000 and rotation number Ro ranges from 0 to 0.359. 2D distribution of Nu on the leading and trailing sides was obtained. According to the results, the conclusion can be drawn as follows:
The new setup with four wall heated can be well used for simulating the internal cooling channel with TLC. The 2D distribution of Nu along the stream-wise and span-wise direction of the whole surface with four wall heated is first obtained experimentally, which can be used for understanding the detail of heat transfer in the channel walls and validation of the CFD.
The distribution of Nu/Nu0 on the span-wise shows the different trend between the leading and trailing sides. On the leading surface, the Nu/Nu0 at the edge area of the wall surface (Z/D = 0 and Z/D = 1) is higher than that on the middle area (Z/D = 0.5) at high rotation numbers. On the trailing surface, the Nu/Nu0 at the edge area (Z/D = 0 and Z/D = 1) is lower than that at the middle area (Z/D = 0.5). What’s more, the trend is more obvious with the increase in the rotating radius.
Rotation-induced secondary flow enhances the heat transfer on the trailing side and decreases the heat transfer on the leading side. On the trailing side, the Nu/Nus in increasing along the stream-wise direction. On the leading side, there is a turning point of heat transfer at different rotation numbers. In this work, the turn point is at about X/D = 4–5 at all Reynolds numbers and rotation numbers. This phenomenon is an important reference for us to investigate the flow field in our future work with PIV.
The averaged
The buoyance effects on averaged heat transfer are enhanced with the increase in rotation numbers. The extensive variation of buoyancy number attributes to the change in rotation numbers.
Footnotes
Appendix 1
Appendix 2
Handling Editor: Takahiro Tsukahara
Declaration of conflicting interests
The author(s) declared no potential conflicts of interest with respect to the research, authorship, and/or publication of this article.
Funding
The author(s) disclosed receipt of the following financial support for the research, authorship, and/or publication of this article: This work is financially supported by the Academic Excellence Foundation of BUAA for PhD students.