
Abstract
This article proposes an advanced far-field acoustic hologram for vehicle sound source identification and investigates a method of performing contribution analyses in the far field. The hologram is applied for statistically optimized near-field acoustic holography used to identify vehicle sound sources (internal and external). An advanced far-field acoustic hologram is first proposed to improve the spatial resolution of low-frequency sound source locations in the far field. In addition, an acoustic contribution analysis based on near-field acoustic holography is used to provide a direction for low-noise optimization design. Next, a new sound source identification and low-noise technology is explored via the aforementioned methods and applied for sound source identification and acoustic contribution analyses for a vehicle. The analysis results showed that in the process of sound source identification, the contribution of each sound source can be simultaneously sorted, and this finding can help guide research on the low-noise control of a vehicle.
Keywords
Introduction
Exposure to environmental noise can have a number of adverse health effects. Noise associated with road traffic is a particular public health concern because it is pervasive and increasing. 1 In particular, an excessive amount of pass-by noise generated by vehicles during different day and night periods is highly disruptive to residents living along highways and major roads.2,3
NVH (noise, vibration, and harshness) investigations help improve the noise and vibration characteristics of vehicles.4,5 An effective method of ensuring low vehicle noise levels is to reduce the noise of each sound source; therefore, sound source identification is an important aspect of NVH, and contribution analyses of sound sources have a direct influence on the vehicle NVH performance. 6 Sound source identification methods can be broadly divided into three categories: the first category is a traditional sound source identification method, such as the running method, the covering method, and the numerical analysis method;7,8 the second category uses the modern signal processing technology to conduct sound source identification, such as the sound intensity method; 9 the third category uses modern image recognition technology to conduct vibration and sound source identification, such as acoustic array technology (e.g. acoustic holography technology and beam-forming technology). 10 Compared with the aforementioned methods, acoustic array technology has advantages that include simple test operations and high identification efficiency, and it can also be used in quantifying analyses of sound sources.11,12
At present, the application of acoustic array technology for vehicle sound source identification has considerable progress; nevertheless, acoustic array technology remains difficult to develop because of a number of problems. For example, far-field acoustic holography and beam-forming technology present problems with low spatial resolution. As a result, the numerical simulation method is adopted in the majority of acoustic contribution analyses; however, this method cannot truly reflect the vehicle vibrations and noise characteristics under actual working conditions. 13 The acoustic field on one side of the holographic surface must be free when applying spatial transformations to sound fields based on near-field acoustic holography (NAH) 14 and statistically optimized near-field acoustic holography (SONAH). 15
The above-mentioned questions will be clarified in this article. An advanced far-field acoustic hologram is first proposed to improve the spatial resolution of low-frequency sound sources located in the far field. In the next section, the acoustic contribution analysis method based on a wave superposition algorithm and SONAH is presented. The wave superposition algorithm is used to reconstruct acoustic pressures on a reconstruction surface to provide the direction for the optimization design of low noise. SONAH is used to separate the acoustic quantities produced by sources on one side of a holographic surface. Exterior sound source identification using the advanced far-field acoustic hologram is verified by comparing the identification accuracy to that of the traditional far-field acoustic hologram. Interior sound sources are identified via sound pressure reconstructions and reactive sound intensity reconstructions. Next, sound field predictions via particle velocity are verified by the experimental results.
Materials and methods
Statistically optimized near-field acoustical holography
SONAH was originally derived in a planar formulation by Steiner and Hald, 16 and then, Hald 17 proposed a simpler approach capable of accommodating situations in which the measurement aperture size is limited because of physical necessity or to reduce measurement efforts. In the SONAH procedure, the surface-to-surface projection of the sound field is performed using a transfer matrix defined in such a manner that all propagating waves and a weighted set of evanescent waves are projected with optimal average accuracy (i.e. no spatial Fourier transforms are performed). 13 In this manner, the requirement extension of the measurement surface well beyond the source region can be eliminated without compromising the accuracy of the procedure.
Figure 1 shows the position of the holographic surface and the sound source surface; the holographic surface is composed by N measurement points, and
where

SONAH application.
The wave superposition algorithm is a sound field reconstruction algorithm that is suitable for a full frequency band. The principle of the algorithm is as follows: a series of equivalent sound sources are collocated inside a radiator, and the original sound field can be substituted with a field radiated by these equivalent sound sources.
According to the wave superposition algorithm, equation (1) can be converted to the linear expression of the plane wave function

where A is the elementary plane wave function matrix of the point on the holographic surface to the point on the reconstructed surface;
Using the same method, the particle vibration component velocities along the x-axis, y-axis, and z-axis as well as the three-dimensional (3D) acoustic intensity on the reconstructed surface can be obtained by measuring the sound pressure, which is located at a random position in a free sound field.
A far-field acoustic hologram limited by the Rayleigh criterion has a low resolution. The loss of the evanescent wave reduces the ability of the far-field acoustic hologram to describe the details of texture information and eliminates the ability of the hologram to reconstruct true amplitudes and phases of the sound pressures. In contrast, the NAH has a high resolution and can describe subtle changes in the sound field; thus, it can reconstruct the real amplitudes and phases of sound pressures. The NAH is a powerful technique for identifying sound sources and visualizing acoustic field, and its high resolution is associated with the use of evanescent waves, which contain a considerable amount of detailed information on the acoustic field. Although the NAH provides considerable information, the costs associated with measurements and calculations are high, and its applicable frequency range is also restricted. However, the measurements and calculations of the far-field acoustic hologram technique are convenient. A beam-forming technique has been developed, and it represents a preliminary implementation of the former. The beam-forming technique is a simple acoustic algorithm that has been applied broadly in engineering. Because the technique involves a far-field measurement, its resolution is poor. The feasibility and effectiveness of beam forming are verified by a simulation and experiment of abnormal sound source identification. The beam-forming technique has a low resolution and is not suitable for identifying small and continuous sources emitting a low-frequency noise.
The advantage of using the NAH is that it can obtain the evanescent wave, which reflects the sound field spatial characteristics within the near-field range. The NAH improves the resolution of sound source reconstructions in the near-field range. For occasions that are not suitable for near-field measurements, this research study will use an advanced far-field acoustic hologram to identify a low-frequency band sound source in the far field. The reconstruction process is shown in Figure 2.

Reconstruction process of the improved far-field acoustic holography method.
Statistical optimal beam-forming theory
The spatial resolution of the traditional delay-sum beam-forming technique relies on the wavelength, which reduces the sensitivity to sound sources in a low-frequency band. The algorithm of statistical optimal beam-forming theory (SOBT) is used to optimize the focusing process, and it has greatly increased the spatial resolution of sound source identification and enabled obvious improvements in sound source localization in low-frequency bands.18,19
According to the delay-sum beam-forming algorithm, the focus position sound pressure on the focal plane can be expressed as follows

where

where, A = aH and S = (AAH+θI)−1.
The results of multiple beam formers reflect the convolution of the sound source and response function of array beam forming. Sound source localization depends on the array geometry, array size, and analysis frequency band. Because of limitations in resolution accuracy, the real sound source position may be misidentified.
In the disconsolation approach for mapping acoustic sources as a post-processing technology, multiple iterations of the beam-forming array output are performed to obtain the real sound source distribution of the sound source position focus point. This approach can avoid the uncertainty of sound source localization, improve sound source resolution, and suppress lobe signals.
Interior sound source identification method in the low-frequency band
The interior sound field can be classified as an active original sound source and a reflected sound field. The traditional NAH is applicable only for testing in a free field when applied to the identification of an interior sound source; however, a pseudo sound source may be generated, which could result in misidentification. Therefore, the reflected field must be eliminated or converted to a free sound field. This research study assumes that the reflective surface and the sound source surface are perpendicular or parallel, and the reflection can occur only once.
Reflective surface and sound source surface are parallel
Figure 3 shows the spatial position relationship of the sound source surface, holographic surface, and reflective surface. When the reflective surface is parallel to the sound source surface in the free sound field, the reflected sound field and direct sound field can be separated through the method of double holographic surfaces

where i is the incident sound field; r is the reflected sound field; M and N are the total number of microphones on the first and second holographic surfaces, respectively; C and D are the transfer coefficients of acoustics between two holographic surfaces, which are related to the node position on the holographic surface.

Spatial position relationship among the sound source surface, holographic surface, and reflective surface.
Reflective surface is perpendicular to the sound source surface
When the reflective surface and sound source surface are perpendicular, the reconstruction and prediction of sound fields can be analyzed according to sound image theory. 19 Figure 4 shows the sound pressure distribution and the sound source surface on the holographic surface with only one vertical reflective surface. Such a scenario will generate a large number of acoustic modes in a closed space. The sound source in the closed space can be identified using a combination of the particle velocity and the reactive sound intensity.

Sound pressure distribution and sound source surface.
SONAH-based acoustic contribution analysis
Interior noise in a vehicle consists of airborne sound that is transmitted from the body panels or pores and structure-borne sound that is caused by vibrations of the body panels. Different sound sources present different contributions to the sound pressure at any position in the vehicle. These contributions present differences in size and positive and negative impacts to the sound field.
The acoustic contribution analysis method based on SONAH can be divided into the following steps: first, perform the identification, localization, and acoustic information reconstruction of the sound source according to the measured sound pressure distribution from a holographic surface; second, conduct the sound pressure prediction to any position of the interior sound field; last, perform an acoustic contribution analysis according to the predicted far-field pressure and reconstructed sound source information. The acoustic contribution analysis method based on SONAH is suitable for structure-borne acoustics and airborne acoustics.
According to equation (1), any pressures in the sound field can be expressed as the total sound pressure of N sound source points located on the sound source surface. For any points in the sound field, the acoustic contribution of the ith sound source to the field point can be expressed as the projection of total sound pressure p located at the field point of sound pressure pi generated by the sound source at that position; thus

where |p| is the total sound pressure amplitude of the selected field point in the sound field, and pi and p are complex sound pressures expressed by the vector method.
The acoustic contribution coefficient of ith sound source can be defined as follows
Results and discussion
The experiment was conducted in an open field that approximates a semi-free field, and the environmental noise was lower than 20 dB above the vehicle-generated noise. The interior and exterior sound source identification and the acoustic contribution analysis were performed using the SONAH, SOBT, traditional, and advanced far-field acoustic hologram methods.
Experimental system of exterior sound source identification
The experimental vehicle engine idling speed is 700 r/min. To verify the accuracy of sound source identification, a speaker with a single-frequency noise was installed at the rear window position of the vehicle. The engine hatch was opened in the experiment. Six INV205T2 1/4-inch microphones which were produced by China Orient Institute of Noise & Vibration were used to perform the near-field sound pressure measurements. A 1/4-inch microphone was installed at a location near the sound source as a reference microphone, and the other five 1/4-inch microphones composed of a microphone line array system. The other five scanning 1/4-inch microphones were calibrated for the amplitude and phase using the BK Z1 10055 Sound Intensity Calibrator over the entire frequency range of interest relative to the 1/4-inch microphone previously calibrated for this level. Because of the insufficient number of microphones included in the line array-scan in the experiment, the microphone arrays are set up according to the actual conditions as follows: (5 × L) × M, where L is the row number of the line-array scan and M is the column number of the line-array scan. The reference microphone is also used for the trigger channel in the measuring process to ensure the synchronization of the measurement signal of each group line array microphone. The distances between the array microphones can be adjusted according to the specific needs of the experimental analysis, and the distance between the microphones in this experiment is 10 cm.
Exterior sound source identification using acoustic holography
Figure 5 shows the experiment system for sound source identification, which is measured in the near-field. The exterior radiation noise on the side of the vehicle and the single-frequency noise at the rear window position will be identified. Based on the vehicle size, the far-field and near-field measurements are tested with a (5 × 2) × 28 microphones array. The distance of the sound source surface and the microphone array surface (holographic surface) is 120 cm.

Experimental system for sound source identification.
The experiment was conducted with the car parked and the engine idle. From the frequency spectrogram of each microphone, the dominant characteristic frequencies can be identified for several peaks, which are 24 Hz (engine ignition frequency) and 500 Hz (speaker frequency) according to the near- and far-field acoustic hologram technology at the identified location of the sound source, respectively. The results are shown in Figures 6 and 7.

Sound source identification results at 500 Hz: (a) traditional far-field acoustic hologram, (b) advanced far-field acoustic hologram, and (c) SONAH.

Sound source identification results at 24 Hz: (a) traditional far-field acoustic hologram (b) advanced far-field acoustic hologram, and (c) SONAH.
Figures 6 and 7 show that the advance far-field acoustic hologram has better identification accuracy than the traditional far-field acoustic hologram, and it can precisely locate the sound source at the rear door and window. Moreover, SONAH also has very high identification accuracy.
Exterior sound source identification using beam-forming
This experiment used the SOBT method, and the speaker produced a single-frequency noise at 1000 Hz. The other test conditions were the same as those described above. Using a line scan, one microphone was set as a reference microphone, and a 5 × 6 microphone array surface was formed at the central position of the vehicle side. The distance between the array and the sound source surface was 1.5 m.
Based on the frequency spectrum of the sound pressure, the peak value of frequency spectrum is located at 1000 Hz (mainly the speaker-generated noise). We supplied an acoustic signal of the corresponding frequency spectrum into the program of beam-forming sound source identification and then identified the main sound source that produced the noise at this frequency. After selecting the dimensions of the reconstruction surface (1.6 m × 1.2 m), the sound source identification results under the corresponding 1000-Hz frequency can be obtained as shown in Figure 8.

Sound source identification results at 1000 Hz via SOBT.
Based on the sound source identification results obtained using the SOBT method, when post-processing was performed using the DAMAS method, the sound source location distributions were obtained with different iteration times as shown in Figure 9 (only the 5th, 20th, 50th and 100th of iterations are shown). Figure 9 shows that after many iterations, the sound source location at 1000 Hz can be precisely identified and other interfering signals were minimized.
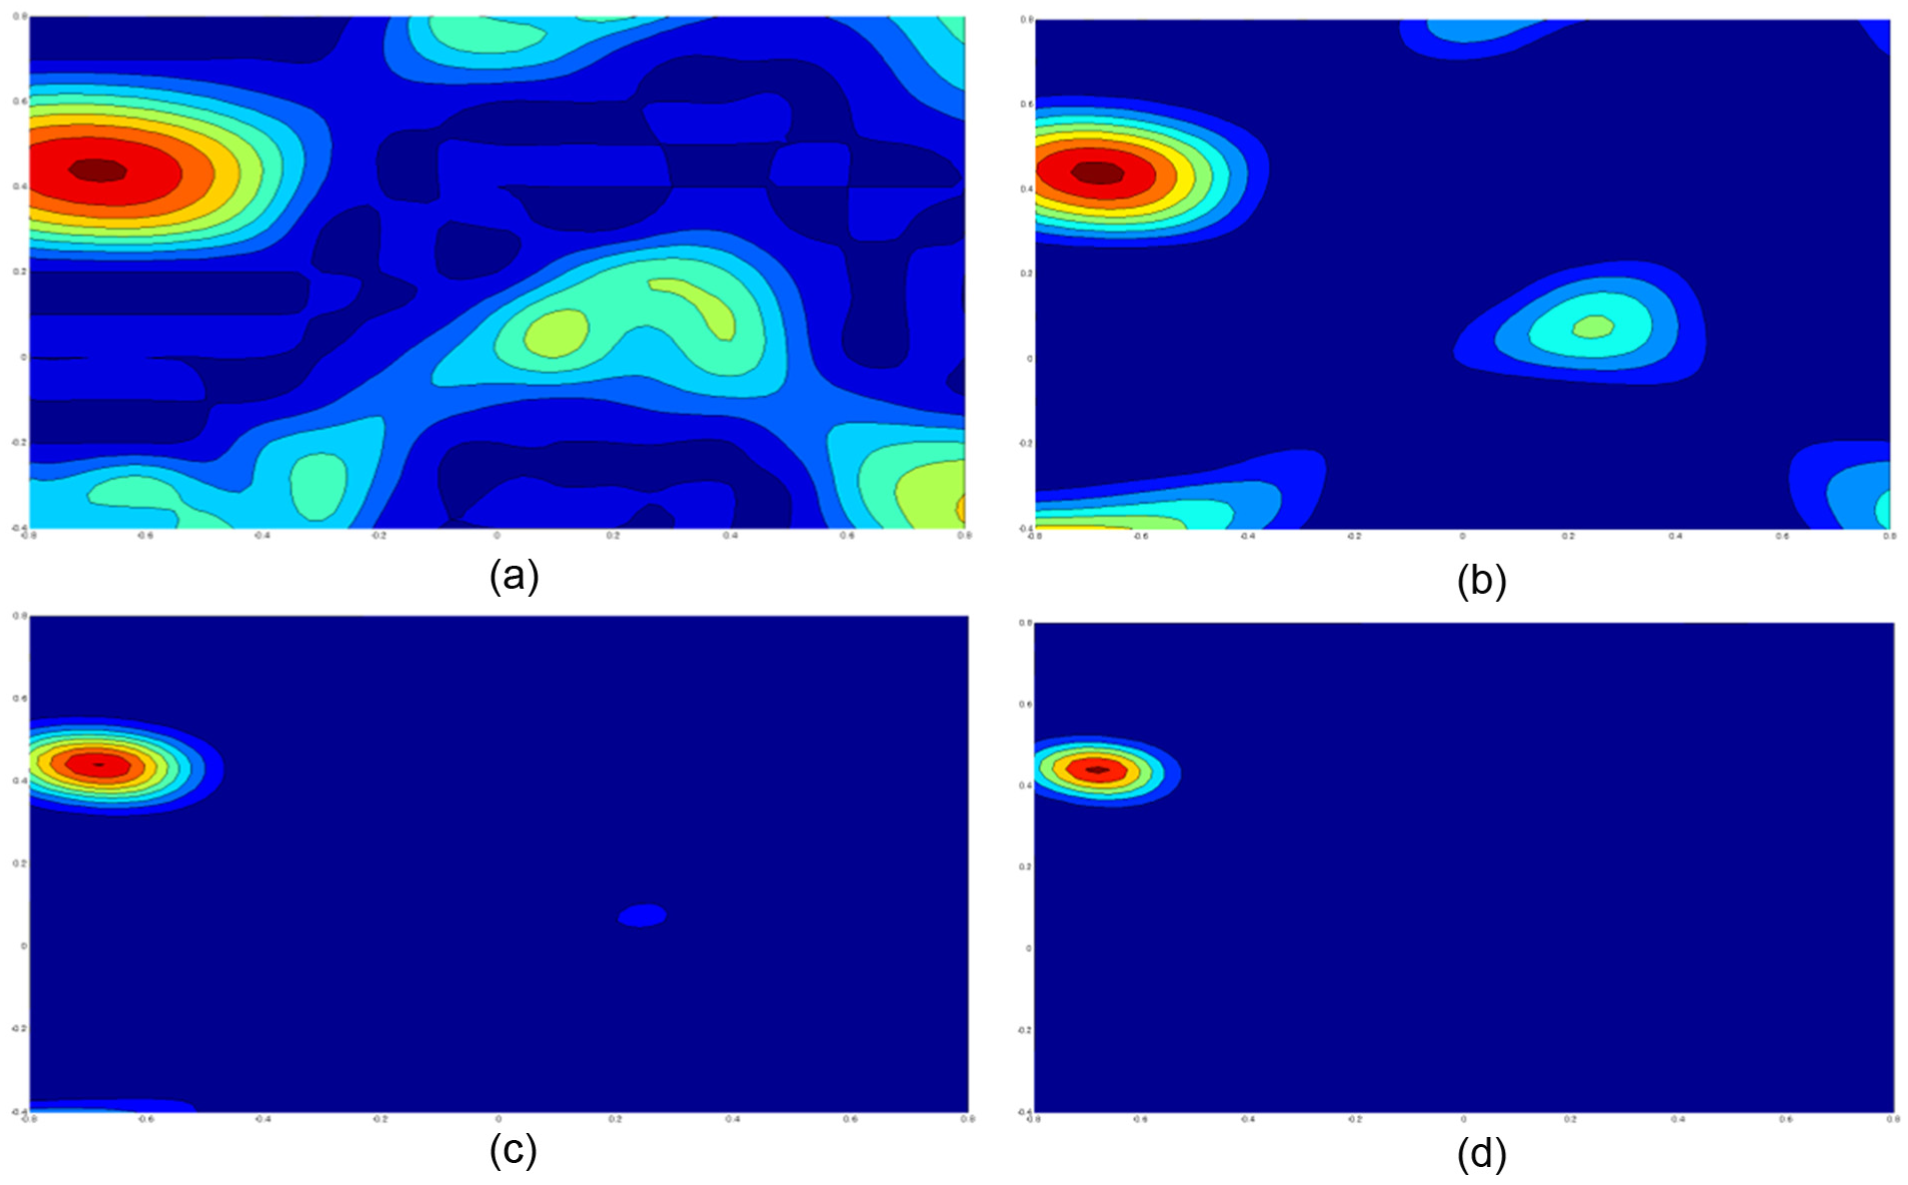
Sound source identification results for different iterations: (a) 5 iterations, (b) 20 iterations, (c) 50 iterations, and (d) 100 iterations.
Interior sound source identification using acoustic holography
The engine was turned off, the car was set in parking mode, and the rear door of the vehicle was opened. For the convenience of array placement, the rear seat of the vehicle was removed to enable placement of a microphone array. To make the floorboard vibrate and emit sound, two points were excited at 180 Hz under the floorboard at the back of vehicle using a vibration exciter. The experimental procedure produces approximately steady-state sound. The microphone line array was placed 10 cm away from the vehicle floorboard for the scan. A 5 × 8 microphone array was installed, and a microphone was suspended inside the car as a reference microphone. The experimental set up of the interior sound source identification is shown in Figure 10.

Set up of the interior sound source identification experiment.
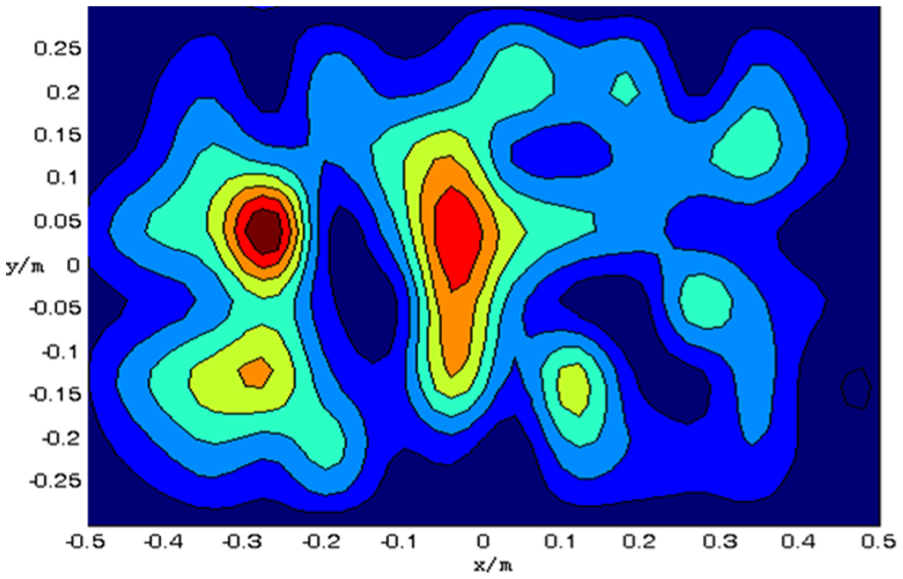
The sound pressure, sound intensity, and particle vibration velocity were reconstructed at 180 Hz. The reconstruction distance was 0.1 m, and the size of the reconstruction surface was 0.6 m × 1 m. The reconstruction results are shown in Figures 11–14. According to these figures, the positions of two excitation points can be determined according to the sound pressure reconstruction and reactive sound intensity reconstruction, although the results are more obvious using the reactive sound intensity reconstruction. Because of the influence of the vibration mode from the structural plate and other components, certain sound source points with small peak values appeared in the reconstruction results. Through the sound pressure reconstruction, the positions of excitations with small peak values could not be effectively identified, and through the active sound intensity reconstruction, the reconstruction results could not reflect the positions of excitation points, which were presented as a combination of structure modal shapes and excitation points.

Reconstruction results of the excitation point with sound pressure.
Reconstruction results of the excitation point with particle vibration velocity.
Reconstruction results of the excitation point with active sound intensity.

Reconstruction results of the excitation point with reactive sound intensity.
Internal acoustic contribution analysis
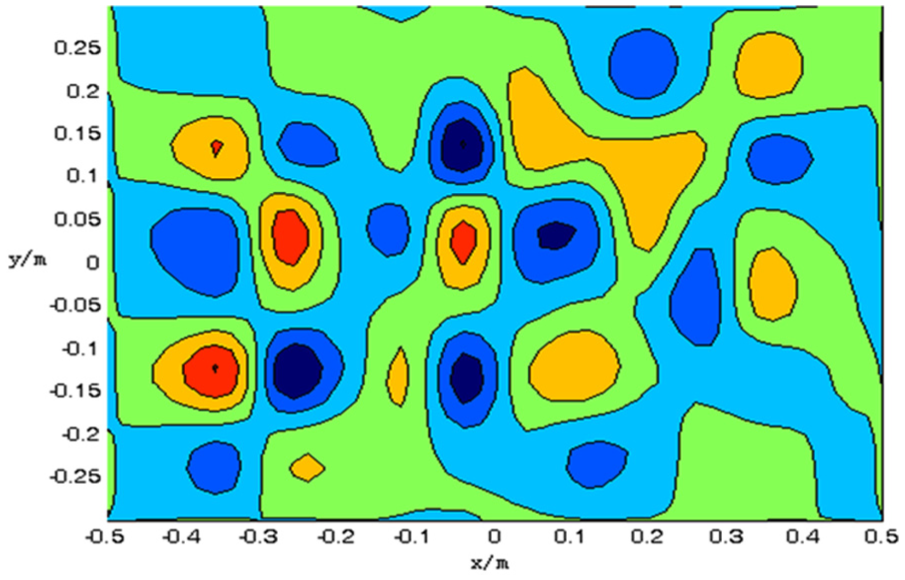
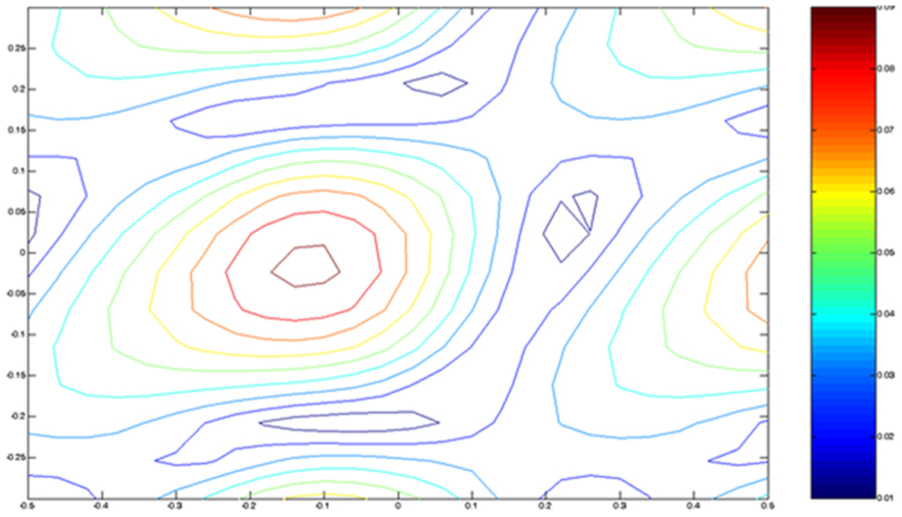
The sound pressure contribution of point A (−0.1, 0), which is located 10 cm away from the vehicle floorboard, is analyzed. The sound pressure value of point A at 180 Hz was 0.13607 Pa. Based on the interior sound source identification, the sound field, which was located 0.35 m away from the rear floorboard according to the particle velocity and sound pressure, was predicted. The predicted surface was 1 m × 0.6 m. The prediction results are shown in Figures 15 and 16, and the black spot position is the measurement position of the microphone in the vehicle.
Acoustic field prediction via sound pressure reconstruction.

Acoustic field prediction via particle velocity reconstruction.
As observed in Figures 15 and 16, the prediction result of point A via the particle velocity method is 0.1361 Pa, which is consistent with the experimental results. In the sound pressure contribution analysis, the spatial sound field was predicted based on the particle velocity and sound pressure. The sound pressure contribution coefficient and the amplitude-phase graph of the sound source to point A were obtained and are shown in Figures 17–19.

Sound pressure contribution of the sound source to point A.

Sound pressure contribution coefficient of the sound source to point A.
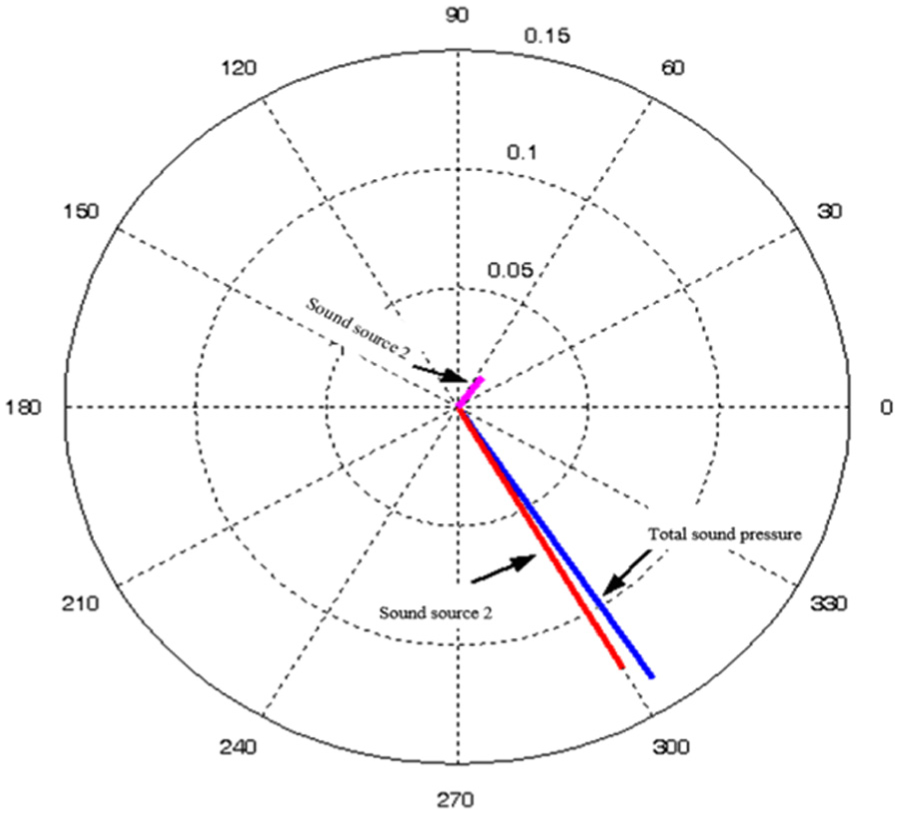
Total amplitude-phase of point A.
According to Figures 17–19, when the sound pressure of spatial point A is at 180 Hz, the maximum sound pressure contribution is from sound source 1 (the excitation point position under the left side of vehicle). The sound pressure contribution of sound source 2 (the excitation point at the intermediate part of vehicle) was small at 180 Hz and presented a negative contribution. The total sound source contribution from the two excitation points is not equal to the total sound pressure from selected point A because the sound pressure of point A is affected by two excitation points as well as the vibration radiation noises from other structural components and exterior noises; however, these sources of noise have only a small effect.
Conclusion
This article proposed an advanced far-field acoustic hologram and applied it for exterior sound source identification at a low frequency, and the results show that its accuracy is significant greater than that of the traditional far-field acoustic hologram. The NAH was applied for internal sound source identification. Based on the sound source identification, the sound source acoustic contribution of the vehicle was analyzed. The DAMAS method was used for the post-processing of the SOBT results, and the accuracy of the far-field sound source at a high frequency was improved. Several of the conclusions of this study are presented as follows:
The proposed method combining the SONAH and SOBT approaches was applied to sound source identification over a wider frequency band. Furthermore, the algorithm for implementation and test operations is simple.
The structural vibration source that generated the sounds can be effectively identified by applying the particle velocity reconstruction and the reactive sound intensity reconstruction.
Using the acoustic holography method, the source of the maximum sound pressure contribution to the spatial point can be obtained via interior sound source localization to predict and analyze the acoustic contribution of the specified spatial position. Thus, the acoustic contribution analysis method was further simplified. In the process of sound source identification, the contribution of each sound source can be simultaneously sorted, which can help guide research on low-noise control for vehicles.
The sound source identification and acoustic contribution analysis introduced in this article can be used to obtain the sound source location and the contribution values from selected points.
Footnotes
Handling Editor: Yunn-Lin Hwang
Declaration of conflicting interests
The author(s) declared no potential conflicts of interest with respect to the research, authorship, and/or publication of this article.
Funding
The author(s) disclosed receipt of the following financial support for the research, authorship, and/or publication of this article: The research reported in this paper was sponsored by the Natural Science Foundation of Colleges of Jiangsu Province (16KJB580002).