
Abstract
The electromagnetically driven oscillating cup viscometer is developed to accurately determine the conductivity and viscosity of molten semiconductors. To reduce the sample’s temperature gradient during the heating process, the sidewall of the sample is heated by a tubular heating furnace; however, the sample still has a temperature gradient. A numerical simulation is conducted in this study, aiming to reveal the steady-state heat transfer mechanism of saturated salt water in a heating device based on the electromagnetically driven oscillating cup viscometer. The numerical results show that the temperature gradient can be effectively reduced by increasing the insulating layer. As the thickness of the insulating layer increases, the temperature gradient of the sample is reduced. When the thickness of the insulating layer increases above 10 mm, the rate of reduction in the temperature gradient decreases. In this article, the optimum thickness range of the thermal insulating layer outside the heating device is obtained, which provides a theoretical basis and reference data for the design of the insulating layer of the electromagnetically driven oscillating cup viscometer heating device.
Keywords
Introduction
The electromagnetically driven oscillating cup (EOC) viscometer can improve the accuracy of viscosity and conductivity measurements of high-temperature conductive samples, and its non-contact measurement method can avoid test sample dissolution, evaporation, toxicity, and other issues.
A number of previous studies have been conducted to understand the viscosity and conductivity of a sample based on the rotational motion data of the cup. DA Beckwith and GF Newell 1 concluded that the frequency and the reduction of oscillation is related to the viscosity and density of the fluid of various shapes and sizes of cups. JC Nieuwoudt et al. 2 determined the feasibility of ascertaining the viscosity and density at the same time, based on the observed damping of the oscillating cup and its periodicity. A torque equation was obtained for the case where the cup height approaches the thickness of the fluid boundary layer. 3 C Li 4 and C Li et al. 5 obtained a set of fitted simultaneous control equations for the conductivity and viscosity of the fluid based on the values of the transient deflection of a sample to which a rotating magnetic field was applied. The viscosity and conductivity of high-purity mercury at 53.4°C were successfully measured. I Elyukhina and G Vyatkin 6 presented the general model of oscillating cup viscometry. Beskachko et al. 7 evaluated the estimation of oscillation parameters (oscillation reduction and periodicity) by means of wavelet analysis and optimization. At the same time, the field dependence of the oscillatory parameters was used for the determination of liquid gallium viscosity and conductivity by virtue of our previously proposed viscosity theory. IV Elyukhina and GP Vyatkin 8 developed a nonlinear characteristic recognition theory which was based on the use of each half cycle of the valid values and a linear fluid analysis solution. A schematic diagram of the viscometer, without the data acquisition system, is shown in Figure 1.

Schematic diagram of the viscometer.
Many researchers have conducted studies to further explore measurements using the oscillating cup viscometer. M Kehr et al. 9 measured pure metals at temperatures up to 1700°C; because of limitations of the thermocouple, the researchers used a new oscillating cup viscometer for temperatures up to 2300°C. The obtained viscosity values showed good agreement with the data reported in the literature. S Gruner and W Hoyer 10 presented a statistical approach with two aims: to estimate the uncertainties of the actual measured parameters of a torsional oscillator and to analyze the propagation of these errors when calculating the dynamic viscosity. I Elyukhina11,12 developed the general algorithms for damped and forced modes of oscillating cup viscometry of fluids with viscous, elastic, and plastic components and discussed the possibility of simultaneous measurement of different viscometric properties by the oscillating cup technique. J Cheng et al. 13 reviewed the measurement methods and numerical models for the viscosity of liquid and semi-solid state metals. VMB Nunes et al. 14 reported the viscosity of molten lithium nitrate from its melting point up to approximately 700 K using oscillating cup viscometer measurements. K Horne and H Ban 15 reported work in which the sensitivities of this new method’s output were studied for the measurement of mercury with a particular device whose results were just as precise as other oscillating cup methods.
Although so much research work has been done on the EOC viscometer, there is still an evident temperature gradient in the experiments that has an effect on the density, viscosity, and conductivity measurements of the target. The traditional way to reduce the temperature gradient of the sample is to cover the insulating layer on the sidewall of the furnace, thus effectively reducing the heating time and saving energy; this method cannot effectively reduce the temperature gradient of the sample. Therefore, this article presents an effective method of insulating to reduce the temperature gradient of the sample. The use of an insulating material to seal the opening at both ends of the sidewall furnace can significantly reduce the effect of the lower opening temperature on the sample. The commercial ANSYS WORKBENCH software 16 was used to study the thermal insulating effect of different thicknesses of the insulating layer.
Numerical model
Physical model
The research object of this study is the heating device of the EOC viscometer. The schematic diagram of the heating device is shown in Figure 2. In the actual heating process, since only the heating device is considered, the flow of the sample produced by the magnetic field is not taken into account. Thus, the sample can be assumed to be a non-flowing liquid. The thickness of the glass in the heating device is small. The effect of the glass bottle on the steady-state heat transfer characteristics of the sample is small, so this part is ignored when calculating.

Schematic diagram of the heating device of the EOC viscometer: (a) heating device diagram and (b) insulating layer location diagram.
Numerical method
Governing equations
The differential equation for the temperature field heat transfer is established by the law of conservation of energy. The amount of heat required for any three-dimensional micro-element in the x-axis, y-axis, and z-axis directions is equal to the sum of the external heat and the heat provided by the internal heat source, per unit time. The mathematical expression is

For a material with isotropic thermal conductivity,
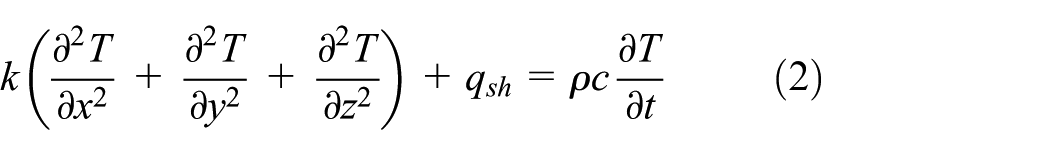
where c is the specific heat of the material,
Steady-state heat transfer model
If the bottle is a vacuum, the heat transfer processes are as follows:
1. Convective heat transfer between the furnace and the outside air

2. Radiant heat transfer between the furnace and the environment and radiant heat transfer between the furnace and the sample in the fused silica crucible.
By the Stefan–Boltzmann law, the radiation heat intensity on the temperature field is

3. Steady-state thermal conductivity of the furnace wall.
If the temperature field of a certain part of the boundary of the normal conductive heat flow is known, by Fourier’s law, we can see

Solution method
In this study, the finite volume method is used to solve the governing equations, and the steady-state heat transfer in WORKBENCH is used. Double precision calculation is used to ensure the accuracy of the simulation results.
Computation grids
Hexahedron element grids are generated in this study. Before the numerical solution, different numbers of grids, including 240,000, 340,000, and 400,000, are used to verify the independence of the grid density. When the number of grids is 340,000 or 400,000, the relative deviation of the inner wall temperature is less than 5%, indicating that the numerical solution is independent of the grid. Thus, a grid number of 340,000 is selected for use in this study.
Thermophysical properties
The sample is a cylinder with a diameter of 26 mm and a length of 100 mm. The furnace is a round pipe body. The inner and outer diameters of the furnace are 40 and 70 mm, respectively, and the body length is 300 mm. A cylindrical insulating layer with a diameter of 40 mm was placed in the lower port of the furnace. An insulating layer with an inner diameter of 10 mm is placed in the upper port of the furnace because the top of the sample has a glass fiber link. Both insulating layers have the same external diameters and thicknesses. In this study, the sample used is a saturated salt solution. The assumed material properties are listed in Table 1.
Material properties.

Results and discussion
Effect of insulating layer on temperature difference
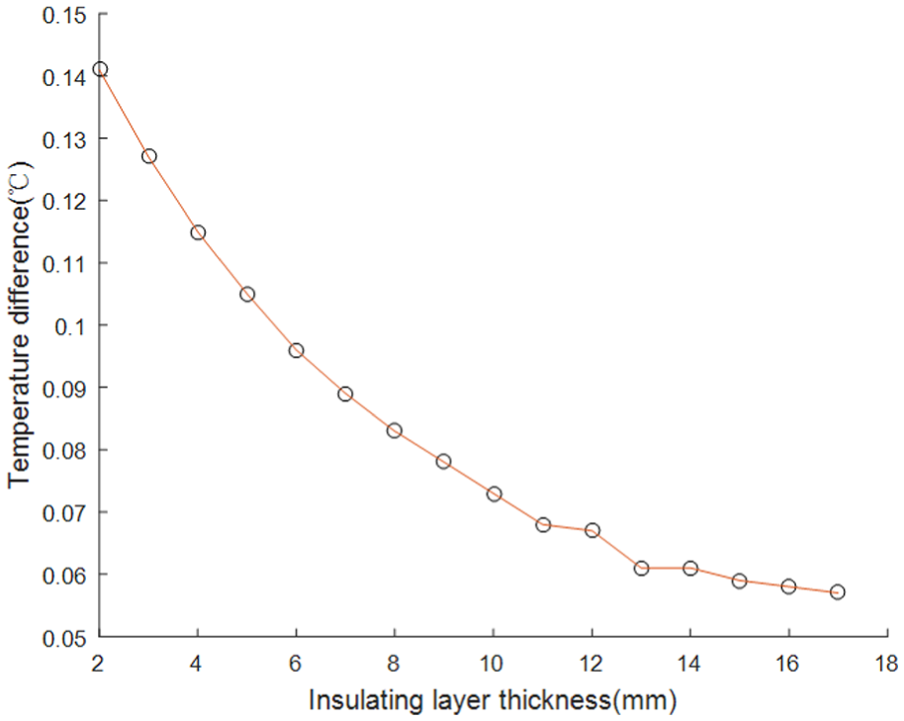
The relationship between temperature difference and insulating layer thickness.
Effect of insulating layer on maximum temperature
At the same time, it can be seen from Figure 4 that the maximum temperature of the sample is decreasing as d increases. This is because insulating layers that do not cover the sidewalls of the furnace are placed at both ends of the furnace and, due to the increased insulation thickness, the entire heating device needs more energy for heating.
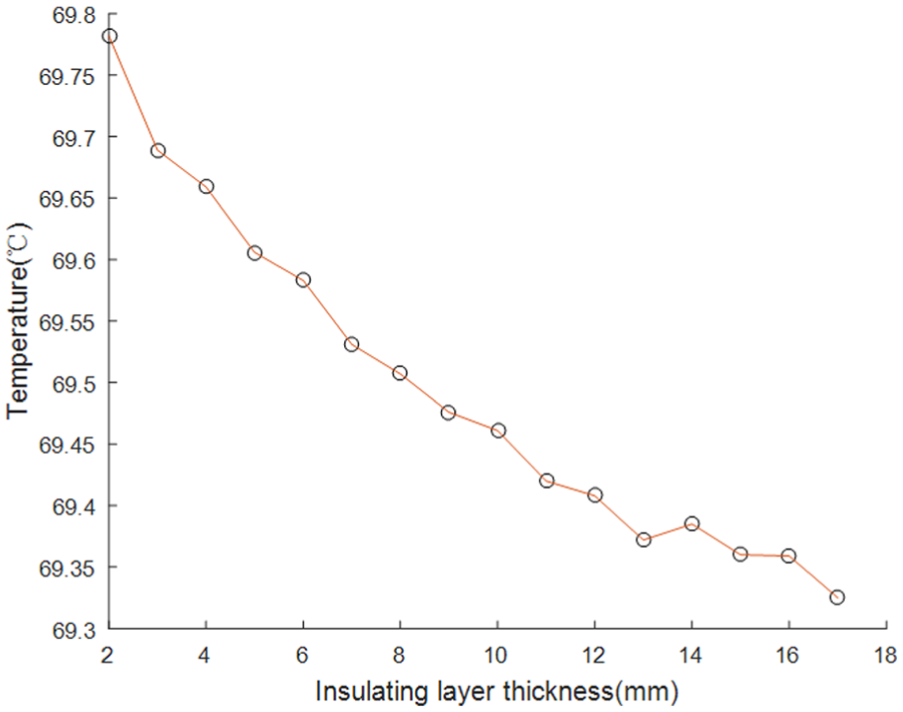
The relationship between maximum temperature and insulating layer thickness.
Effect of insulating layer on temperature ratio
The dimensionless temperature ratio,

The relationship between temperature ratio and insulating layer thickness.
Sample temperature gradient characteristics
The sample temperature gradient is shown in Figure 6. The sample’s center temperature is the highest. Because the sample is heated by sidewalls, and there is no heat source at the bottom or top of the furnace, the bottom and top temperatures of the sample are less than the center temperature of the sample.

Sample temperature gradient: (a)
Conclusion
In this study, a numerical simulation is performed to study the steady-state heat transfer mechanisms of the heating device in the EOC viscometer. Based on the numerical results, the following conclusions are reached:
By increasing the insulating layer, the sample temperature gradient can be significantly improved. The maximum and minimum temperatures decrease as the thickness of insulating layer increases. The minimum temperature reduction of the sample is significantly less than that of the maximum temperature. The temperature gradient of the sample is reduced as the thickness of insulating layer increases.
At the same time, we note that the maximum temperature decreases as the thickness of the insulating layer increases because the insulating layers are placed at both ends of the furnace and do not cover the sidewalls of the furnace. The energy required to heat the entire device is increased, so the maximum temperature will be affected. However, the results of the temperature ratio show that the maximum temperature is not significantly reduced when the thickness of the insulating layer is in the range from 2 to 17 mm, so it does not affect the final test data.
Continuing to increase the thickness of the insulating layer will affect the maximum temperature of the sample. Therefore, the thickness of the insulating layer cannot be increased without limit. When the thickness of the insulating layer is in the range of 10–17 mm, the maximum temperature gradient is less than 0.1°C and the temperature ratio is less than 0.001. This is considered to be the best case.
Footnotes
Handling Editor: Zhaojie Ju
Declaration of conflicting interests
The author(s) declared no potential conflicts of interest with respect to the research, authorship, and/or publication of this article.
Funding
The author(s) disclosed receipt of the following financial support for the research, authorship, and/or publication of this article: This work was supported by the National Natural Science Foundation of China (No. 51509205).