
Abstract
Reliability is critical for complex engineering systems. Traditionally, reliability analysis and fault diagnosis of complex engineering systems is based on reliability block diagram and fault tree. These methods are limited either on the flexibility for system characterization or on the capability for quantitative analysis. Recently, the Bayesian network has been introduced in reliability engineering, and it has been demonstrated with great flexibility. In this article, the Bayesian network is investigated for reliability analysis and fault diagnosis of complex engineering systems through two real cases. It includes the case of a high-speed train representing the complex system with standardized components and the case of a critical subsystem of a high-power solid-state laser representing the complex system with highly customized components. In particular, Bayesian networks are constructed to model the reliability of these systems, where transformations of reliability block diagram and fault tree into Bayesian networks are presented. Reliability assessment of the systems is obtained through forward inference of Bayesian network. In addition, fault diagnosis is studied for identifying critical components, major causes, and diagnosis routes by utilizing backward inference of Bayesian network.
Introduction
Complex engineering systems are playing indispensable roles in people’s daily lives, industrial production, national defense, and scientific research. Some of the complex engineering systems are manufactured with standardized subsystems and components, for which the reliability can be well-controlled and estimated, such as the high-speed train studied in this article. However, reliability analysis and fault diagnosis of this kind of system may be challenged by the complex system structure, which includes cold standby, warm standby, and hot standby in the system. 1 However, some of the systems are custom-tailored with highly customized subsystems and components, for which their reliability is affected by various factors and hard to be estimated, such as the high-power solid-state laser. The reliability analysis and fault diagnosis of this kind of system may be challenged by the variety of failure modes, the rareness of failure data, and the existence of common cause failures. 2 Traditionally, reliability analysis and fault diagnosis of complex engineering systems is mainly based on past experience and experts’ judgements, where the complex system structures, the various failure modes, and common cause failures cannot be well-characterized. Accordingly, to deliver a system with high reliability and to maintain a system with high availability, a coherent reliability analysis and fault diagnosis method with the capability of qualitatively describing the complex reliability relationships among composing components and the capability of quantitatively assessing the system reliability is needed. Various aspects need to be considered within the reliability analysis and fault diagnosis, such as the multidisciplinary involved,3–5 failure mechanisms modeling,6–8 and the component and performance degradation.9,10
The Bayesian networks (BNs) have become more and more popular in reliability engineering.11,12 System reliability modeling and analysis using BNs has been studied a lot. Weber et al. 11 presented an extensive review of BNs in the fields of dependability, risk analysis, and maintenance applications. They reviewed 200 specific references among a database with 7000 BN references, where the strengths of BNs in contrast with classical methods were discussed and summarized. Langseth and Portinale 12 presented a systematic review of BNs in reliability engineering. The properties of BNs that are particularly well-suited for reliability modeling and analysis have been highlighted and discussed comprehensively. For a review, summarizing works related to BNs in reliability before 2000, please refer to the work by Sigurdsson et al. 13
Recently, Cai et al.14,15 presented a reliability evaluation of subsea blowout preventer control system using BNs. The common cause failure and imperfect coverage for redundant system modeling have been studied in their work. Codetta-Raiteri et al. 16 studied cascading failures in critical infrastructure systems using dynamic BNs. Di Giorgio and Liberati 17 also studied the BN for reliability analysis of critical infrastructures, where the interdependency modeling and failure prediction based on the BN were highlighted. Neil and Marquez 18 introduced a hybrid BN framework for availability modeling of repairable systems. Medjaher et al. 19 presented a method for remaining useful life estimation of bearings. Iamsumang et al. 20 introduced a BN-based method for online system health management. Cai et al. 21 investigated the BN for failure prediction by introducing a divide-and-conquer principle–based algorithm. To improve the diagnostic accuracy, Cai et al. 22 introduced a multi-source information fusion method by utilizing the advantage of BN for information representation and statistical inference. A multilevel information integration method based on BN for reliability analysis of multi-state hierarchical system has also been introduced by Li et al. 23 Further investigation of BNs for fracture prediction of medical devices, life extension assessment, and even human reliability analysis have been carried out by Haddad et al., 24 Pérez Ramírez and Utne, 25 and Mkrtchyan et al., 26 respectively.
Meanwhile, there are some difficulties for the applications of BNs in reliability engineering, such as the incorporation of both discrete and continuous variables and the issue of calculation efficiency of BNs for complex systems. New methods have been developed to solve these problems, such as the approximate inference method, 27 the dynamic discretization method, 28 the max-flow min-cut theorem–based method, 29 the run-lengthen-coding and Lempel–Ziven coding–based compression algorithm, 30 and the first-order-reliability method–based discretization method. 31
In this article, the BN is investigated for reliability analysis and fault diagnosis of complex systems with standardized components and highly customized components. In detail, the BN is studied for reliability assessment and fault diagnosis of these complex systems, and two real cases from reliability analysis of the high-speed train and reliability analysis of the gas switch of a high-power solid-state laser are presented in this article. Qualitative model of system structures with cold standby, hot standby, and common cause failures is studied, where the construction of BN from reliability block diagrams and fault trees is presented. Coherent study on the quantitative assessment of system reliability and fault diagnosis is carried out in this article as well, where the reliability assessment of system with continual random variables and discrete variables is demonstrated. In addition, the method for identifying critical components, failure causes, and fault diagnosis routes is studied based on the BNs.
The rest of the article is organized as follows. Section “Brief introduction of BNs” briefly introduces the BN. Section “BN for the reliability analysis of CRH380B” presents the practical application of BN on the reliability analysis of CRH380 high-speed train. Section “BN for the reliability analysis and fault diagnosis of a critical component of the high-power solid-state laser” presents the BN-based reliability analysis of the gas switch subsystem of the high-power solid-state laser. Section “Conclusion” concludes the article by summarizing the practical applications of the BN in the two cases and highlights the points for future research.
Brief introduction of BNs
A BN is a graphical description of the probabilistic relationship within a group of random
variables. It consists of two main elements, that is, the qualitative element and the
quantitative element.
12
The quantitative element is presented as a directed acyclic graph (DAG)
with nodes representing the system variables and directed arcs symbolizing the causal or
dependence relationships between variables. The nodes can be discrete or continuous and may
or may not be observable. The directed arcs point from parent nodes to corresponding child
nodes. This graphic relationship indicates that the node
By specifying the quantitative and quantitative elements, all information contained in a
joint probability model can be fully encoded in a BN. According to the conditional
independence assertions related to the directed arcs in a BN and the chain rule in
probability theory, the joint probability distribution of a set of variables
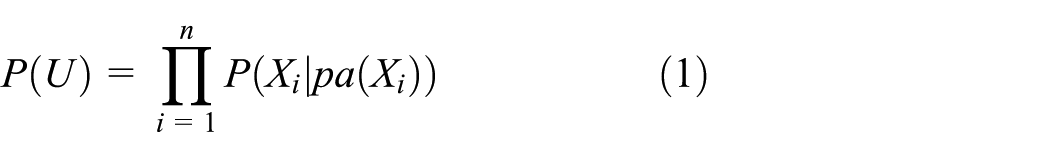
The probability distribution of a single node
Given the probability distribution of the components in the reliability diagrams, the joint
probability distribution of all the components, subsystems, and systems can be obtained,
which is realized through the qualitative BN modeling and quantitative BN inference as the
corresponding equation similar to equation (1). The reliability of the system
can be obtained through the marginalization of this joint probability distribution.
Meanwhile, given the observations of some nodes in the BN as evidence
BN for the reliability analysis of CRH380B
High-speed train (HST) has been recognized as one of the most significant creations that affect human life since the Second World War. Within about the past decade, China has become one of the top countries managing the HST technology. There are currently more than hundreds of HSTs being serving the Chinese railway. The safety and reliability of the HST have consequently become critical factors of HST. Both the manufacturers and customers have exerted great attentions to the reliability of HST. This article is specifically dedicated to the reliability modeling and fault diagnosis of HSTs. Particularly, the CRH380B has been modeled and analyzed in this article.
Two important issues are critical for the reliability analysis of HST, that are a comprehensive reliability model for characterizing the complex system structure of HST with hot spare and cold spare structures, and a flexible framework for implementing predictive and prognostic inferences of system, subsystem, or component. In this work, we focus on the reliability analysis of a HST named as the CRH380B using BN method. In the following subsections, the system structure of the CRH380B is first introduced with reliability block diagrams of critical subsystems. The BNs for the CRH380B is then constructed with specific modeling of cold standby and hot standby structures. The predictive and diagnostic inferences of the CRH380B are implemented for reliability analysis and fault diagnostic.
BN of the CRH380B
The CRH380B is mainly composed of four critical subsystems including the central control system (CCS), the power system (PowS), the propulsion system (ProS), and the braking system (BS).
The CCS is the on-board part of a train control system. It is designed to implement a signaling, controlling, and protecting of the train. The communication between the train and the train operation dispatching command center, and the controlling of the PowS, ProS, and BS all depend on the CCS. The CCS consists of the central control unit (CCU), the auxiliary power control unit (APCU), the propulsion control unit (PCU), the braking control unit (BCU). The CCUs are assembled and installed in the head car of the HST. However, other critical units are dispatched in different cars and installed together with the corresponding functional systems (e.g. the PowS, the ProS, and the BS). To guarantee the high reliability of the CCS, the CCU is designed with hot spare and cold spare simultaneously. Reliability block diagram for the CCS is given in Figure 1. Only the construction of the CCU is included; the others are presented together with their corresponding functional systems as given in the following figures.
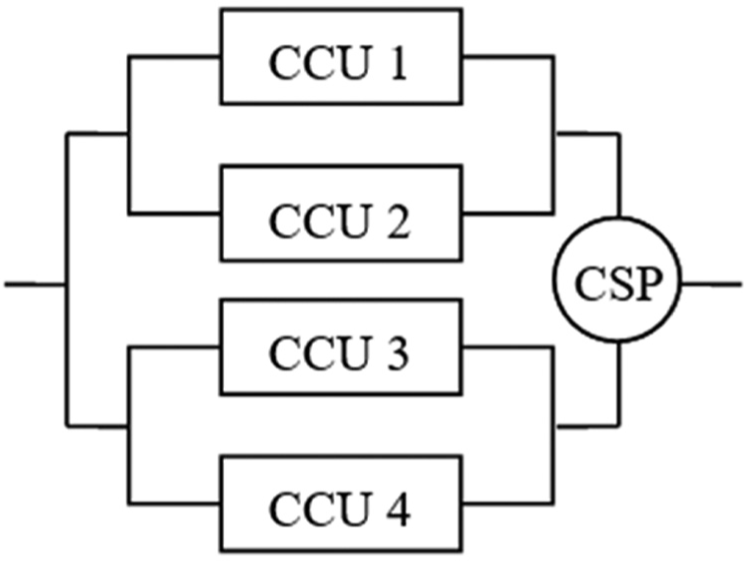
Reliability block diagram of the central control system.
The PowS collects electricity from the overhead catenary wire and translates the electricity to various types of current for all kinds of facilities and devices in the HST. It collects electric power from a 25-kV alternating current (AC) overhead transmission lines through a pantograph (Pan.). The 25-kV AC is then translated to two separate 1850-V ACs by two independent electrical transformers (ETs). Each 1850-V AC from the corresponding ET is then translated to two separate 3000-V direct current (DC) by two independent traction converters (TCs). These four 3000-V DCs are the main currents of the ProS and the auxiliary PowS. These main currents are separately transmitted to various subsystems, equipment, and devices in the HST. To fulfill this mission, a group of auxiliary PowS composed of two single auxiliary converters (SAC), two dual auxiliary converters (DAC), and the corresponding APCU are involved. A group of battery system with two chargers (Cha.) and two batteries (Bat.) are involved as well. A cold spare structure is designed for the pantograph, and some hot spare structures are designed for major parts of the PowS. The reliability block diagram of the PowS is presented in Figure 2, where the “Pan. P” and “Pan. S” separately denote the primary pantograph and standby pantograph. The ETs and TCs are included in the reliability block diagram of the ProS as given in Figure 3.
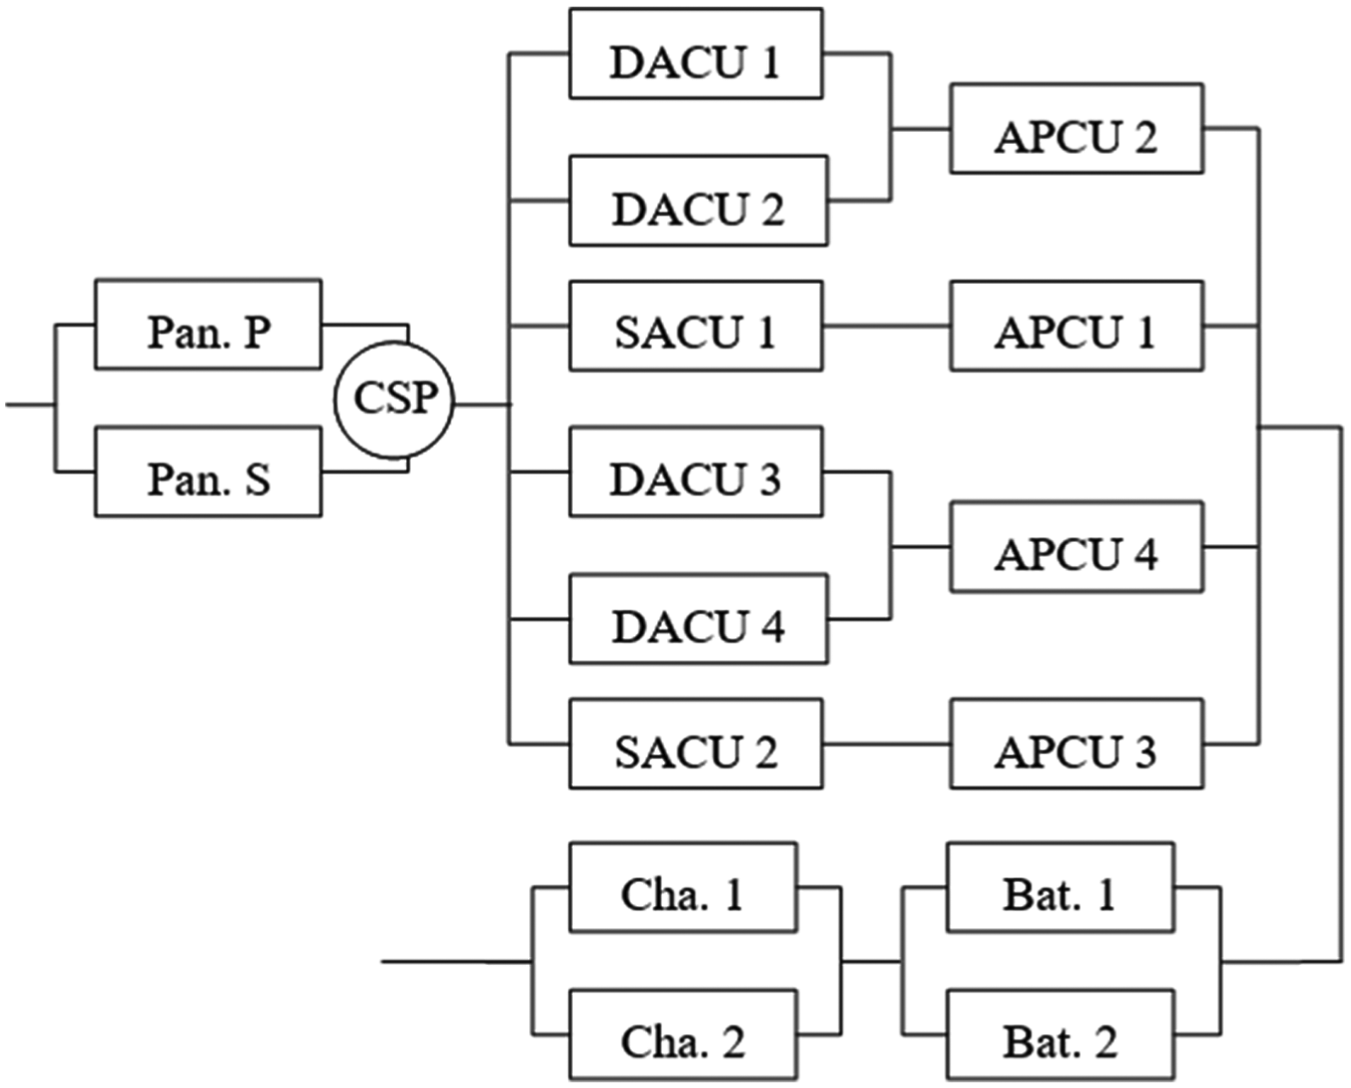
Reliability block diagram of the power system.
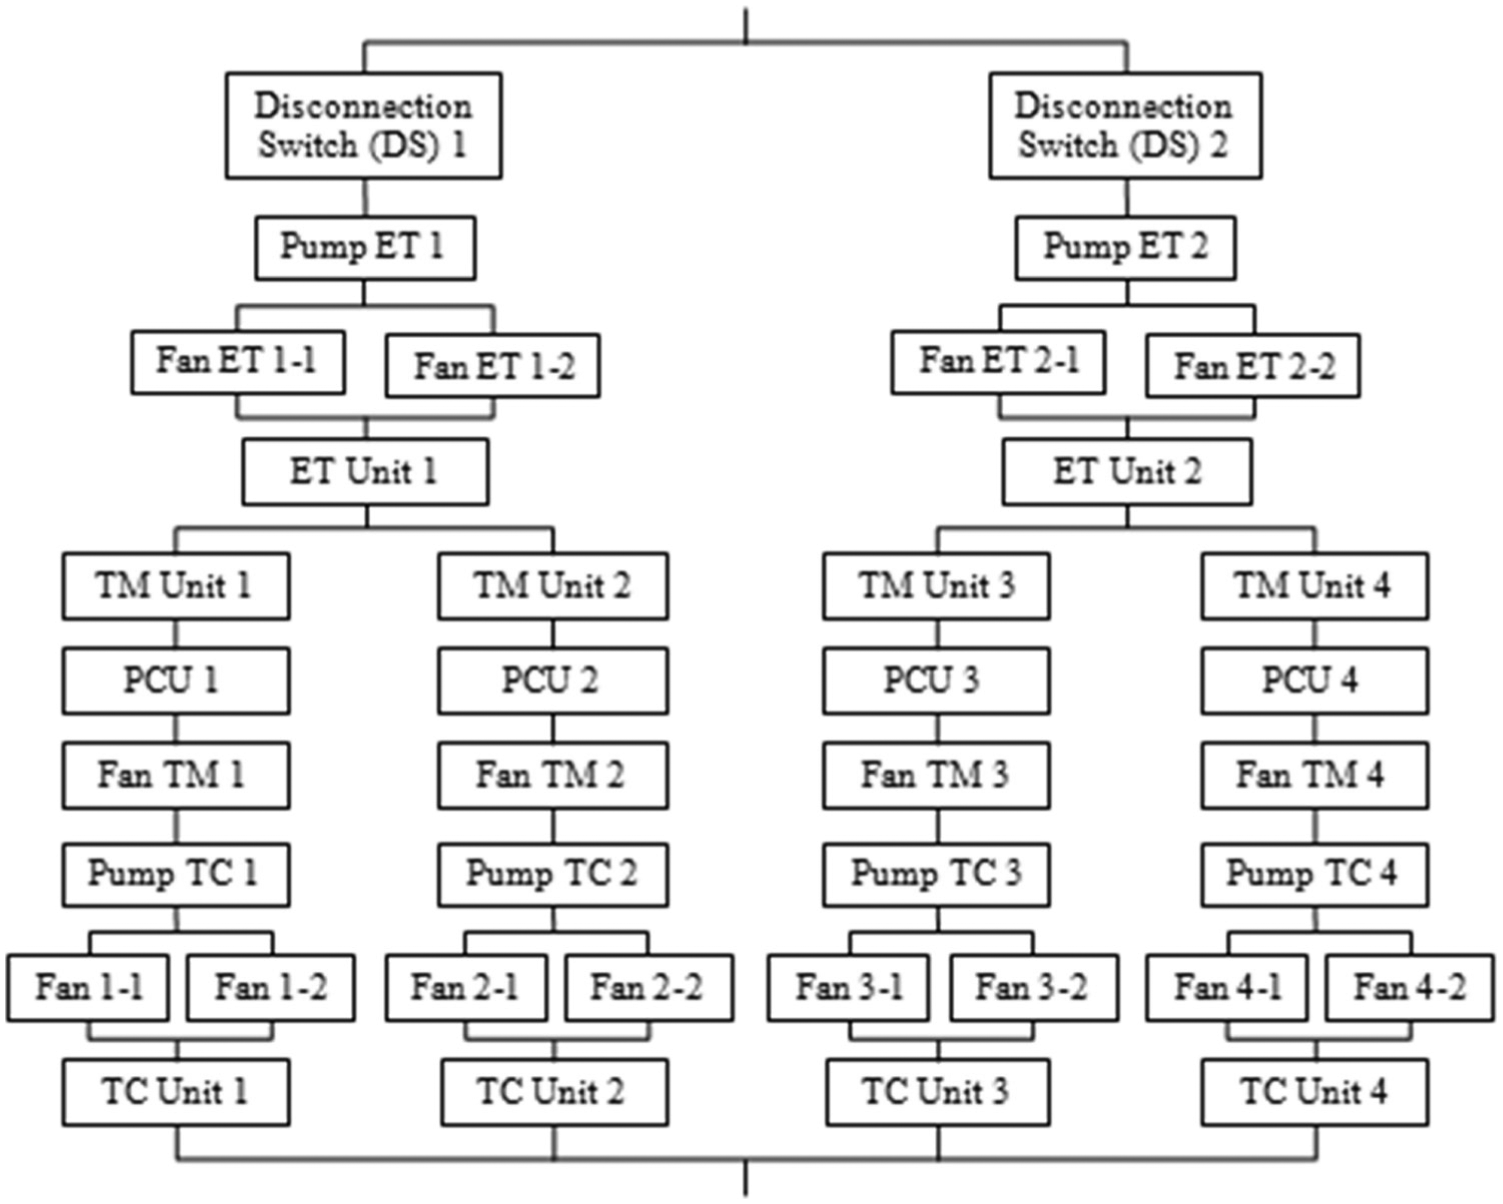
Reliability block diagram of the propulsion system.
The ProS translates the four separate 3000-V DCs into the main thrust of the HST. It is composed of four traction motors (TMs) that convert the 3000-V DCs into thrust power. Each TM is controlled by the corresponding traction control unit (TCU) which accepts controlling signal from the CCU. The reliability block diagram of the ProS is presented in Figure 3. The ETs and TCs are closely related to the TM both functionally and structurally. The ETs, TMs, and TCs are composed of the corresponding functional units, cooling fans, and cooling pumps. Hot spare structures are designed for major parts of the ProS.
The BS stops the HST that runs with the speed of 350–380 km/h within a minimum effective distance. It is composed of four groups of BSs associated with motor cars and four groups of BSs associated with trailer cars. Each group consists of a braking unit (BU) that directly stops the car and a BCU which communicates with the CCU. These eight groups of BSs construct a hot spare structure for the whole BS of the HST. The reliability block diagram of the BS is presented in Figure 4.
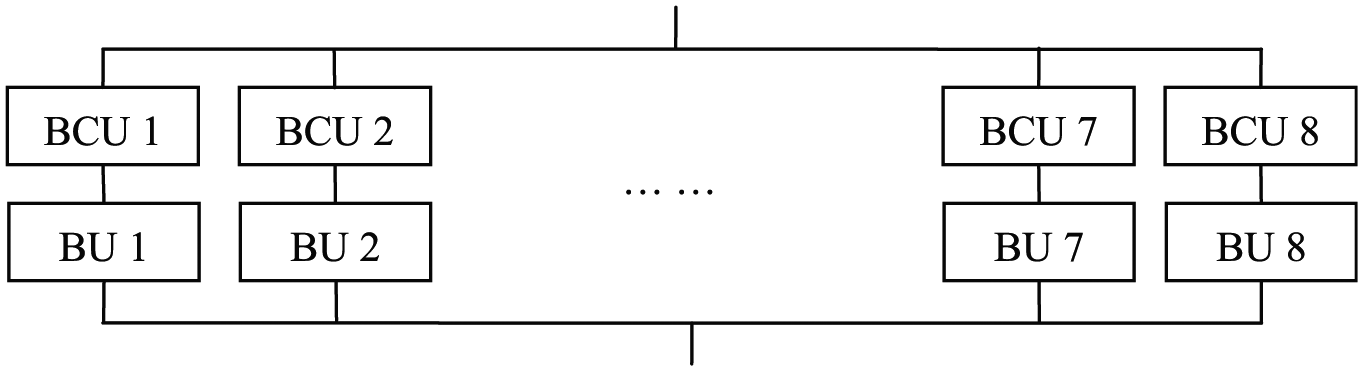
Reliability block diagram of the braking system.
The above reliability block diagrams are simplified from a real system structure of CRH380B. The main structure with cold standbys and hot standbys are included in these diagrams. This work could be extended to a more general case for the reliability modeling and analysis of HST. Since all the variables for the reliability modeling of the system are continuous variables, a continuous-time BN is constructed for the system. To handle the complexity of the system and to obtain a time-efficiency calculation of the predictive and prognostic analysis of the system, a software package for BN, the AgenaRisk, 32 is used for model construction and reliability analysis. The methods proposed by Marquez et al. 28 for modeling cold standby and hot standby structure as well as their calculation in the AgenaRisk are incorporated in the BN modeling and analysis of the CRH380B in this article. The BN for the CRH380B is presented in Figure 5.
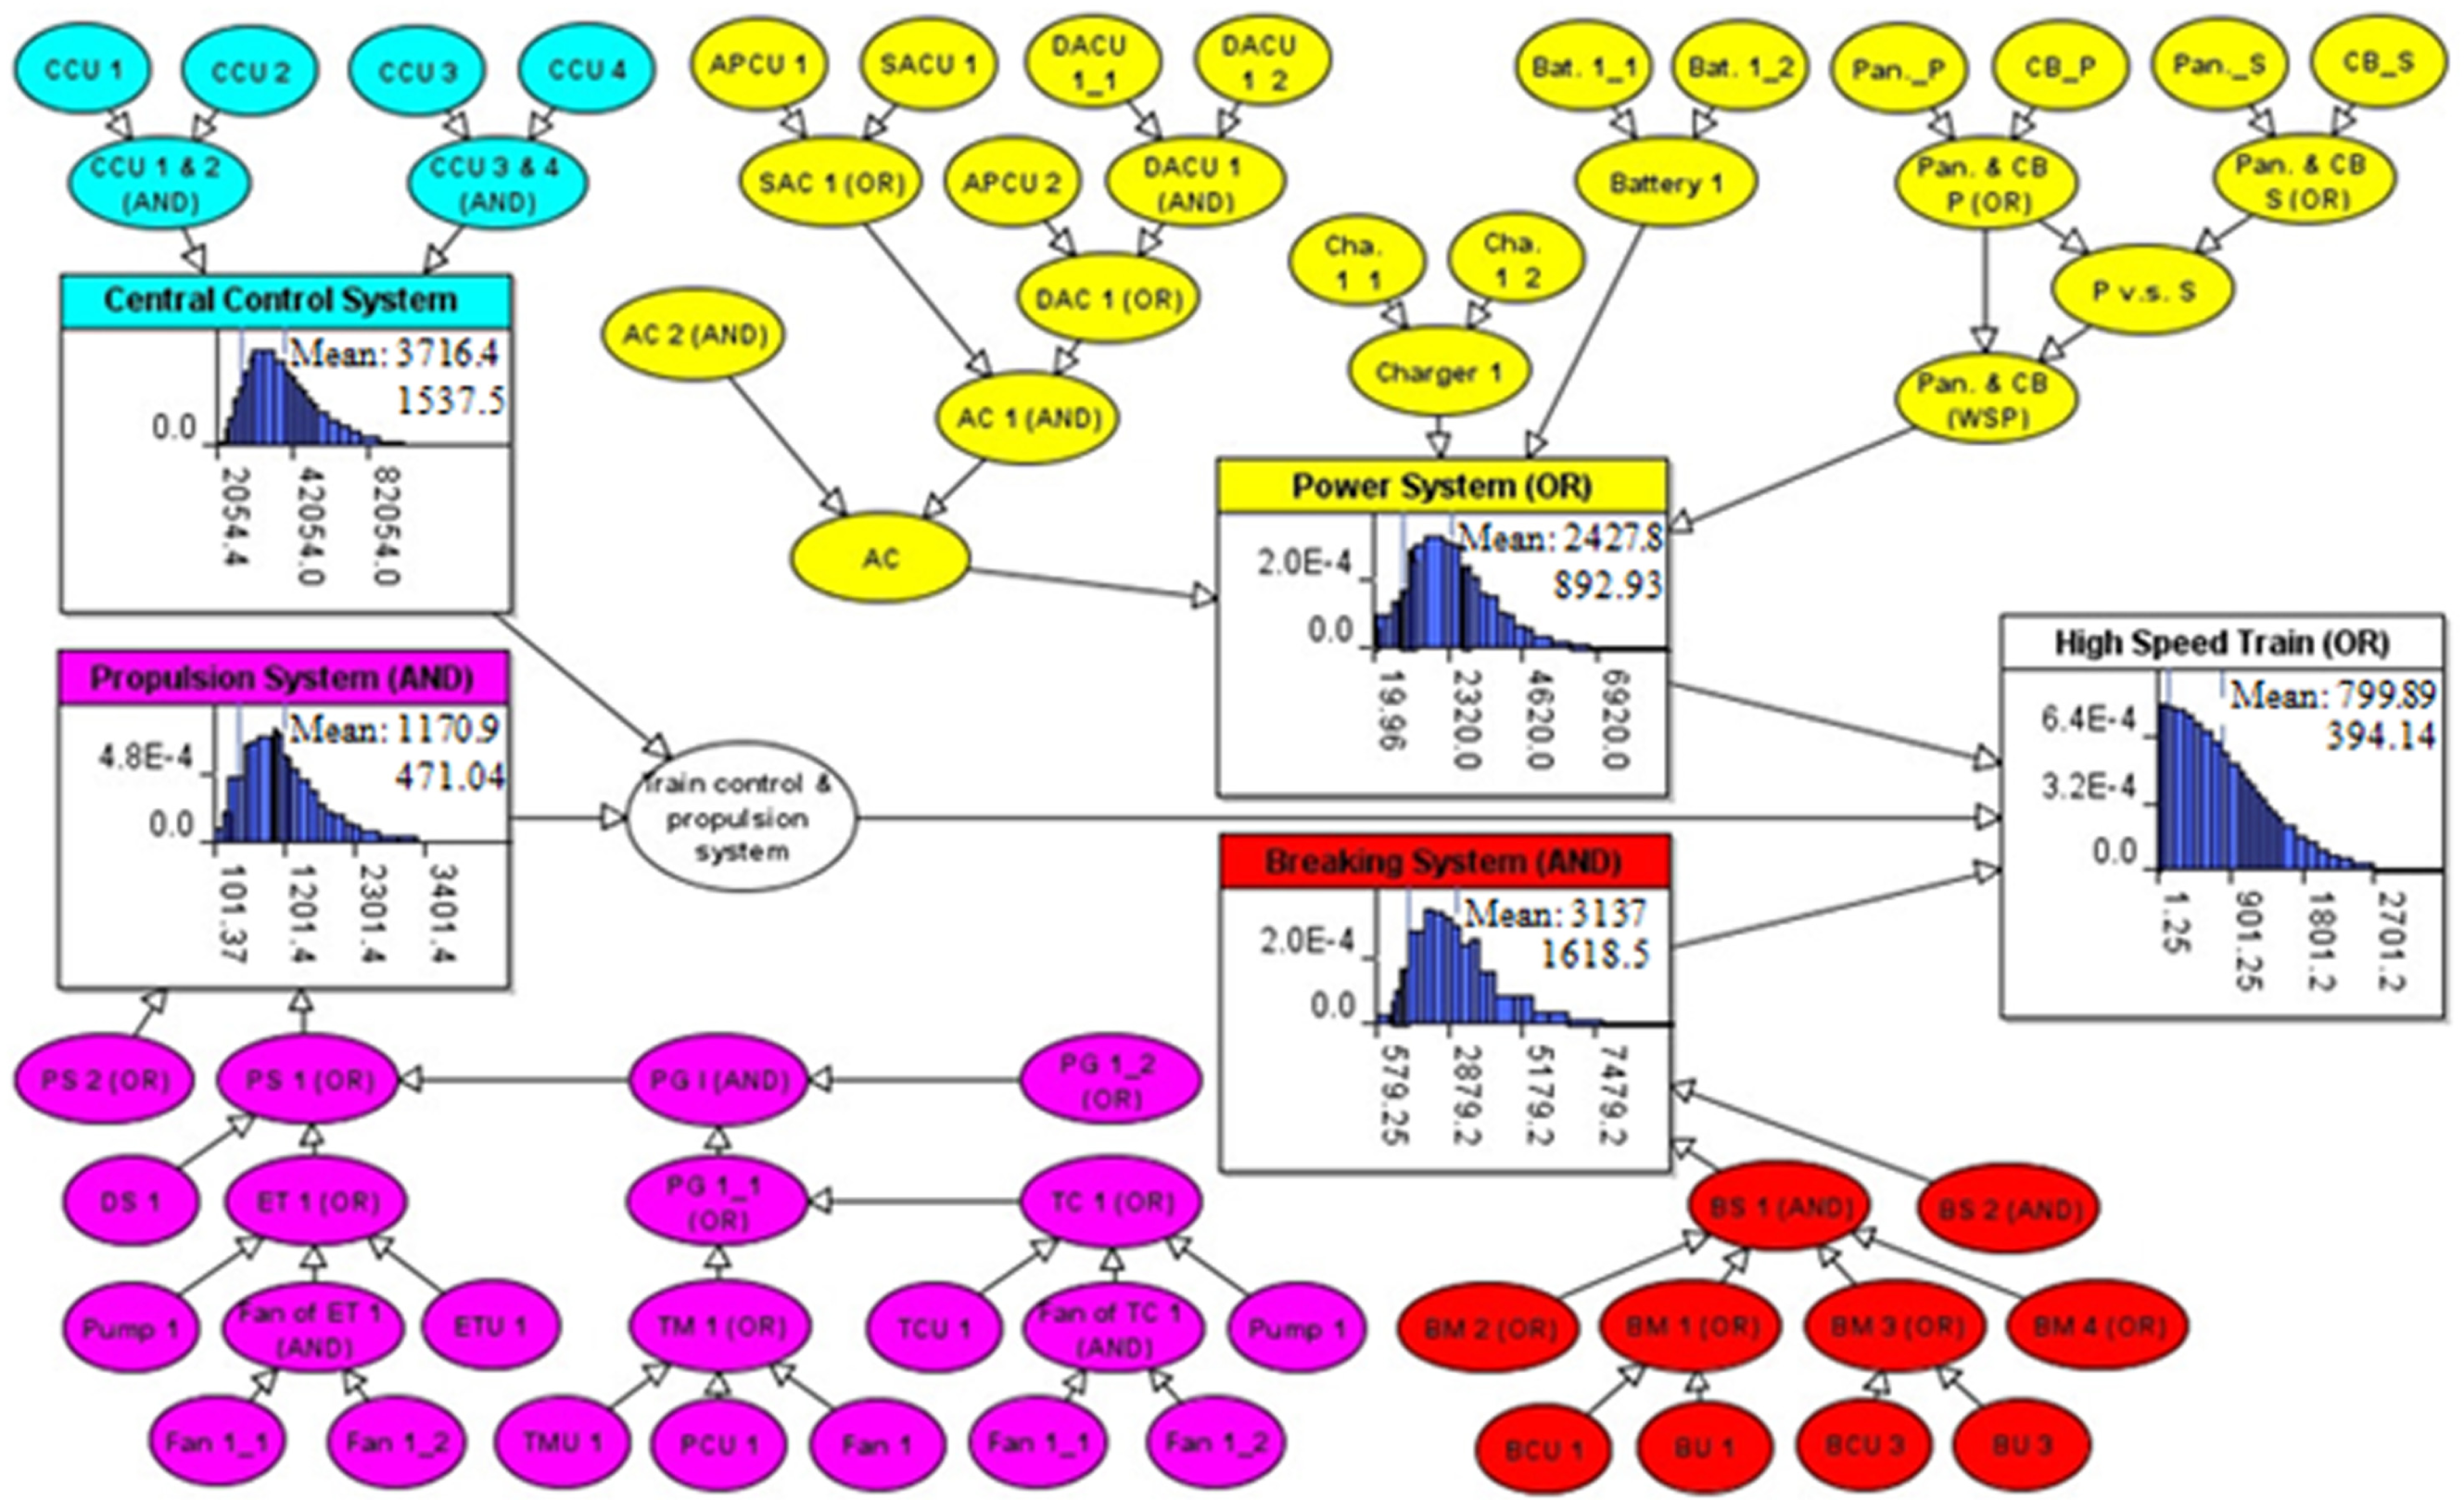
Bayesian network model for high-speed train.
Nodes within different systems are presented in different colors. The reliability density functions of the CCS, the PowS, the ProS, the BS, and the CRH380B are plotted in the figure. The mean time between failures (MTBF) and the 10-percentile reliability life of these systems are depicted together with their reliability density functions. Out of shrinkage of the displayed figure, some similar parts of the redundancy structure are hidden, leaving only the upper node of the structure. Such as the PowS in Figure 1, the node “AC 2 (AND)” has the same structure as the node “AC 1 (AND).” However, only the child nodes of the node “AC 1 (AND)” have been displayed.
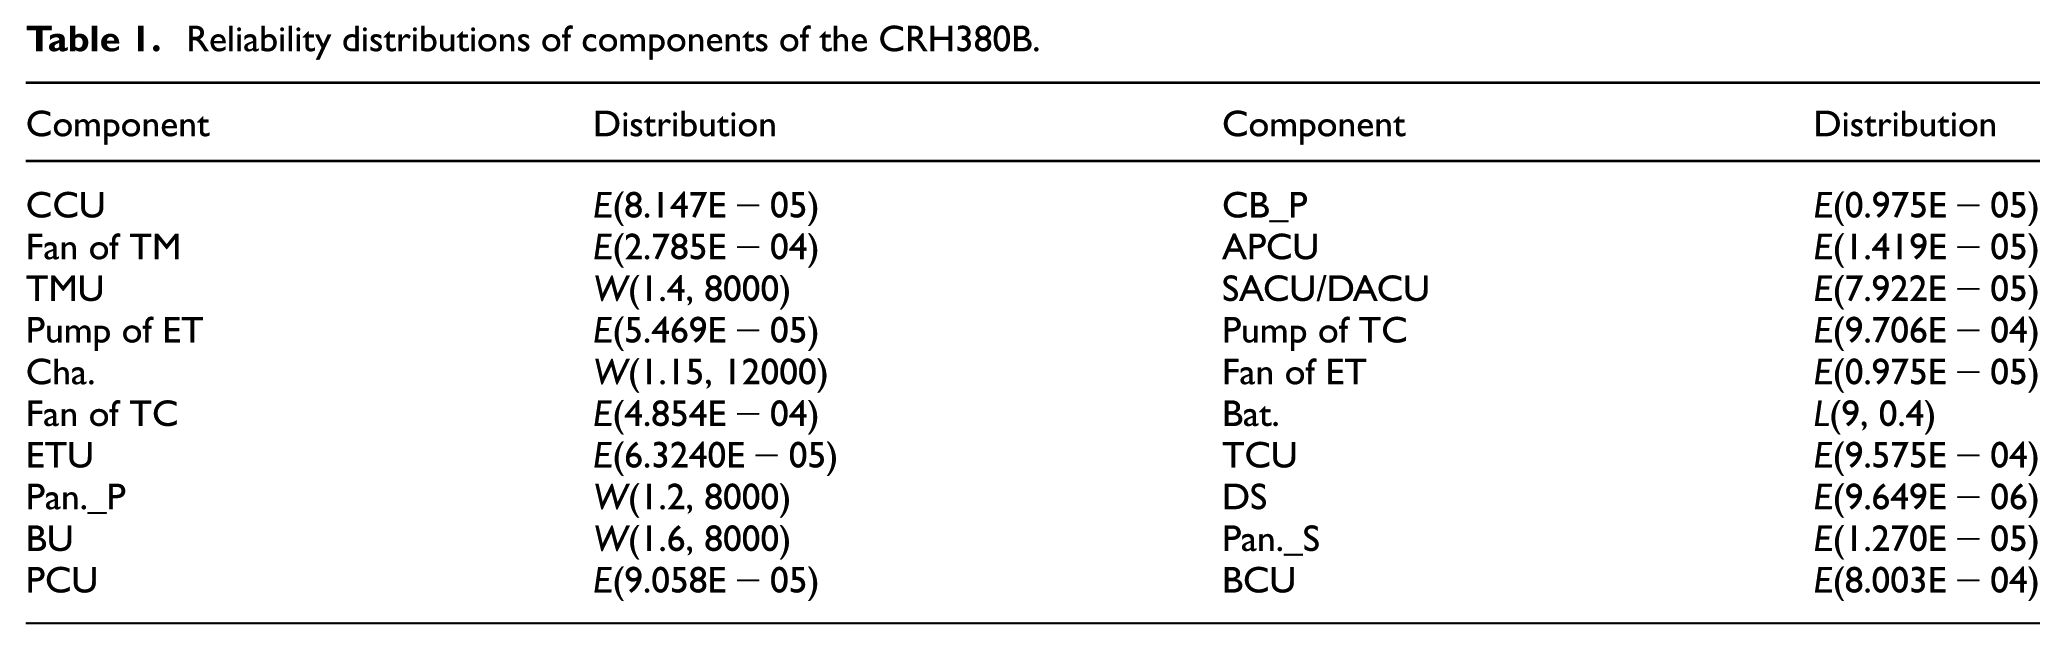
The prior reliability distributions of the components of the CRH380B are presented in Table 1. These reliability distributions of components can be obtained through reliability analysis of testing data, historical data, and even expert testimony. Moreover, the generality of reliability models included in the example has also been considered by incorporating the exponential (E), lognormal (L), and Weibull (W) distributions in this study.
Reliability distributions of components of the CRH380B.
Reliability analysis of the CRH380B
The reliability of HST at different observation time points is obtained using the predictive inference of the BN. The results are presented in Figure 6. The HST is operated in the day time; a daily inspection and maintenance action are implemented on the HST during the skylight time (12:00 am–4:00 am for CRH380B). The operation time of the HST ranges from 8 to 12 h. We are interested in the reliability of the HST per 24 h. Figure 6 indicates that the reliability of the HST maintains a high value over 240 h. It degrades from 1 to 0.9629 during this 240-h period. However, there is an apparent change of the reliability between 96 and 120 h. This change is due to the degradation of the reliability of the ProS and the PowS. As a result, a special attention should be laid on these two systems during the daily inspection and maintenance at a service time accumulated to 96 h. A preventive maintenance could also be implemented on these two critical systems if a high reliability is expected.
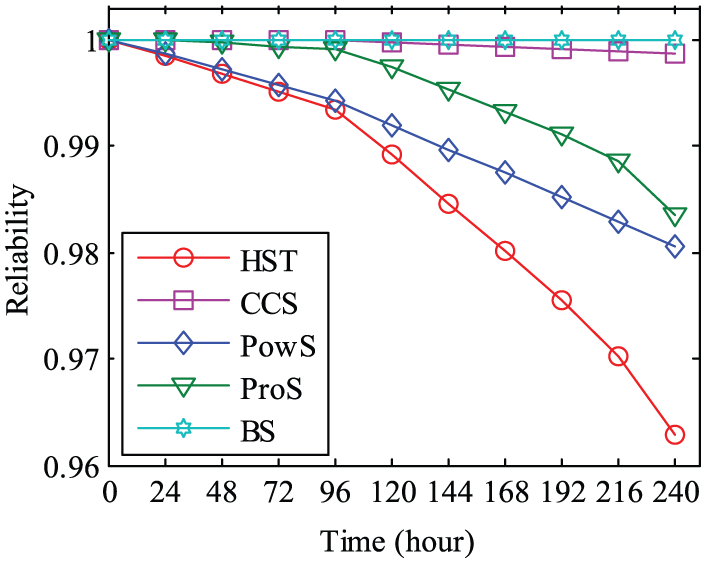
Reliability of HST and the prior reliability of critical systems.
Given the failure of the system at different observation times, the fault diagnosis through posterior reliability of critical systems of the HST can be obtained. To investigate the main contribution of the failure of HST, the differences of prior and posterior reliability of critical systems in the HST are presented in Figure 7.

Posterior reliability of critical systems, given the failure of the HST.
From Figure 7, it is found that the failure of the HST is mainly due to the unreliability of the PowS at the beginning and then changes to the PowS and ProS later. This pattern is in accordance with the results showed in the figure for the reliability of HST. Specifically, there is a gradual decrease in the comparison for the PowS and an increase in the comparison for the ProS. The differences of reliability for the CCS and BS maintain relatively low all the time.
For the management of the HST, a special attention should be paid to the PowS at the beginning of the service of the HST and then gradually moved to both the PowS and ProS. For the design of new generation of HST, an improvement should be laid on the components of the PowS and ProS. The reliability-based design optimization by considering multidisciplinary and various uncertainties can be used when newly updated PowS and ProS are implemented.33,34
BN for the reliability analysis and fault diagnosis of a critical component of the high-power solid-state laser
One type of high-power solid-state laser is used in a major scientific research instrument, which is developed for the experimental investigation of inertial confined fusion. The laser is designed to heat and compress capsules of hydrogen isotopes until they fuse, releasing energy. The high-power solid-state laser is one type of highly customized multi-component system, for which the test samples are limited and the available reliability information is spare. Reliability analysis of this kind of system is greatly challenged, due to the unavailability of the failure distributions of composing components and the diversity of the failure modes of customized systems. It is often difficult to obtain a precise reliability assessment for this kind of highly customized system.
Major interest of reliability analysis of the high-power solid-state laser in practical engineering lies in the investigation of the complex functional relationships, the diverse failure modes, and the failure propagating routes, which are aimed for further reliability improvement, failure mitigation, and operation management. To fulfill these requirements in practical engineering, a reliability analysis method, which simultaneously possesses the capability of describing complex functional and casual relationships, and the capability of implementing quantitative assessment and diagnosis, is needed. As described above, the BN can be well adopted to implement the reliability analysis of the system. A critical subsystem of the high-power solid-state laser, the gas switch subsystem, is used below to demonstrate the application of the BN for the reliability of highly customized systems.
According to the field data collected from the real application of the high-power solid-state laser, the customized gas switch subsystem has contributed more than 60% of the whole system failures. To analyze the reliability of the customized gas switch subsystem, the incorporation of the functional relationship among composing components and the use of the spare failure data collected in filed usage needs to be implemented jointly. The functional relationship among components is used to construct the reliability model by simultaneously describing the complex reliability relationship and characterizing the diverse failure modes. The failure data, generally presented as failure count data, are used to quantify the failure probabilities of the composing components.
BN of the customized gas switch subsystem
The main function of the customized gas switch subsystem is to control the on and off of the main PowS of the high-power solid-state laser. The functional relationship based on the operational process among the composing components is given in Figure 8, where the functional relationship is described as follows: the control module (CM) first sends a control signal to the trigger module (TM); the TM then starts to prepare a trigger pulse for the subsequent operation of the main gas switch module (MGSM); when the trigger pulse is ready and the trigger time is reached, the CM sends a trigger signal to the TM and the TM releases the prepared trigger pulse into the MGSM; the MGSM is then opened for a while, and during this time period, the electrical energy from the energy storage subsystem (ESS) passes through the MGSM and a magnetic insulation module (MIM) and transmitted to the laser; when the trigger pulse is consumed by the MGSM and the energy transition is finished, signals from the CM are sent to the gas module (GM) for the gas replacement both in the TM and the MGSM.

Structural relationships of the gas switch subsystem.
To construct the BN for reliability analysis of the gas switch subsystem, a functional failure mode effect analysis (FFMEA) is implemented based on the structural and functional relationships among the composing modules and components of the gas switch subsystem. The failures of the gas switch subsystem during the operation of the high-power solid-state laser have also been considered and analyzed in the FFMEA of the gas switch subsystem. Two major failure modes have been identified as the critical failure modes of the gas switch subsystem, which are the “unsuccessful trigger of the gas switch” and the “ahead-of-time trigger of the gas switch.” To further investigate the failure causes rooted in the composing components and the failure propagation within the gas switch subsystem, the fault trees of the two major failure modes of the gas switch subsystem are constructed as given in Figures 9–11. Within these fault trees, the nodes are encoded with specific failure codes, which are used in the reliability database designed for the high-power solid-state laser. The node “D02-F” refers to the “failure of the gas switch subsystem,” the nodes “D02-M01” and “D02-M02” refer to the “unsuccessful trigger of the gas switch” and the “ahead-of-time trigger of the gas switch,” respectively. The detailed descriptions of the remaining nodes are given in Tables 2 and 3.

Fault tree of the failure of the gas switch subsystem.
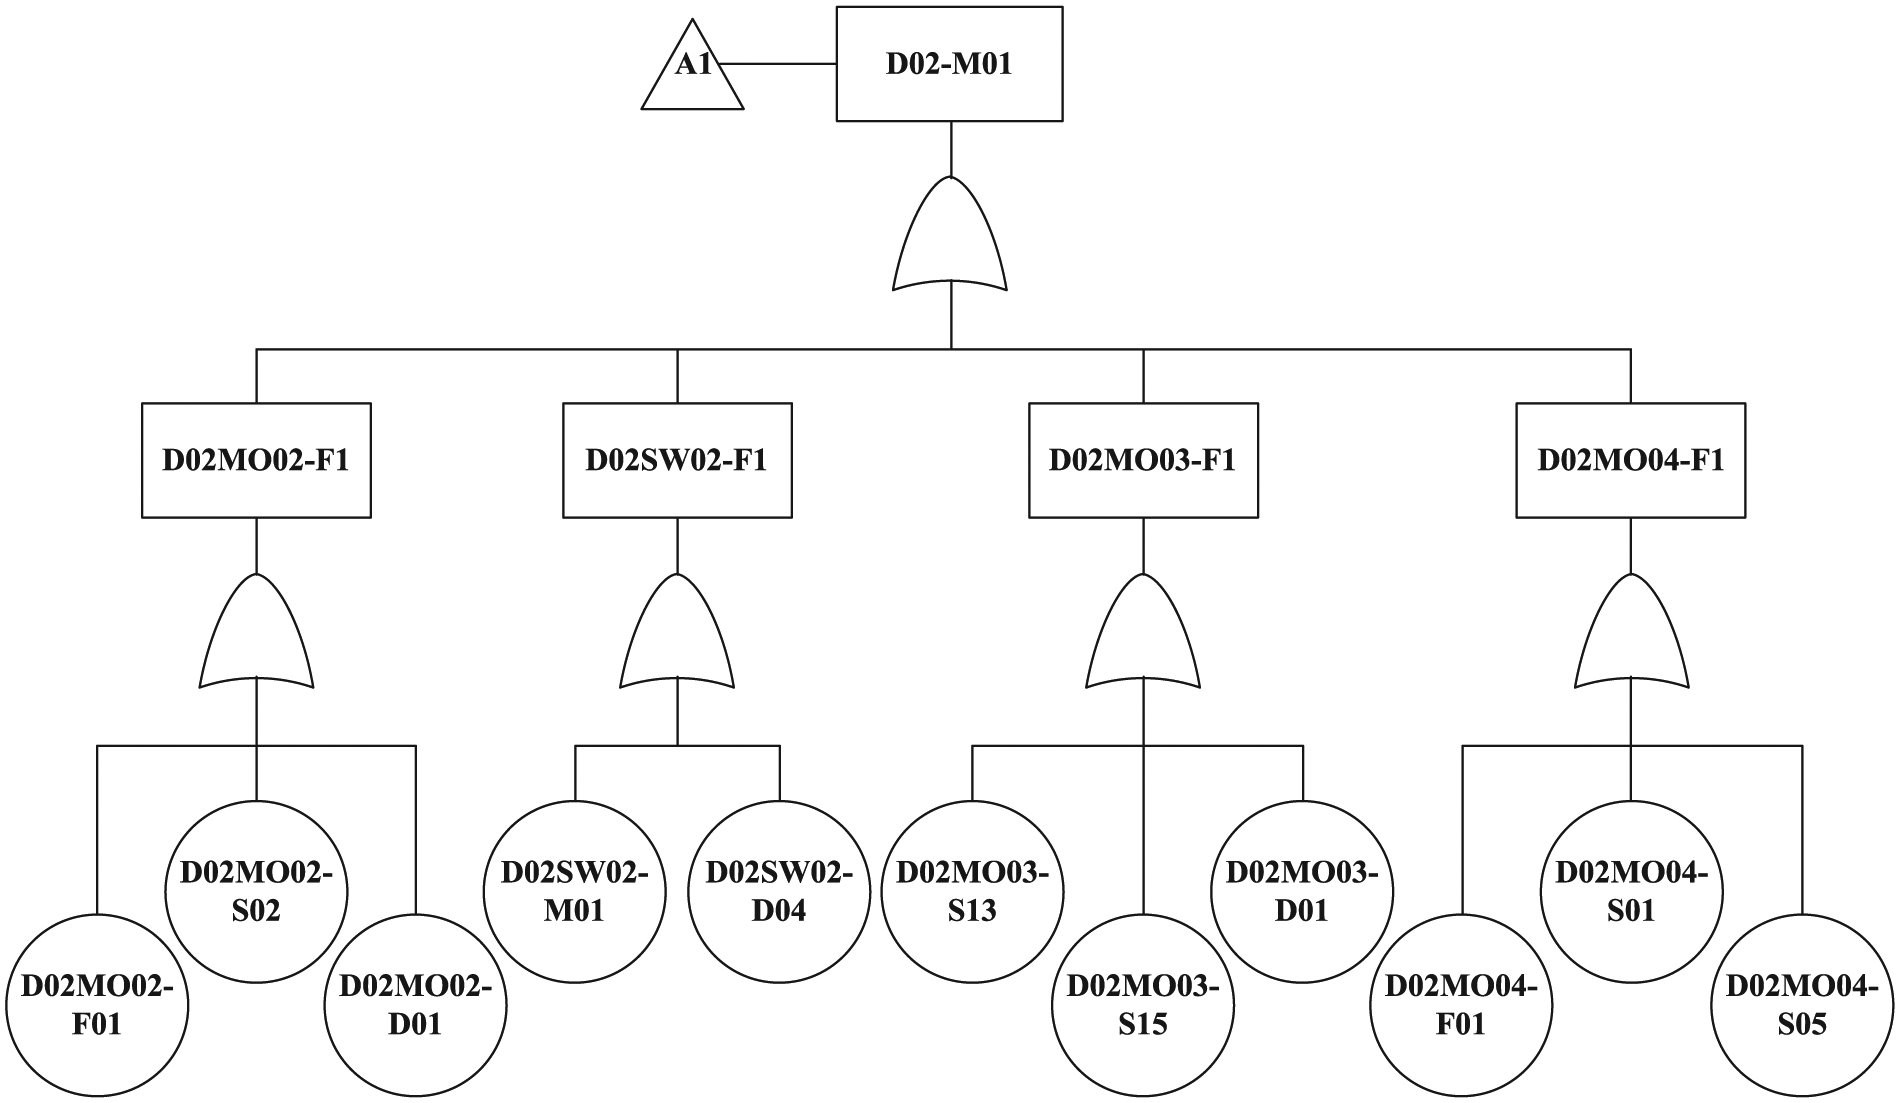
Fault tree of the unsuccessful trigger of the gas switch.
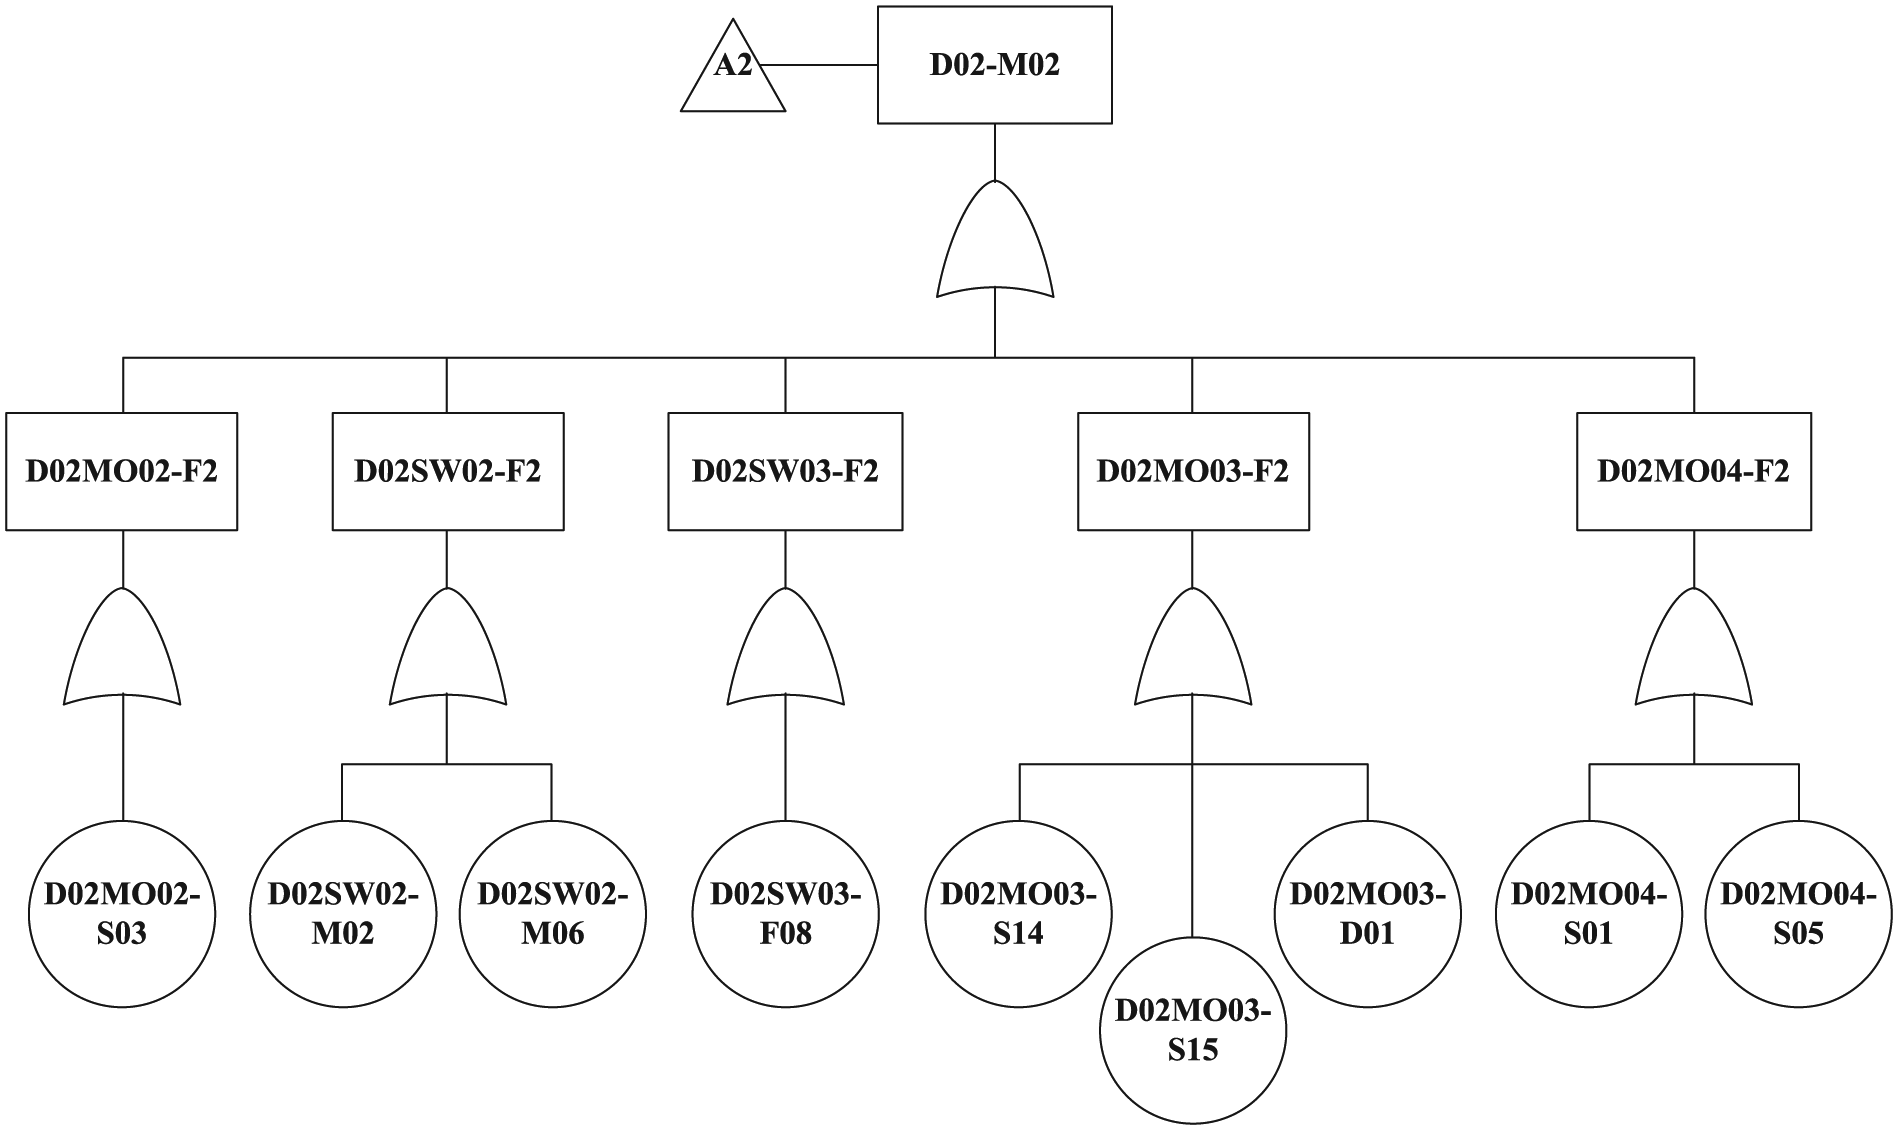
Fault tree of the ahead-of-time trigger of the gas switch.
Descriptions of the nodes in the fault tree for the D02-M01.

TM: traction motor; MGSM: main gas switch module; GM: gas module; CM: control module.
Descriptions of the nodes in the fault tree for the D02-M02.

TM: traction motor; MGSM: main gas switch module; GM: gas module; CM: control module.
The fault trees and the corresponding failure probabilities are then further described through the BN of the gas switch subsystem, which is given in Figure 12. The fault trees given in Figures 9–11 are qualitatively described by the graphic relationship of the nodes within the BN. The failure probabilities given in Table 2 and the logic relationships of the events are quantitatively described by the conditional probability diagram within the BN. Based on the BN, reliability analysis of the gas switch subsystem can be implemented.
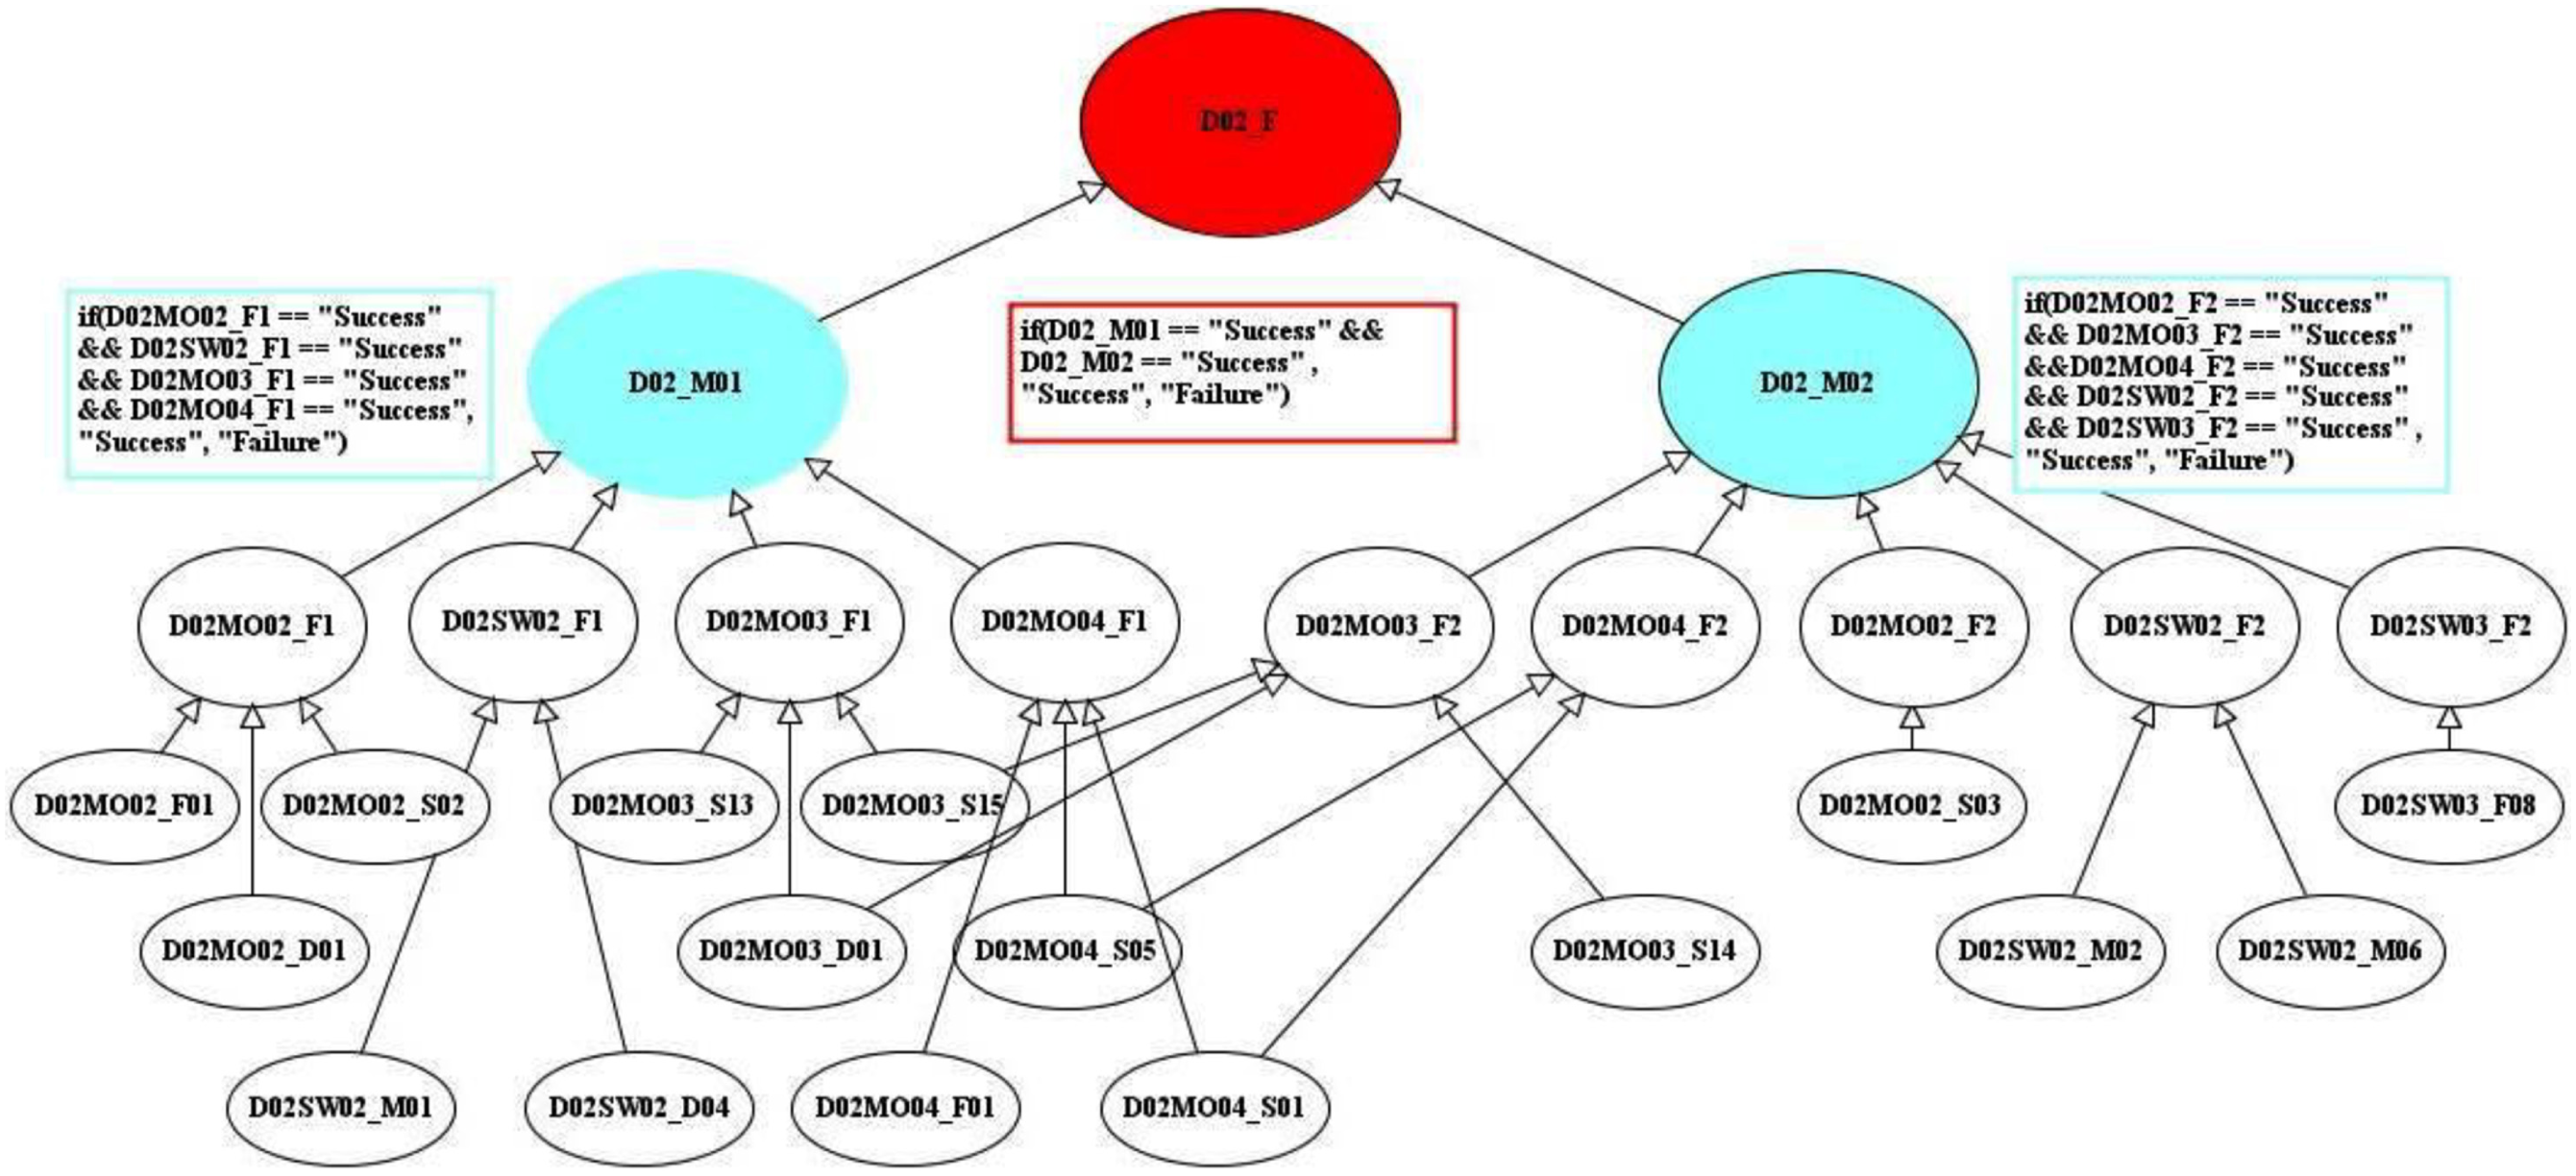
Bayesian network of the gas switch subsystem.
Reliability analysis and fault diagnosis of the gas switch subsystem
Based on the BN constructed for the gas switch subsystem, reliability assessment of the subsystem and failure diagnosis can be implemented, which separately depend on the forward and backward inference of the BN. The reliability assessment is first implemented by utilizing the AgenaRisk for carrying out the forward inference of the BN given in Figure 12. The reliability assessment results are presented in Figure 13. As shown in Figure 13, the probabilities of the nodes given in Table 2 are used as the inputs of the BN, which are presented as blue bars within the nodes together with the corresponding success probabilities of these nodes. The occurrence probabilities of the events of the “failure of the gas switch subsystem” with node “D02-F,” the “unsuccessful trigger of the gas switch” with node “D02-M01,” and the “ahead-of-time trigger of the gas switch” with node “D02-M02” are separately 0.00463, 0.00438, and 0.00298. The probabilities of the occurrences of the intermediate events are obtained as well.

Reliability assessment of the gas switch subsystem.
We then implement the failure diagnosis of the gas switch subsystem. By setting the occurrences of the “failure of the gas switch subsystem,” the “unsuccessful trigger of the gas switch,” and the “ahead-of-time trigger of the gas switch” jointly or individually, the probabilities of the occurrences of the nodes in the BN are updated. Based on the updated probabilities, we can figure out the contribution of the lower level events to the occurrence of the higher level events. First, by setting the occurrence of the “failure of the gas switch subsystem” individually, the updated result of the BN is given in Figure 14. From the updated results, we can figure that the “unsuccessful trigger of the gas switch” contributes 46.401% of the “failure of the gas switch subsystem” and the “ahead-of-time trigger of the gas switch” contributes 53.599% of the “failure of the gas switch subsystem.” On further checking of the updated BN, we found that the occurrences of the “D02MO02-F01” and the “D02MO02-S03” separately contribute the most to the occurrences of the “unsuccessful trigger of the gas switch” and “ahead-of-time trigger of the gas switch.” To improve the reliability of gas switch subsystem, in-deep analysis of the trigger module is needed because both “D02MO02-F01” and “D02MO02-S03” are the failure modes associated with the trigger module. For the trigger module, the electromagnetic interference, component degradation, and material fatigue may be the major causes; qualitative or quantitative reliability analysis considering these aspects needed to be implemented, and some illustrative studies on reliability analysis include the work 35 on electromagnetic interference, the degradation-based reliability analysis and estimation methods,36–38 and the methods dealing with material fatigue.39,40
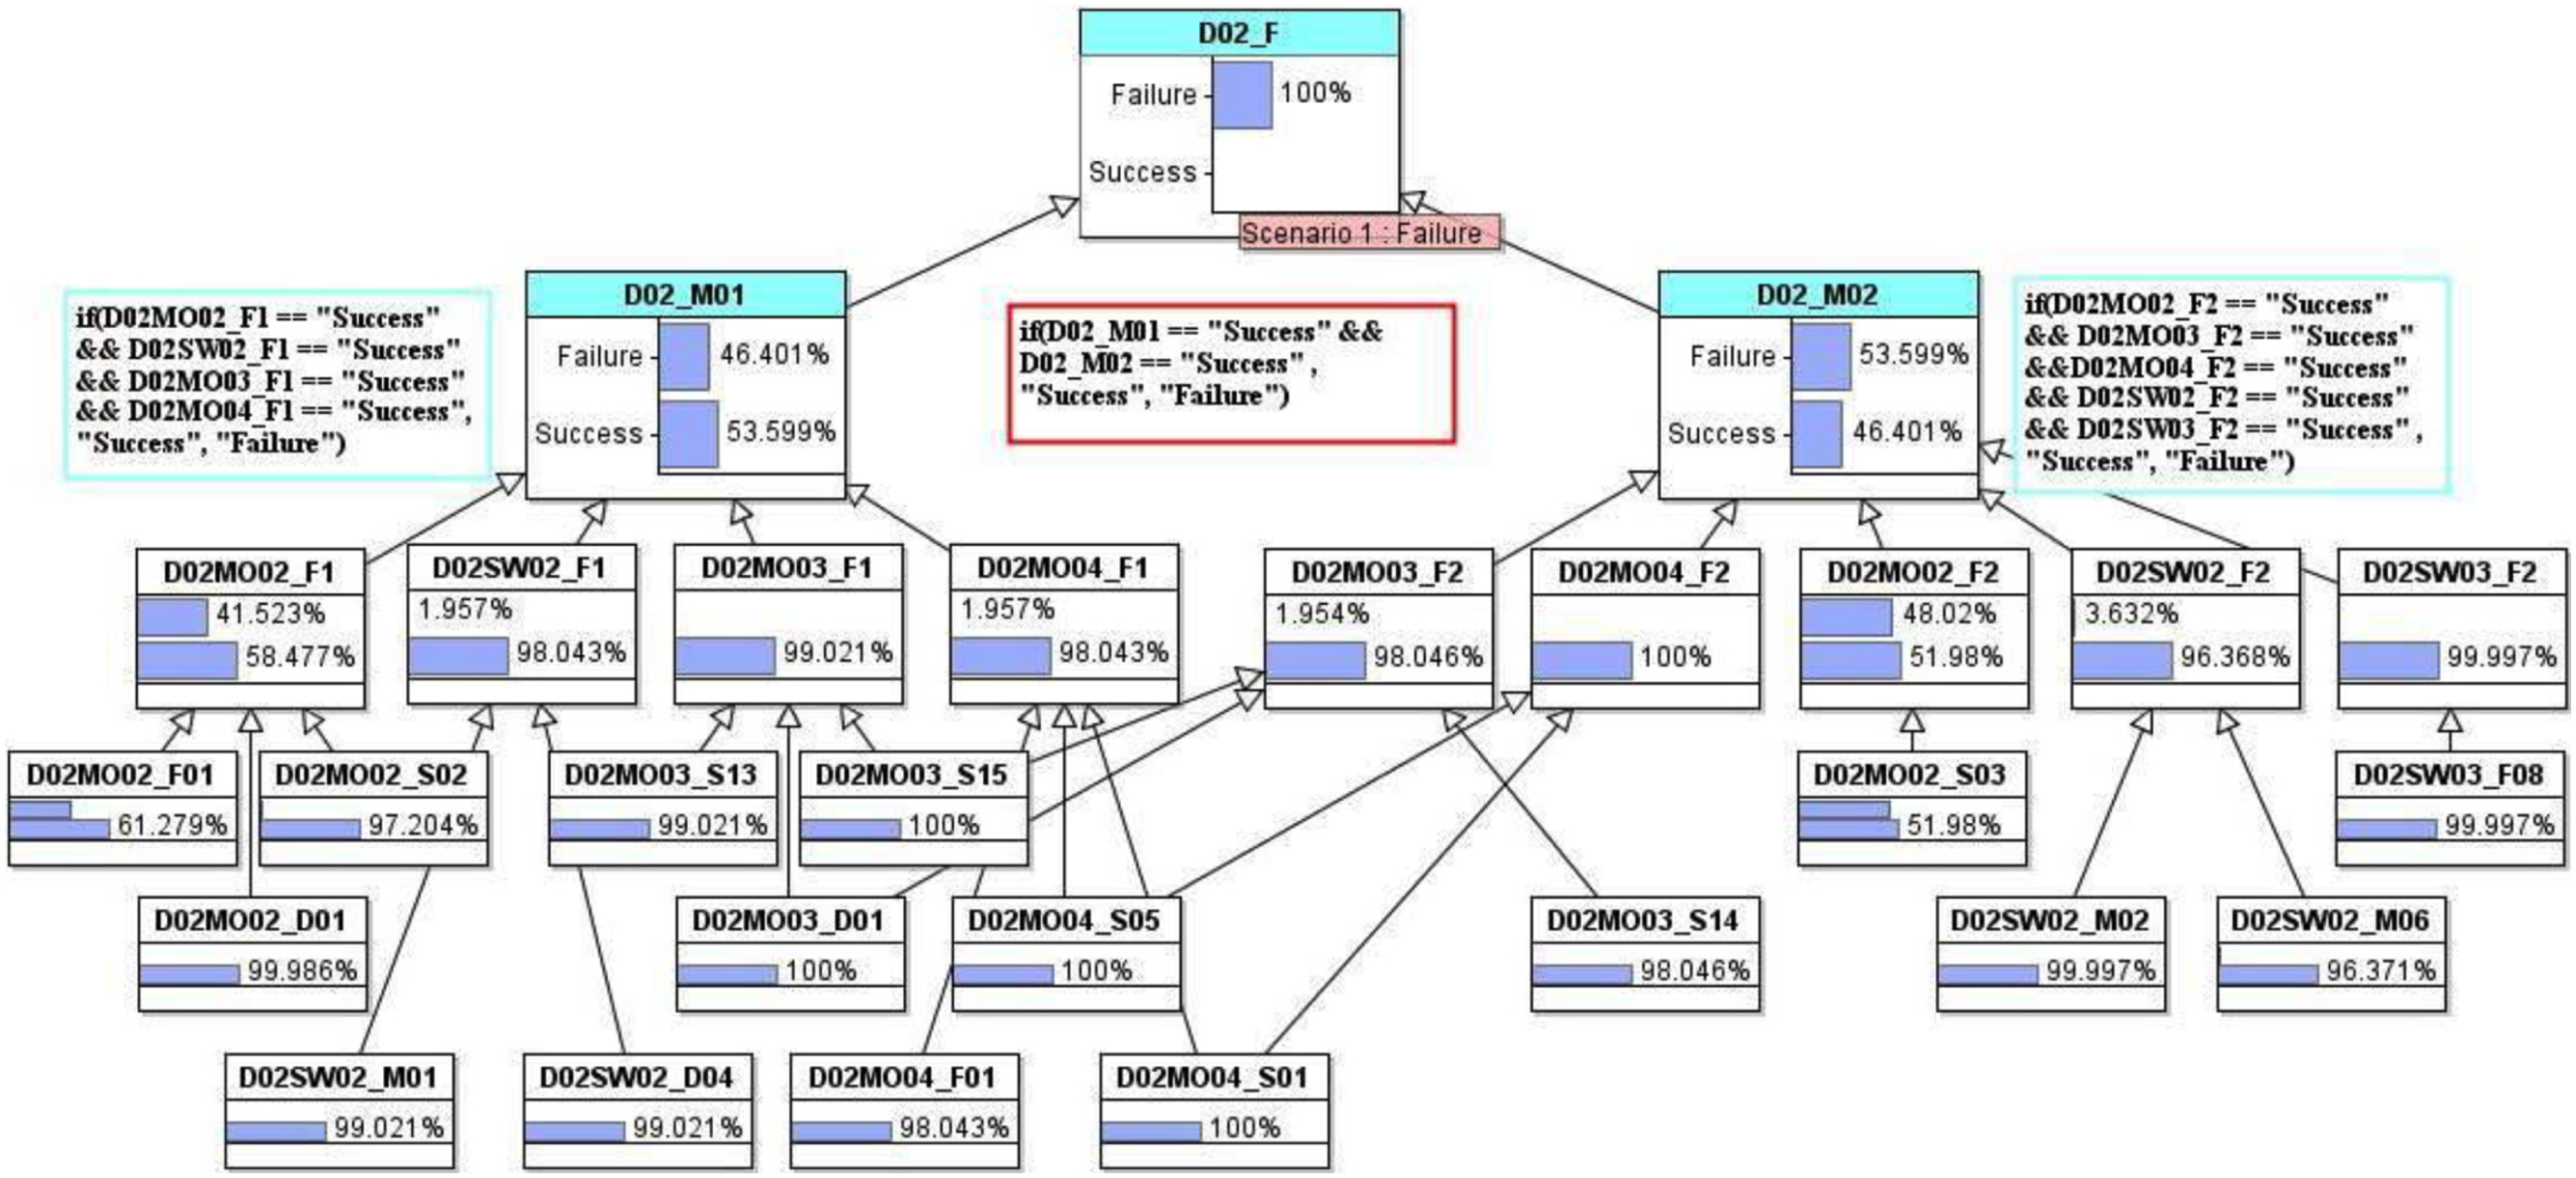
Updated Bayesian network with the occurrence of the D02-F.
Furthermore, letting the joint occurrences of the “failure of the gas switch subsystem” and the “unsuccessful trigger of the gas switch,” the updated BN is shown in Figure 15. The occurrence of the “D02MO02-F01” is confirmed as the major failure cause. Similarly, by letting the joint occurrences of the “failure of the gas switch subsystem” and the “ahead-of-time trigger of the gas switch,” the updated BN is shown in Figure 16, and the occurrence of the “D02MO02-S03” is confirmed as the major failure cause.

Updated Bayesian network with the occurrences of the D02-F and D02-M01.

Updated Bayesian network with the occurrences of the D02-F and D02-M02.
Based on the failure diagnosis implemented through the BN, the diagnosis path of the occurrence of the “failure of the gas switch subsystem” is given as follows: D02-M01 → D02MO02-F1 → D02MO02-F01, and D02-M02 → D02MO02-F2 → D02MO02-S03. Further reliability improvement should be focused on the mitigation of the occurrences of the “D02MO02-F01” and “D02MO02-S03.” In addition, the common causes shared by the “D02-M01” and “D02-M02,” which are “D02MO03-D01,”“D02MO03-S15,”“D02MO04-S01,” and “D02MO04-S05,” does not contribute too much to the occurrence of the “failure of the gas switch subsystem.” These low contributions of the common causes to the subsystem failure are mainly due to the low probabilities of these events and the mutual exclusion relationship between the occurrences of “D02-M01” and “D02-M02.”
Conclusion
BN is investigated in this article for reliability analysis of complex systems. Two real cases are studied in detail to demonstrate the capability of the BN, which include the reliability analysis of a high-speed train and a subsystem of a high-power solid-state laser. The case of the high-speed train is used to demonstrate the BN for complex system with standardized components, where reliability distributions of these components are available, and complex system structures including cold standby and hot standby structures exist in the system. The case of the subsystem of a high-power solid-state lase is used to study the BN for complex system with highly customized components, where failure probabilities of these components are collected, and various failure modes including mutual exclusive failure modes and common cause failures co-exist in the reliability analysis. Both reliability assessment and fault diagnosis are investigated through the two cases.
For the high-speed train, the results demonstrate that an obvious change of the HST’s reliability occurred at the time interval between 96 and 120 h. Meanwhile, the PowS and the ProS are the critical systems of the HST. Particular attention is suggested to lay on these two systems when carrying out daily investigation and maintenance of the HST. Spare redundancy should be assigned for the PowS and ProS when new generation of HST is designed. For the gas switch subsystem of the high-power solid-state lase, the results indicate that “unsuccessful trigger of the gas switch” and the “ahead-of-time trigger of the gas switch” separately contributes 46.401% and 53.599% of the “failure of the gas switch subsystem.” Two diagnosis paths for the “failure of the gas switch subsystem” are identified as D02-M01 → D02MO02-F1 → D02MO02-F01 and D02-M02 → D02MO02-F2 → D02MO02-S03. The low contribution of the common causes to the gas switch failure is mainly due to the low probabilities of these events and the mutual exclusion relationship between the occurrences of “D02-M01” and “D02-M02.” Further reliability improvement is suggested to focus on the mitigation of the occurrences of the “D02MO02-F01” and “D02MO02-S03.”
Future research will be laid on the combination of hierarchical Bayesian method and BN for reliability assessment of complex system with multilevel heterogeneous data sets. Incorporation of uncertainty quantification and dynamic importance measure into BN-based reliability method is also of interest for further research.
Footnotes
Appendix 1
Handling Editor: Dong Wang
Declaration of conflicting interests
The author(s) declared no potential conflicts of interest with respect to the research, authorship, and/or publication of this article.
Funding
The author(s) disclosed receipt of the following financial support for the research, authorship, and/or publication of this article: The paper is supported in part by National Natural Science Foundation of China under grant no. 51605081 and in part by the Fundamental Research Funds for the Central Universities under grant no. ZYGX2016KYQD119.