
Abstract
This article obtains the impact data of drivers’ unsafe driving behaviors to urban traffic flow through spot field investigation, questionnaires, and traffic accidents dossier. The influence of drivers’ unsafe driving behaviors (driving on the road markings, short following distance, being forced to change lanes, and illegal parking) to the vehicle speed is analyzed, and the impact descending order (illegal parking, being forced to change lanes, driving on the road markings, and the last is short following distance) of the four typical unsafe driving behaviors to the vehicle speed is obtained. At the same time, the impact descending order (being forced to change lanes, short following distance, illegal parking, and the last is driving on the road markings) of the four typical drivers’ unsafe driving behaviors to the traffic flow density is obtained. Some of the unsafe situation which is caused by the drivers’ unsafe driving behaviors is analyzed, such as the lane suddenly narrowing but the number of lanes does not change, reducing the number of lanes, and lane exit confusion. According to these, the basic road traffic capacity is corrected under the road condition of drivers’ unsafe driving behaviors. The research results provide a theoretical basis for improving the relevant laws and regulations, which has an important theoretical and practical value on improving the transportation efficiency and the safety standards of the road traffic system.
Keywords
Introduction
Through dossier, it was found that due to the drivers themselves, 2244 traffic accidents happened and caused 1266 deaths only in the first half year of 2014 in Yunnan Province in China. Due to the drivers’ unawareness of traffic safety and traffic risks, unsafe driving behaviors generally exist in the daily traffic, which are easy to cause traffic risks and paralyze the entire traffic system. Building a safe and harmonious automobile society is urgently needed. Some unsafe or illegal driving behaviors will have an adverse impact on the road traffic operation and even lead to traffic accidents directly or indirectly.
In fact, it would cause hidden troubles to the road traffic safety due to the drivers’ lack of safety knowledge and unsafe driving habits. The jurisdiction freeway accident survey data by the United States of California highway management departments show that human factors accounted for 89.95% of the total traffic accidents. Japanese researchers think that illegal driving modes cause 85% of deaths. The research results show that about 45% of the lives in all the potentially fatal car accident could be saved if the drivers could use the safety belt correctly, and this proportion will increase to 60% if the drivers use airbag at the same time. Traffic accident statistics also show that the standard driving behaviors and road traffic safety are closely related to Chinese public security departments.
According to traffic accident data of 20 European countries for more than 10 years, University College London professor RJ Smeed did regression analysis between the accident frequency and the driver’s individual driving characteristics and established the Smid model in 1949. 1 NP Button and PM Reilly 2 analyzed systematically the red light time distribution of accident, location, and population, but not analyzed quantitatively. Australian Roads and Traffic Authority (RTA) 3 shows that there is an exponential relationship between speed and risk. The traffic accident is 20% owing to drowsiness appearing in the driving process. 4 The Traffic Management Department in mid-Sweden found that the death rate of 15%–36% due to accident was caused by lack of sleep. 5 The statistics of Traffic Management Bureau of New York City in the United States show that 30% of the highway traffic accident deaths are caused by fatigue driving. 6 Through the analysis of 1467 young drivers’ random survey data, Koushki and Bustan 7 found that the probability of traffic accident of male drivers who have unsafe driving habits like smoking and not fastening safety belt is higher than other populations. Through the experiment of the 14,985 drivers in Florida, it is found that when the driver’s blood alcohol content is 0.04 g/dL, the incidence of rear-end collision of vehicles significantly increased. 8 Study found that the accident probability is high in the condition of talking on the phone while driving, fatigue driving, risk-taking behaviors during driving, and the preliminary estimation model is given. 9 Y Li et al. 10 studied on the events of collision accidents according to the data of drivers’ illegal behaviors. Aarts and Van Schagen 11 established the index model to describe the relationship between driving speed and collision probability. Research found that the use of phones during driving directly causes rear-end collision, while further analysis showed that drunk driving causes higher probability of rear-end collision than normal driving modes. 12 Logit model is used to predict the probability of occurrence of vehicle accidents. 13 Driving style recognition method based on driver’s dynamic demand is used as well. 14
Influenced by the economic and social conditions, drivers’ safety awareness, customs, and other factors are different between China and other countries. The researches about unsafe driving behaviors in China are urgently needed. This article has discussed the influence of unsafe driving behaviors on urban traffic flow and also makes the quantitative research from the statistics that are collected. The influence of drivers’ unsafe driving behaviors to the vehicle speed is analyzed, and the impact descending order of the four typical unsafe driving behaviors to the vehicle speed is obtained. At the same time, the impact descending order of the four typical drivers’ unsafe driving behaviors to the traffic flow density is obtained. Some of the unsafe situation which is caused by the drivers’ unsafe driving behaviors is analyzed, such as the lane suddenly narrowing but the number of lanes does not change, reducing the number of lanes, and lane exit confusion.
Method
The covariance model analysis of survey data is done with the help of SPSS, and the selected data are consistent with the conditions of analysis of covariance.
When the traffic density is small, the subsequent vehicles deceleration or waiting in line is described by Poisson distribution once the vehicles ahead park by the roadside.
Influence of typical drivers’ unsafe driving behaviors on vehicle speed
Through on-site survey, the relationship between the number of traffic volume and percentage of driving on the road markings, short following distance, being forced to change lanes, and illegal parking is obtained. According to the investigation data, four kinds of unsafe driving behaviors like driving on the road markings, short following distance, being forced to change lanes, and illegal parking are analyzed. Analysis of various behaviors using 5 min as a time unit is shown in Figures 1–4.

Relationship between traffic volume and percentage of driving on the road markings.

Relationship between traffic volume and percentage of short following distance.

Relationship between traffic volume and percentage of being forced to change lanes.
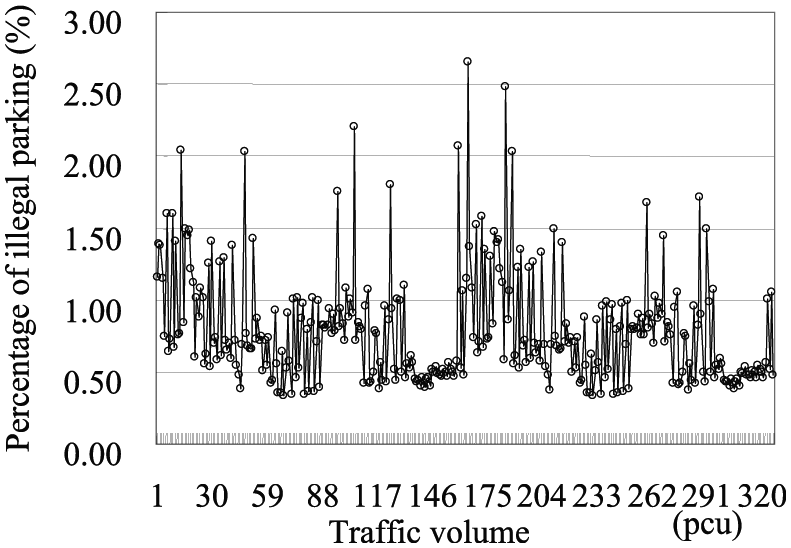
Relationship between traffic volume and percentage of illegal parking.
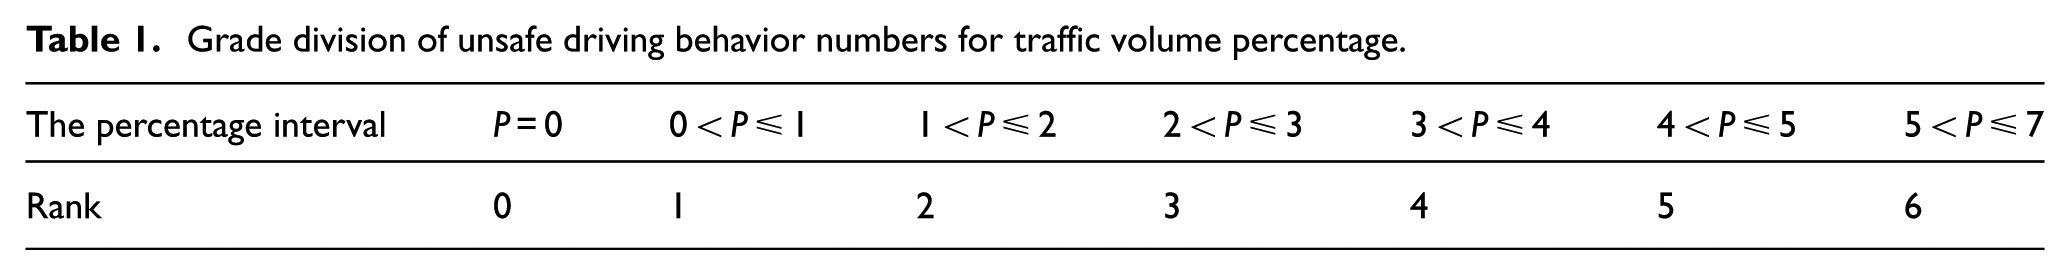
It can be seen that all the percentages are less than 7%. In order to do the covariance analysis, the proportion of unsafe behaviors in the traffic volume grade is used, which is depicted in Tables 1–3.
Grade division of unsafe driving behavior numbers for traffic volume percentage.
Classification of the actual sample data rank.

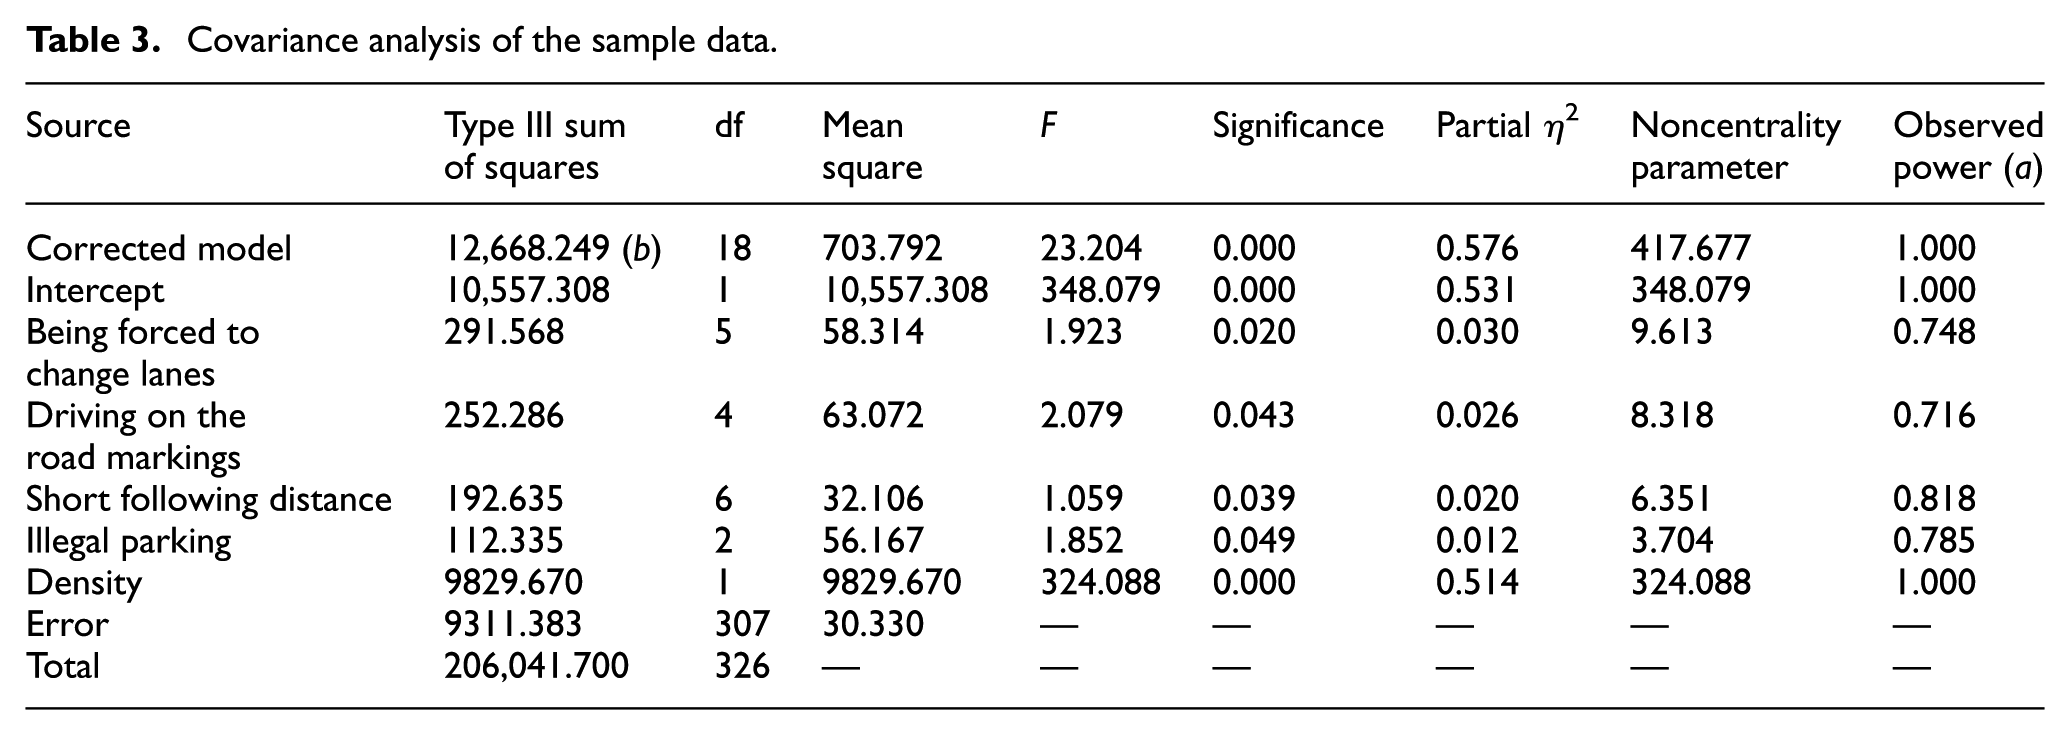
Covariance analysis of the sample data.
To deal with the survey data in accordance with the above methods, the scatter velocity and density of the selected sample of the diagram are shown in Figures 5–8. The selected data are consistent with the conditions of analysis of covariance. The usage of the covariance analysis influencing model on typical unsafe driving behaviors to velocity is appropriate.

Distribution of different levels of driving on the road markings and speed.

Distribution of different levels of short following distance and speed.
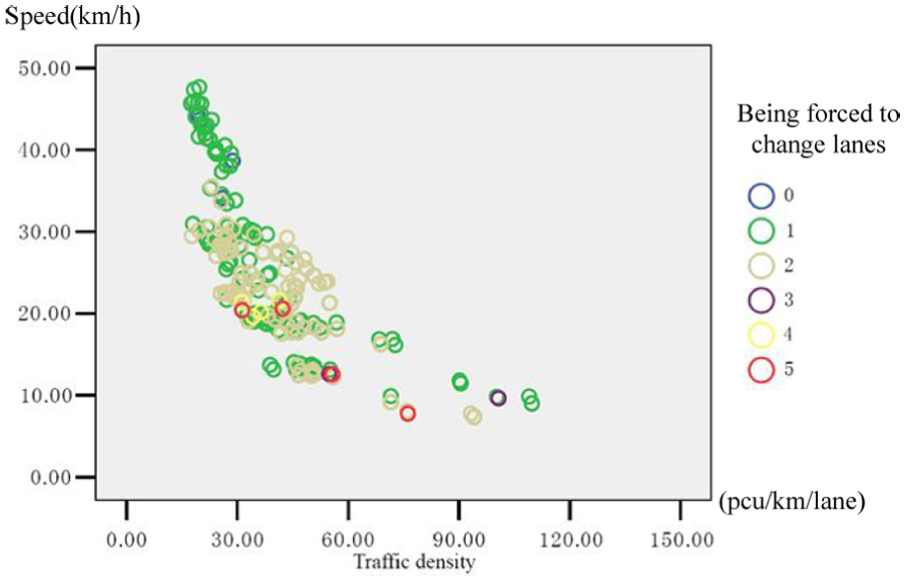
Distribution of different levels of being forced to change lanes and speed.

Distribution of different levels of illegal parking and speed.
The covariance model analysis of survey data is done with the help of SPSS. The residual distribution variance analysis can be seen in the overall fitting model in Figure 9. The effect of each factor to speed is very significant (Sig ≤ 0.05), and test effectiveness index was higher and the sample size is sufficient.

Residuals of covariance analysis model.
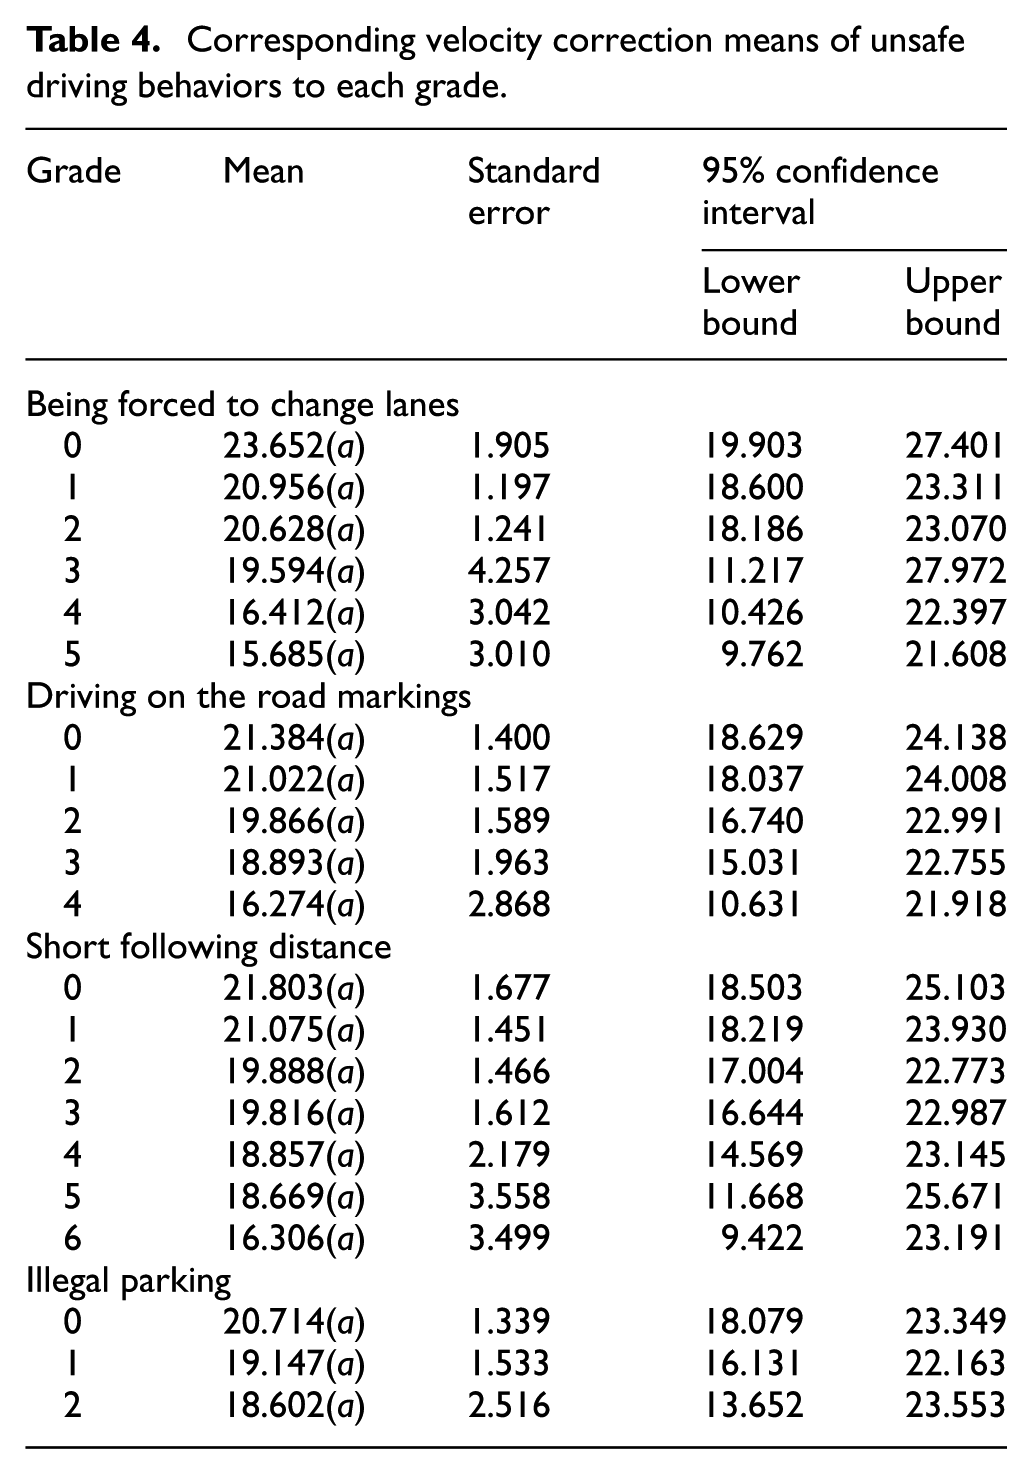
The corresponding velocity correction means of unsafe driving behaviors to each grade can be acquired through further analysis as shown in Table 4 and Figures 10–13. It shows that the total traffic volume ratio of unsafe driving behaviors will make the speed reduce, of which the average forced changing times increasing by one grade, the speed will reduce by 21.1% (0 grade as reference) through the above analysis. The increase in unsafe driving behaviors accounting for the detailed results is shown in Table 5.
Corresponding velocity correction means of unsafe driving behaviors to each grade.
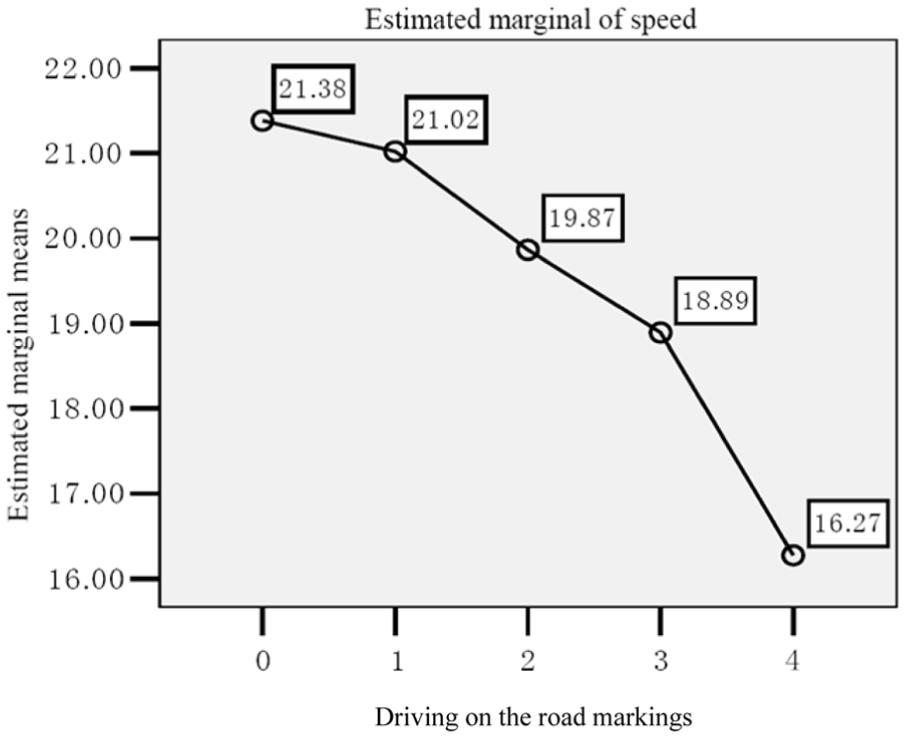
Each level of driving on the road markings corresponding to speed.
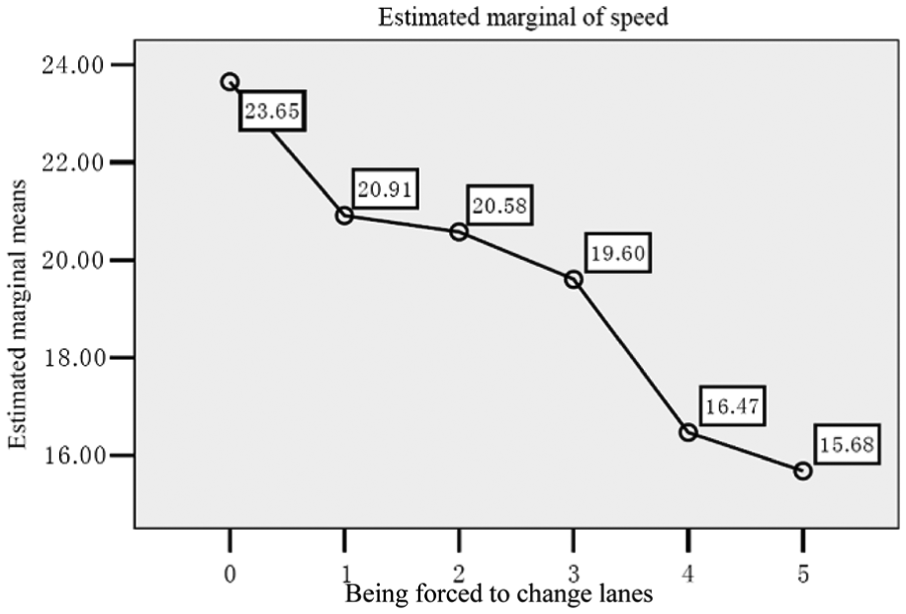
Each level of being forced to change lanes corresponding to speed.
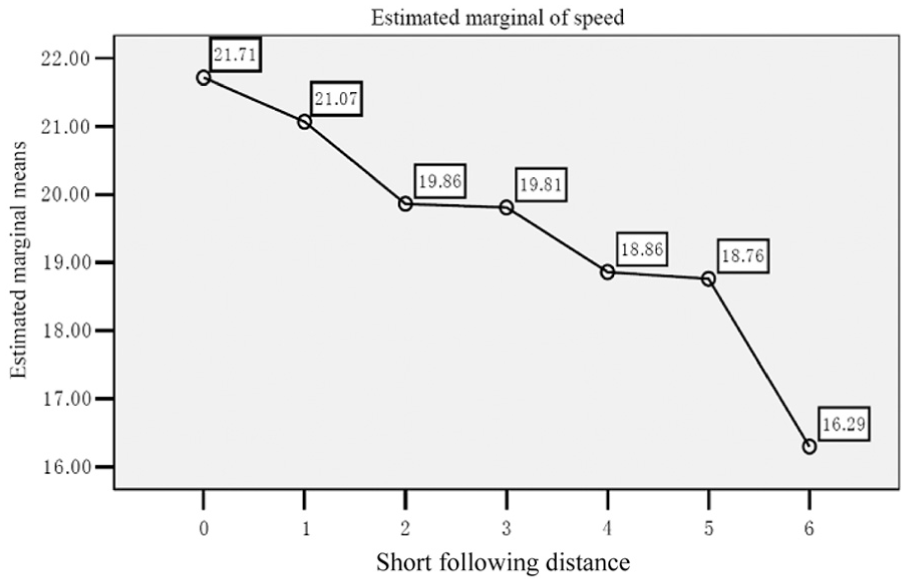
Each level of short following distance corresponding to speed.
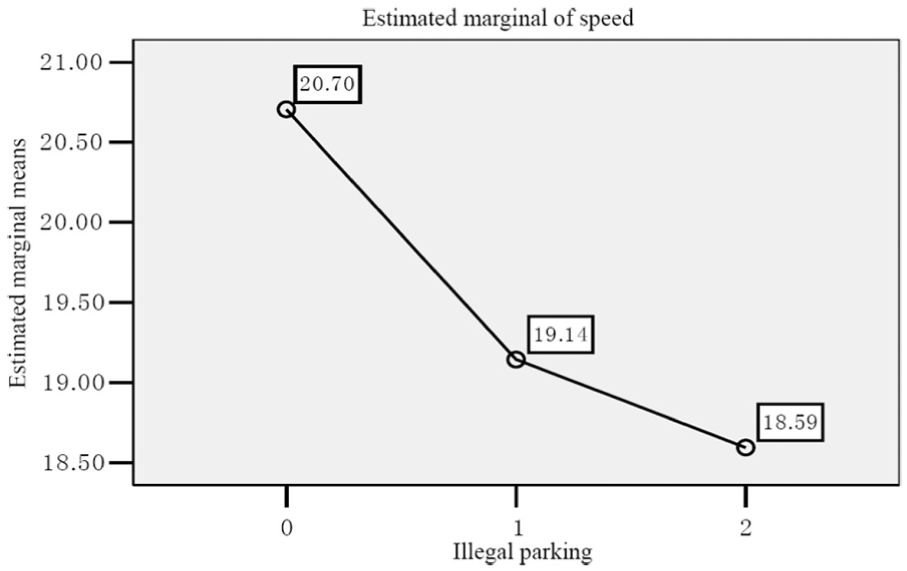
Each level of illegal parking corresponding to speed.
Influences of various grades of unsafe driving behavior on speed.
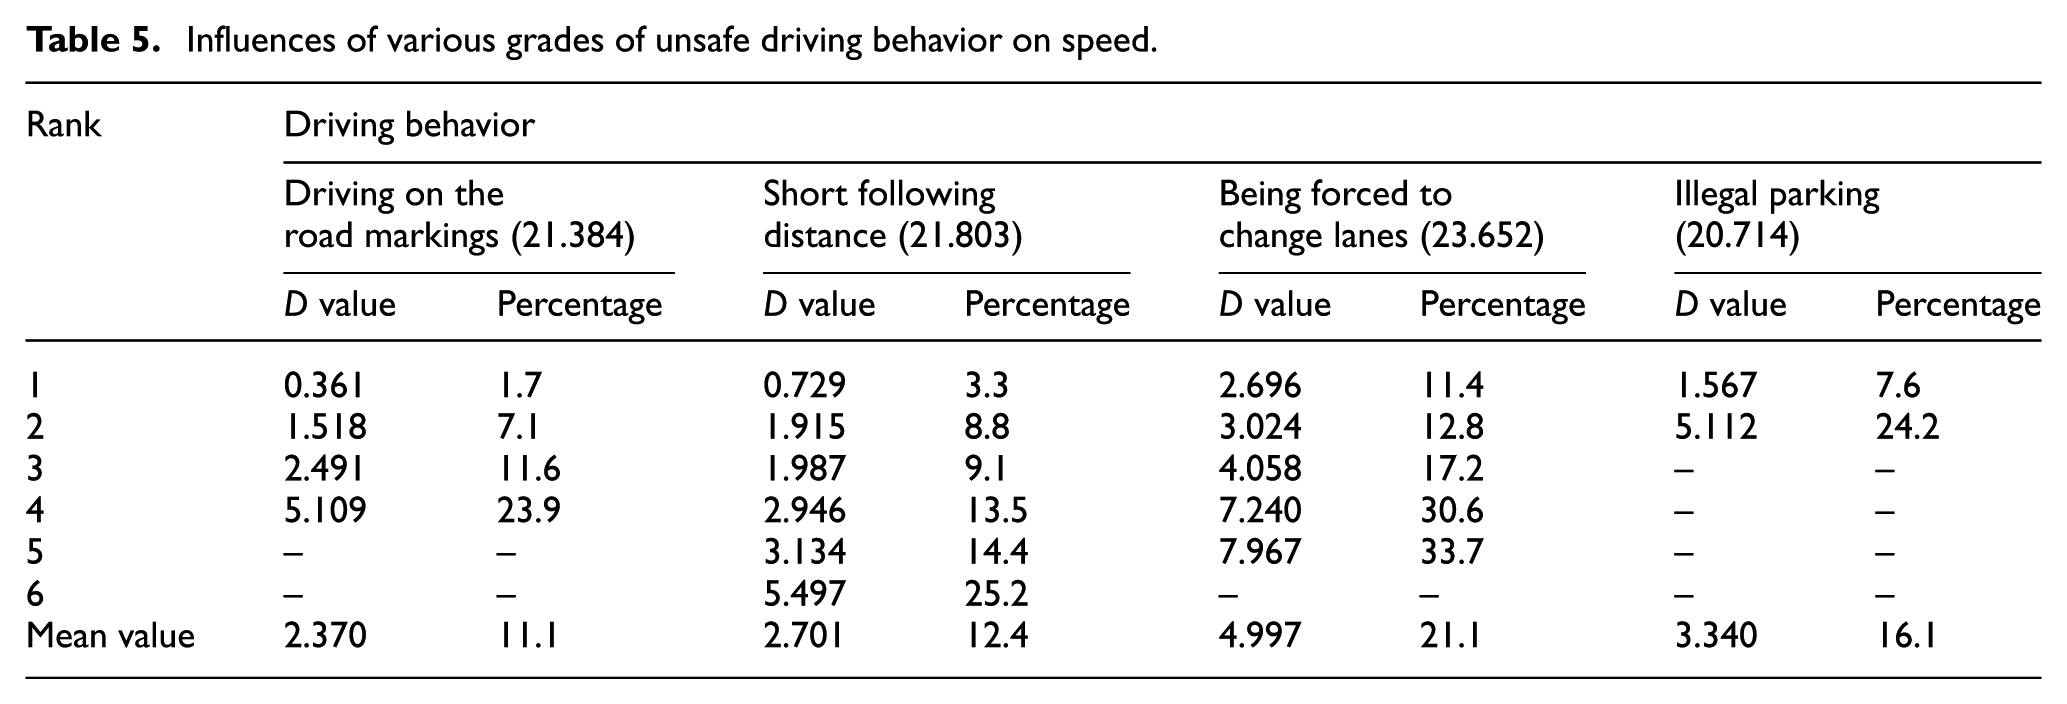
Percentage of unsafe driving behaviors in traffic volume and relative velocity difference basis relationship model is established according to the data in Table 5.
△vR = 4.88·PDriving on the road markings, R2 = 0.95
△vR = 3.58·PShort following distance, R2 = 0.96
△vR = 6.90·PBeing forced to change lanes, R2 = 0.97
△vR = 11.20·PIllegal parking, R2 = 0.99
From the above-mentioned model, unsafe driving behaviors according to the influence of degree of speed in the descending order are illegal parking, being forced to change lanes, driving on the road markings, and short following distance.
Influence of typical drivers’ unsafe driving behaviors on traffic flow density
The influence of unsafe driving behaviors on traffic flow density is shown in Table 6.
Covariance analysis of the sample data.
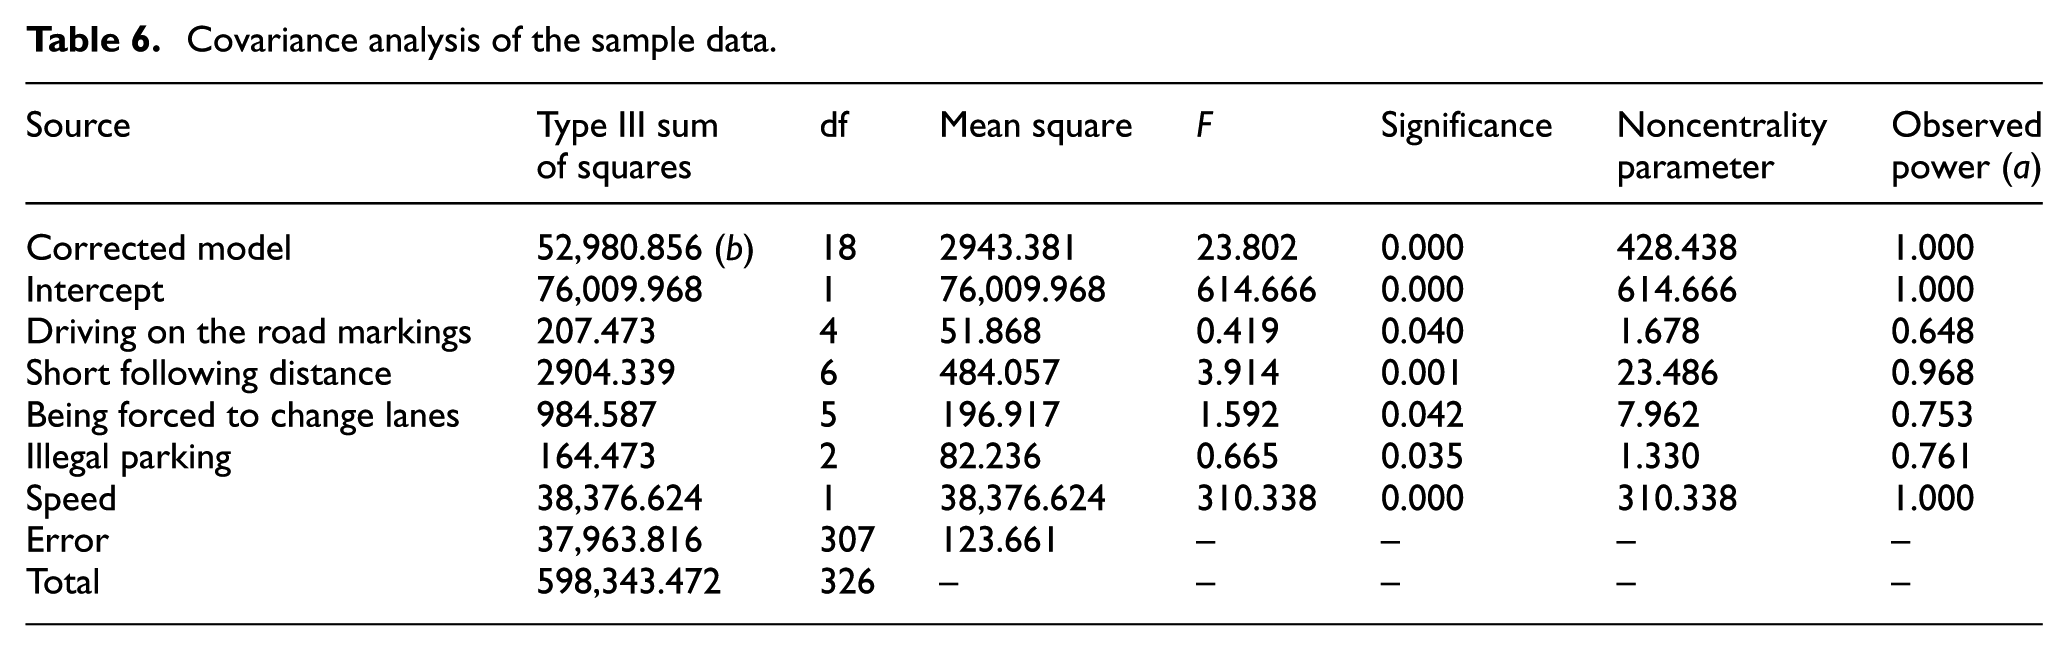
The level of the unsafe driving behaviors corresponding to mean density correction can be seen from Table 6. The selected four kinds of unsafe driving behaviors will lead to increase in the traffic density along with the increase in unsafe driving behaviors. The corresponding mean density correction of unsafe driving behaviors in each grade can be seen in Table 7.
Corresponding mean density correction of unsafe driving behaviors in each grade.

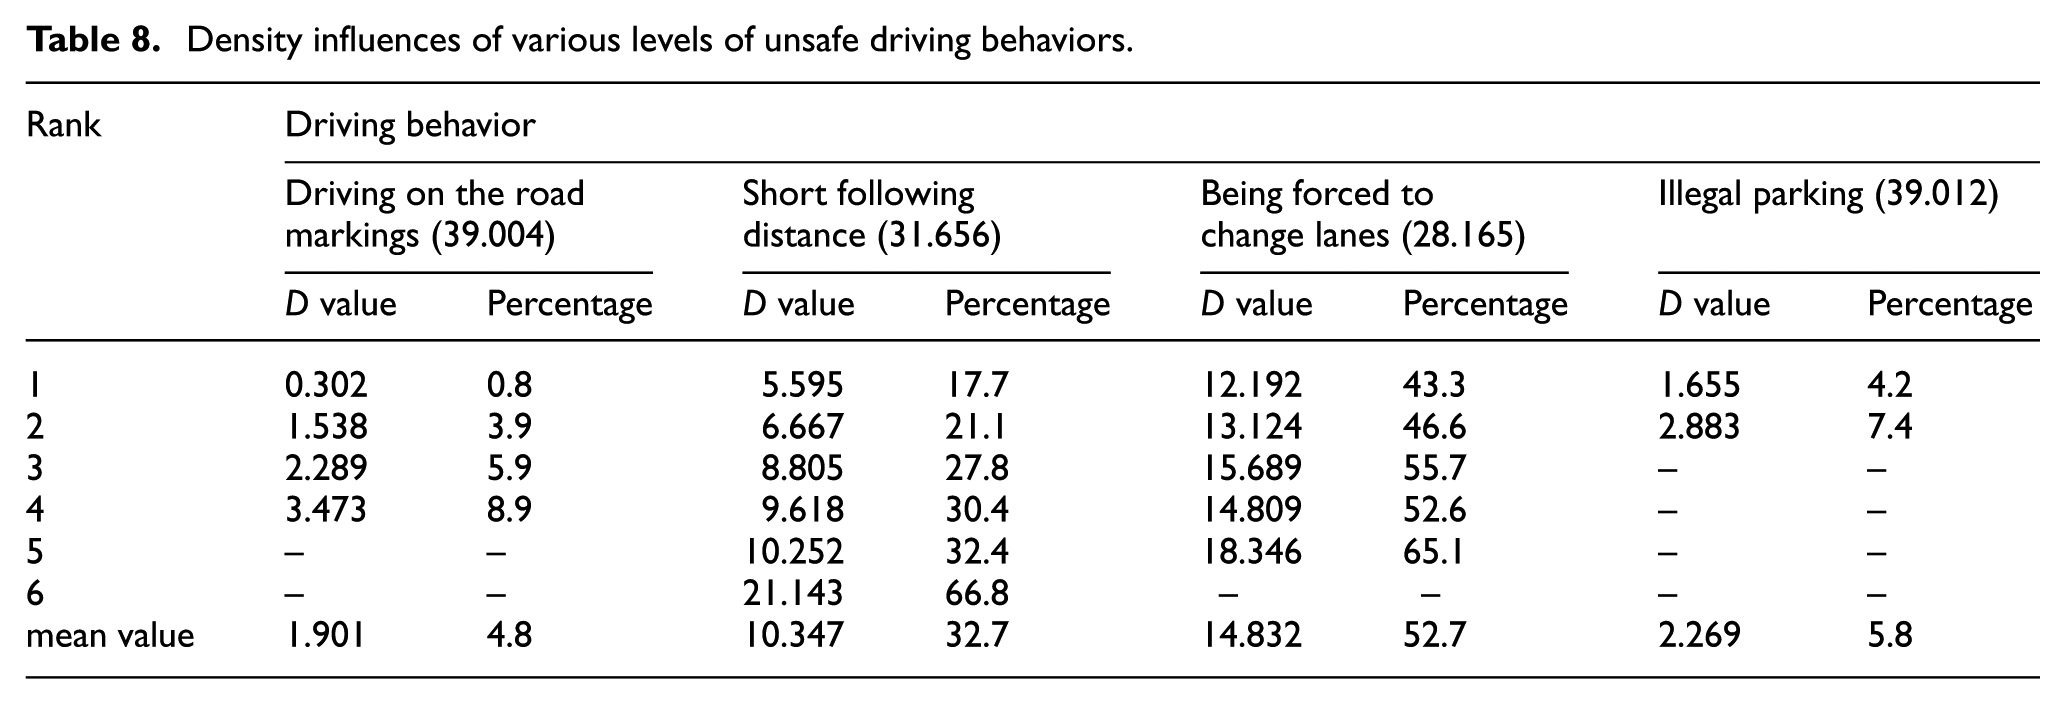
The relationship model of traffic volume percentage and relative density difference percentage is established according to the data in Table 8.
△KR = 0.81·PDriving on the road markings, R2 = 0.98
△KR = 9.10·PShort following distance, R2 = 0.97
△KR = 15.26·PBeing forced to change lanes, R2 = 0.95
△KR = 3.80·PIllegal parking, R2 = 0.99
Density influences of various levels of unsafe driving behaviors.
From the above-mentioned model, four kinds of unsafe driving behaviors according to the influence of degree of density in the descending order are being forced to change lanes, short following distance, illegal parking, and driving on the road markings.
Influence of typical drivers’ unsafe driving behaviors on road capacity
Through questionnaires about the 30 related drivers’ driving experience, results show that once the vehicles appear in the roadside parking, it will be in delay owing to slow down from the drive way into the inside lane and lead to subsequent vehicle deceleration or waiting in line.
It is described by Poisson distribution when free flow and the traffic density are small. The hypotheses are that the distribution is described accurately and strictly, and vehicle number intervals arrival is random. The probability of Poisson flow is described as follows.
On the road to a certain point, △t time probability reached k cars as

λ is the arrival rate (vehicle/s) and △t is the length of time interval.
If a car drive into the interrupt traffic flow in △t1 seconds, then a parking lane caused delays including traffic interruption time △t1 seconds and queue dissipation △t2 time, where in △t2 time to vehicle q0 release of saturation flow rate. As shown in Figure 14, the vehicle is with the Poisson distributing arrival, at the △t1 time the vehicle queue, after △t2 time to dissipate.

Vehicle arrival and delay time.
There is a certain randomness in reaching the free-flow state of the vehicle, and each time, the parking place is a probability event. To arrive at a probability event, rate of the vehicle changes slightly, so the vehicle arrival as equilibrium at t0 = △t1 + △t2 can be calculated; t0 will be divided into n time periods. As each time period of the mathematical expectation of vehicles is the same, the vehicle delay in time is the area of triangle OAB.
A car into the interrupt traffic flow △t1 time seconds is obtained through investigations. Because there are many parking places for an hour, for every team in which the vehicle parking berth is random, the number of the line should be an expected value. Reached by the assumption that in △t1 + △t2 time all the vehicles release the saturation flow rate in △t2 time, △t2 can be calculated by the formula E(q(△t1 + △t2)) = q0 × △t2.
Substituting


Once the stop delayed

The roadside parking lane generally has motor vehicles parked and non-motorized road parking. When the traffic flow follows a Poisson distribution and if one hour occurs within the time arrived for n1 parking, traffic flow in a non-free-flow state is larger. The vehicle will be influenced by other vehicles. Owing to the city road which is affected by the upstream intersection of road vehicles, the negative two models to describe the distribution and the delays are as follows.
Vehicle arrival with the two models to describe the distribution probability description is depicted as

p(x) probability reached the x cars in the t counting interval and negative two parameters can be obtained by actual observation data. 0 < p < 1 and β is a positive integer.
The derivation process is identical with the Poisson distribution, but the vehicle at an arrival time is not uniform and it has certain fluctuations. As a car probability event, it needs a mathematical expectation; therefore, it can obtain the same queue dissipation time △t2, and then, it can get a parking generation delay d = SOBD − S△ABD, as shown in Figure 15


Vehicle arrival and delay time with certain fluctuations.
Once the stop delayed

When the traffic flow is to negative binomial distribution and if the one hour occurs within the time arrived for n2 parking, a direction of one hour traffic flow in traffic has delayed D2 = n2d2.
The direction of traffic delay occurs in one hour D1 = n1d1. It will occupy a certain width of the road and the organization will be changed when a roadside parking occurs. The following are the four kinds of unsafe driving behaviors: (1) the lane width is reduced and the number of lanes is not changed, η; (2) the number of lanes is changed, α1; (3) reduction by the exit lane, α2; and (4) other conditions, α3. Affected by road environment changes due to the above unsafe driving behaviors, the actual capacity of the road is

C0 is the basic capacity of neighboring lanes.
Conclusion
The effect of unsafe driving behaviors on the vehicle speed and traffic flow density is analyzed:
The traffic speed will be reduced with the increase in the number of unsafe driving behaviors. The total traffic volume ratio of the selected four kinds of unsafe driving behaviors of which the average forced changing times for every increase in one grade, the speed will reduce by 21.1% (0 degree for reference). Four kinds of unsafe driving behaviors according to the influence of degree of speed in the descending order are illegal parking, being forced to change lanes, driving on the road markings, and short following distance. Four kinds of unsafe driving behaviors will lead to increase in the traffic density with the increase in the number of unsafe driving behaviors. Four kinds of unsafe driving behaviors according to the influence of degree of density in the descending order are being forced to change lanes, short following distance, illegal parking, and driving on the road markings.
The actual road capacity is obtained through basic capacity reduction correction analysis in condition of unsafe driving behaviors caused by the lane suddenly narrowing (lane number unchanged), reducing the number of lanes, or lane exit confusion.
Footnotes
Academic Editor: Hai Xiang Lin
Declaration of conflicting interests
The author(s) declared no potential conflicts of interest with respect to the research, authorship, and/or publication of this article.
Funding
The author(s) disclosed receipt of the following financial support for the research, authorship, and/or publication of this article: This work was financially supported by the Opening Research Fund of National Engineering Laboratory for Surface Transportation Weather Impacts Prevention (NELLJA201605), the Science Research Fund of Education Department of Yunnan (Grant No. 2015Y082), and the Science & Technology Plan Program of Yunnan Province, China (Grant No. 2013CA025).