
Abstract
Nowadays, the turbocharger has become one of the key components for automotive spark-ignition engine improvements (fed with both liquid and gaseous fuels), as a support for the boosting and downsizing concept to reduce fuel consumption and exhaust emission. In gasoline engines, the usage of the waste-gate valve typically regulates the maximum boost pressure in the turbocharger system, to protect the engine and the turbocharger at high engine speeds. To improve the transient response at low engine speeds, two-stage turbocharger is widely used. Two-stage systems are composed of several valves to regulate the flow to control the boosting of the system. Like a bypass valve between the turbines, a check valve is present between the compressor and a waste-gate valve for the low-pressure turbines. This article deals with a methodology for characterizing the discharge coefficient of an electronic waste-gate valve in the turbocharger. To estimate the gas flow over the same in one-dimensional models, an empirical model is correlated and validated. For this, a constant-stream experimental work has been carried out on a test rig at different valve position openings, with high turbine inlet temperatures. Finally, an optimal map of discharge coefficient has been drawn out through interpolation method, which can integrate into the full one-dimensional turbocharged engine model system, to calculate the actual mass flow through the waste-gate valve.
Introduction
Improving the performance of vehicle engines, like noise, 1 gaseous emissions control2,3 as well as meeting future real driving emissions regulation 4 and reducing the fuel consumption 5 has become a key target for the automotive propulsion system. In the meanwhile, there is a continuous increment in vehicle performance and drive-ability, 6 and both needed to satisfy customer requirements. Nowadays, the usage of turbocharger became necessary, and its popularization on a gasoline engine is more recent than that on a diesel engine. For a gasoline engine, the working range requirements of the turbocharger should be much broader, because the operating speed range is mostly 1000–6000 r/min and even some higher than 8000 r/min, which is relatively greater than that of a diesel engine. The exhaust energy is limited for low engine speeds. Thus, only a small-size turbine can be driven to enough speed so that the compressor can supply the appropriate boost pressure to the engine. However, at high engine speeds with high exhaust gas temperature and pressure, a bigger-size turbine can be prevented from overspeed beyond its limit. Therefore, for certain speeds like low, medium, or high, a conventional non-adjustable turbine can only be matched. Nowadays, achieving full engine speed with an adjustable turbine is a process under consistent development. 7 There are two types of adjustable turbines, one is the fixed-geometry turbine equipped with a waste-gate and the other is variable-geometry turbine (VGT). By controlling the waste-gate or the vane position, the turbine can keep its speeds unchanged above a certain engine speed or adjust them in stages, to set the boost pressure. However, most current gasoline engines use turbocharger turbines fitted with a waste-gate valve as a mass flow regulating device due to the low reliability of VGT at the extremely high temperatures of the exhaust gases in the petrol engines. In current automotive engines, during the harsh thermal environment of the exhaust manifold, the turbocharger controlled by the waste-gate benefits from high durability and low cost. 8 The waste-gate is divided into two types according to the actuation method, one is pneumatic and other is electric. The electric actuation can provide more precise control and faster response for the waste-gate. Although the cost is much higher and its complex structure, due to the increasingly strict emission regulations nowadays, all the automotive companies are driving the application of electric actuator. Different strategies are included in the engine control unit (ECU) when the turbocharger is attached to a naturally aspirated engine. These strategies are to monitor the performance of the turbocharger for its safe and proper operation, thereby optimizing the performance of the engine. 9
Turbocharger manufacturers 10 and one-dimensional (1D) engine simulation software2,11 treat the rotor and internal waste-gate as two nozzles operating side by side and having the same temperatures and pressures in both the upstream and downstream of the turbine. Altogether, for both the rotor and waste-gate, the control volume has been obtained throughout the boundaries of the physical turbine, and no addition has been made for losses due to the flow dividing or combining at the inlet and outlet, respectively, within the turbine housing. 8 The mass flow rate across the turbine upon the opening of the waste-gate is taken as the sum of waste-gate mass flow rate, estimated by the discharge coefficient (obtained with no flow through rotor) and rotor mass flow rate (measured with waste-gate closed) along with expansion ratio throughout the turbine. This act will be an exact representation of the claimed real stream-rated flow with an open waste-gate. This legitimacy is imperative for two fundamental motivations. First, the turbocharger manufacturer determines the size of the waste-gate throat and also chooses the actuator canister under the premises which quantify accurately the bypass flow during full and partial valve head opening without any flaws. The waste-gate throat prematurely chokes, and resolution of boost control is modest, thus the fuel economy and engine performance will suffer. Second, a turbine map with a closed waste-gate is supplied to automobile manufacturers, unlike variable-geometry turbocharger maps which provide mass flow parameters and efficiency characteristics at different nozzle positions. To anticipate the engine operations with waste-gate open, the automobile manufacturers must depend upon discharge coefficients measured experimentally and applied within engine simulation software,2,11 which estimates total turbine mass rate in a way that is similar to turbocharger makers.
Several proposals have been made in the literature to characterize the behavior of nozzles. A numerical computational fluid dynamics (CFD) and experimental approaches have been used by M Halder et al. 12 to calculate a discharge coefficient of a spray solid cone pressure nozzle with an incompressible flow. The author tested the nozzle at different operating conditions to observe the effects on the discharge coefficient. The influence of various flow conditions through nozzle have a significant impact on the discharge coefficient values. A methodology to calculate the discharge coefficient of a compressor bypass valve integrated with a compressor housing was developed by JM Luján et al., 13 and to understand the possible difference between the turbocharger test bench and steady flow test bench measurements. It observed that measurements performed with the implemented methodology on turbocharger test bench lead to a good agreement with results obtained on the steady flow test bench. S Huang et al. 14 showed experimentally that upstream flow disturbances and pressure drops have a substantial impact on discharge coefficient values of a standard orifice in the incompressible flow. The same effects can appear in a compressible flow case too. For that reason, it is necessary to have a proper estimation of the discharge coefficient of turbocharger valves to consider the effects in real operation. This article presents an experimental method to characterize the discharge coefficient of the waste-gate valve because the mass flows through this valve is impossible to measure with sensors. Later, an empirical model is fitted as a part of the procedure for being able to predict the discharge coefficient of waste-gate. This can be used in 1D models2,11 of the whole turbocharged engine as actual mass flow through the valve can be calculated with accuracy. Therefore, the turbocharger is tested in a test rig in steady flow conditions at several opening and closing positions of the valve with high turbine inlet temperature.
Methodology
Turbocharger gas stand
The tests to characterize turbocharger waste-gate valve were performed in a gas stand. Several configurations for a gas stand can be used.15,16 The main features are the possibility of generating hot or cold flow in the turbine, an independent lubrication system (ILS) and sensors to measure turbocharger speed, pressure, temperature, and mass flow at the important sections of the different fluids. It is also crucial to have the possibility of changing the outlet conditions of the compressor using a back-pressure valve. The main characteristics of the turbocharger testing facility are listed below. Figure 1 shows the schematic of the turbocharger gas stand used for this work.
A two-stage centrifugal compressor is used as a gas supplier. This compressor is of the oil-free type and has air cooler at each downstream (inter and after-cooler) and powered by a 450-kW electric motor. The maximum relative pressure of 5.30 bar is reached and disposing capacities range between 4400 and 7200 m 3 /h. On the line between the compressor and the combustion chamber, there are two settling tanks for the storage of compressed air and three-way bleeding valves for evacuation of any excess air to ambient.
The mass flow is heated by a combustion chamber that is fueled by diesel. This system can increase the mass flow temperature to a maximum of 1200.
The amount of energy available at the turbine is controlled by a two-stage centrifugal compressor and the combustion chamber, both being key components of the gas stand.
The compressor from the turbocharger to be tested takes air from the ambience. First, the air passes through a filter and then the flow rate is measured by a hot-plate flow meter. At the downstream side of the compressor, there is mass flow meter of vortex type and also an electronically controlled back-pressure valve which modifies the pressure ratio.
At the downstream of the turbine, V-cone sensor 17 is placed for measuring the total mass flow exiting from the turbine.
An ILS and independent cooling system (ICS) deliver oil and coolant at an adjustable flow rate and pressure, to allow the testing of different sizes of turbochargers. These systems include a heater and a cooler that give the option to adjust the temperature at the turbocharger inlet lube and cooling ports.
Temperature and pressure sensors are installed on the inlet and the outlet pipes of the compressor and turbine; the installation of these sensors were made according to SAE paper J1723_199508 18 and SAE paper J1826_199503 19 standards, and their precision is shown in Table 1.
Turbine and compressor inlet and outlet pipes have been insulated using fiberglass in order to make the heat losses to the ambience negligible and ensure more precise measurements of the temperature at each stage.
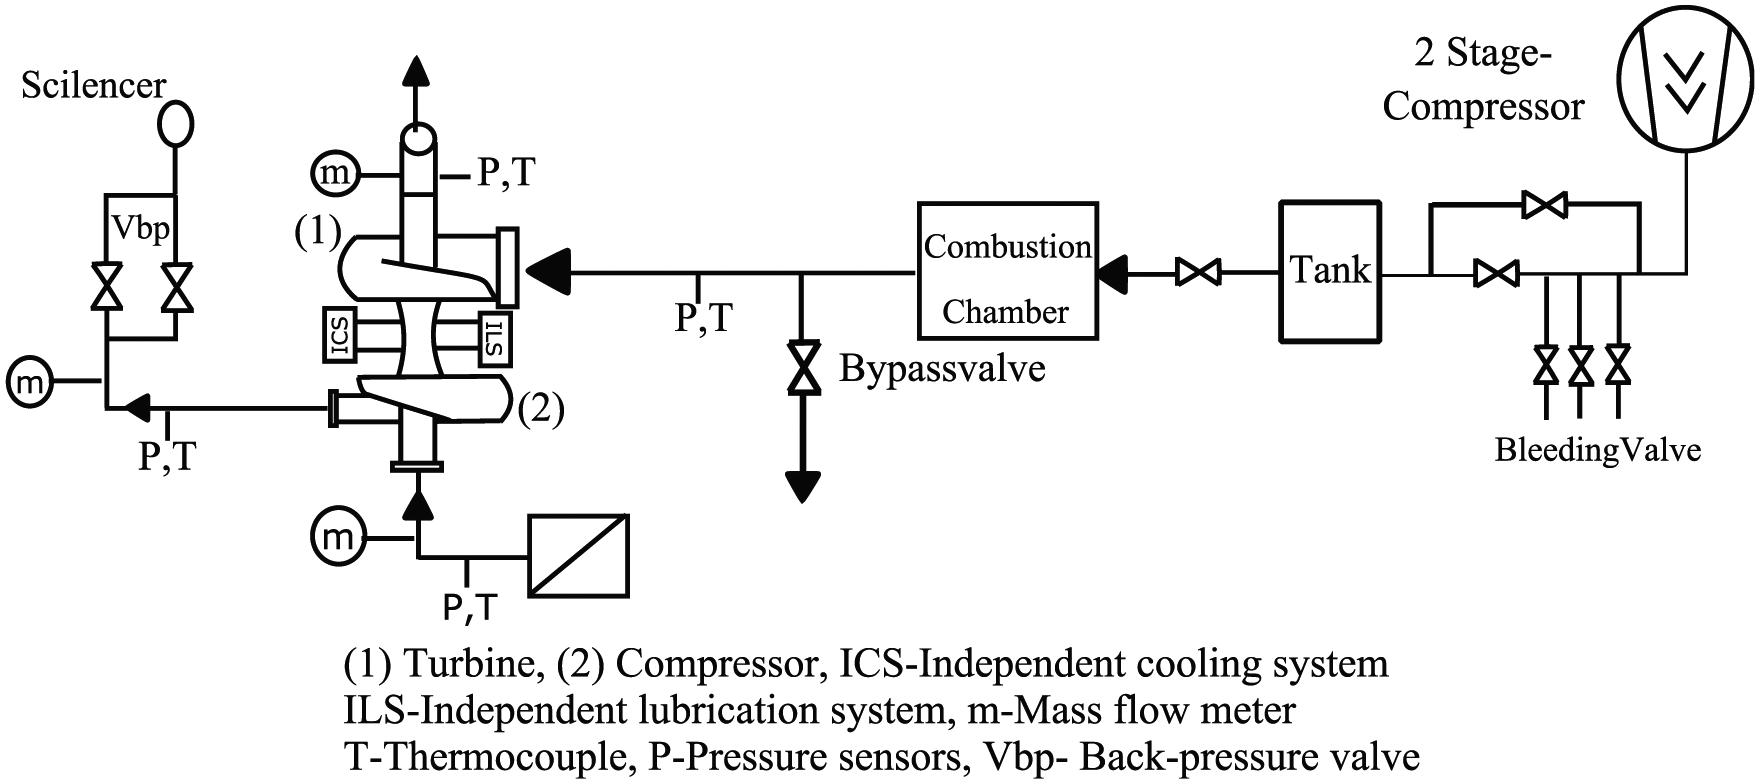
Schematic layout of turbocharger gas stand.
Sensor precision.
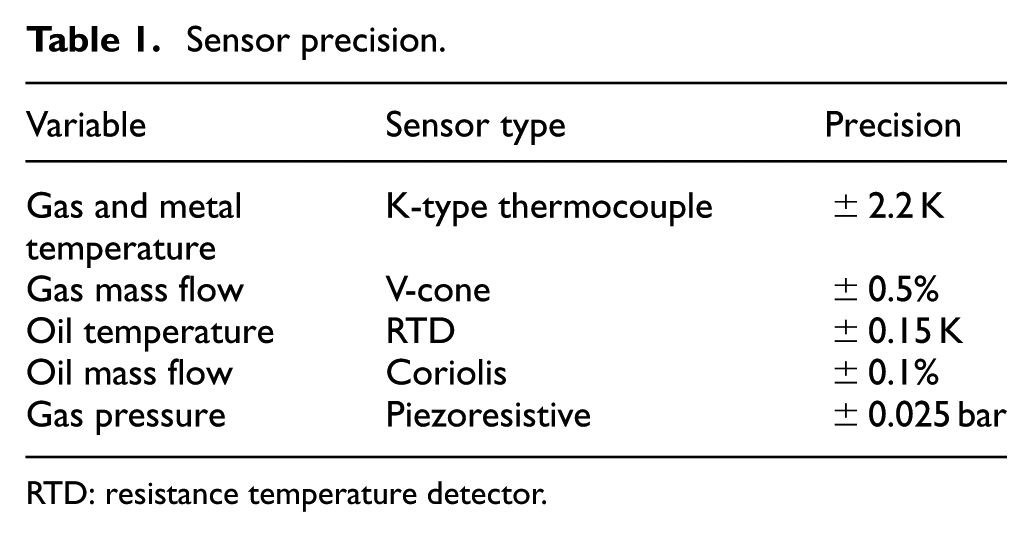
RTD: resistance temperature detector.
Stepper motor calibration
The turbocharger is equipped with an electro-mechanical device, which is mounted on the compressor housing and connected to the waste-gate valve by a crankshaft. This device consists of a stepper motor with multistage spur gears and a rotary shaft. Normally, in engines, it directly communicates with the electronic control unit (ECU) and controls the position of the waste-gate valve according to the speed, throttle position, and other sensor detection signals. In our experiments, the position of the waste-gate valve is measured by sending a signal from the computer. During the test, it was observed that the stepper motor did not follow the same trend every time. When a signal was sent by the computer to close the waste-gate valve, the position of the valve is different from 0%. Furthermore, the value was changed on each different day. The variation of the signal at 0% opening brings about variations in subsequent opening degrees for the whole scale, that is, comparing different tests, the same signal (by the computer) corresponded to different waste-gate valve openings. To compare the different test results, it was required to build a stepper motor calibration curve. The curve gives the correlation between the voltage supplied to the motor and the waste-gate valve opening percentage. The main hypothesis followed to build the calibration curve was that the correlation should be linear, thus requiring only a couple of values to calculate the correlation. One is the value corresponding to the maximum waste-gate valve opening which is already known (0.25 V for 100%) and the other is the value corresponding to the zero waste-gate valve closing. It was found by replicating one of the measured points, when the waste-gate valve is mechanically closed, that is, the latter were taken as reference conditions. As the points corresponding to the maximum opening and the closing known for each day, the calibration curve can be calculated as shown in Figure 2. It is a straight line because the hypothesis consists of a linear correlation. Several calibration lines were obtained due to the inconsistency in calibration every day. The main difference takes place when cold turbo conditions are compared to hot turbo conditions.
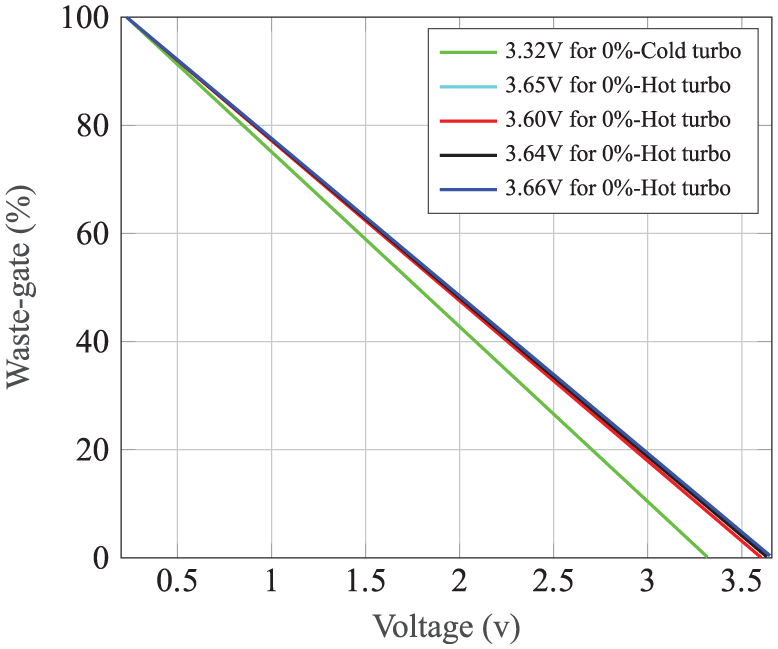
Stepper motor calibration.
Figure 3 shows the current intensity for each expansion ratio, corresponding to the points close to those of real waste-gate closing. The closing electrical signal grows with the reduced speed (as mentioned in the legends) and with the expansion ratio. Its maximum value has been measured for the maximum shaft speed and maximum pressure ratio. Higher current values are not attempted as it could damage the stepper motor. That is one of the reason why it is not possible to completely close the waste-gate valve with the stepper engine at higher pressure ratios and will be shown further in Figure 6.

Stepper motor current intensity for the points near the closing of the waste-gate.
Experiment and results
A fully instrumented waste-gate turbocharger was placed in the gas stand as shown in Figure 1 to trace the performance maps of the turbocharger and to calculate the discharge coefficient of the waste-gate valve for several operating conditions. For characterizing the discharge coefficient of waste-gate experimentally, two tests were performed, test A and test B as outlined in Figure 4 where temperature, pressure, and mass flow measurements points are represented. Both tests are based on the conditions of full load engine points. Test A was carried out first, and the waste-gate valve was entirely closed mechanically by a stopper to ensure that there is no leakage of mass flow through the waste-gate valve. Measurements of the inlet and outlet turbine air mass flow, pressure, temperature, and turbocharger speed were registered.
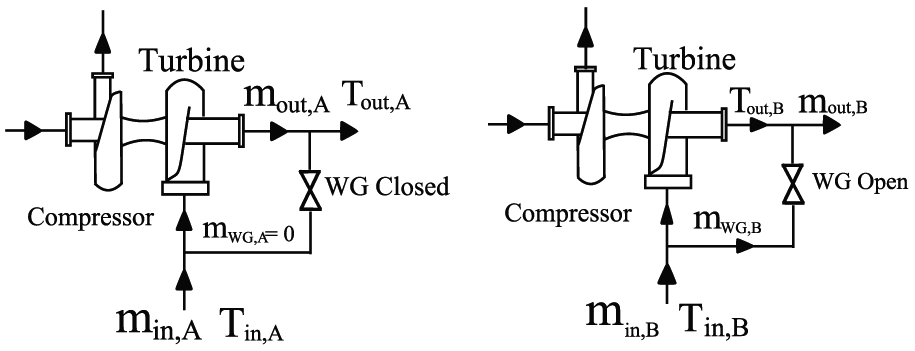
Methodology for turbocharger gas stand tests (A, left) and (B, right).
Test B was performed with the waste-gate valve opening at different positions. The valve was unlocked by the stopper that kept closed and was connected to the stepper motor that came with the turbocharger. The test was carried out adjusting same turbocharger speed, expansion ratio, and inlet temperature of the turbine as in test A for each opening of the waste-gate. In this way, when turbine operating point conditions are identical for both tests A and B, the actual mass flow through waste-gate in test B is calculated as the difference between the measured turbine mass flow from test B and test A

where
Figure 5 shows the turbine map measured in the turbocharger gas stand. The turbine reduced mass flow rate

where

Measured turbine map.
The difference between the gray diamonds and circles is the mass flow through the waste-gate as shown in Figure 6. In this way, we could measure the waste-gate flow for a series of expansion ratios that correspond to each engine load point. The first point of each series expresses the difference between the flow outgoing from the turbine to the waste-gate closed with the two methods. It is expected to be zero. We note in Figure 6 that the series having a higher expansion ratio of 2.4 and greater will not be able to achieve the zero waste-gate mass flow, but only a value greater than zero. It means that, by sending the close signal to the motor, the total flow rate of gas that is measured is greater than the one acquired with waste-gate locked with the mechanical stop. Evidently, the stepper motor, despite the sent signal, does not close the valve perfectly. The cause of this phenomenon lies in the fact that, for these points, the pressure values of gases were relatively high and exerted an action that is opposed to closing of the valve. For avoiding these, a very high density of current should be sent to the motor, with the risk of burning the system (see Figure 3). This is not likely to happen in real engine operation. Therefore, it is expected that at high pressure ratios (typically of a full load operation or rated power), the waste-gate will show always a leakage that should be considered when engine control is designed.
Mass flow in the waste-gate with expansion ratio (legends refer to closed WG expansion ratio).
Figure 7 shows the mass flow through the waste-gate as a function of the commanded waste-gate opening percentage. It is already found that for higher expansion ratios, although the waste-gate corresponds to the closing (WG = 0%), but virtually the valve is still open, there is a leak of mass flow through the waste-gate. It can also be observed that there are also points at the lowest expansion ratio, for which, despite the opening of the waste-gate (WG > 0%), the mass flow does not flow through it. This is because the pressure difference is too small to keep the mass flow in motion when the waste-gate is opened. So, the flow through the waste-gate is dependent not only on the waste-gate opening but also on the pressure ratio.

Mass flow in the waste-gate with WG opening (legends refer to closed WG expansion ratio).
Waste-gate discharge coefficient modeling and results
The objective of this article is to characterize the discharge coefficient of the waste-gate valve. The discharge coefficient,

The reference area, Aref, has been chosen to be the waste-gate throat cross-sectional area that is

The geometrical area of the waste-gate valve was directly measured from the turbocharger unit for a maximum opening of the valve. To compute the discharge coefficient, the ideal mass flow rate through the waste-gate reference area must be determined, which assumes a perfect gas undergoing a steady isentropic compressible flow in one dimension

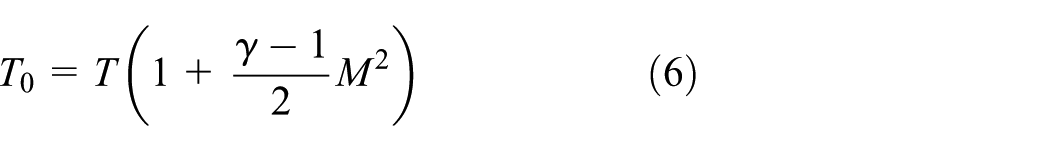
Using the isentropic relation equations (5) and (6), the ratio of total and static pressure as a function of Mach number, M, may be expressed as

where Mach number is calculated by below equation

Next, the continuity equation is entreated along with the perfect gas equation of state to solve for mass flow rate according to
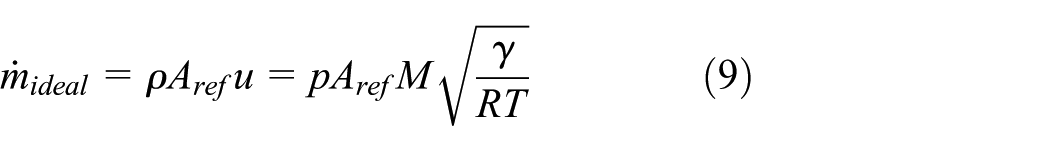
Combining equations (5)–(9) gives the unchoked ideal mass flow rate through the waste-gate

where

Since the turbine upstream temperature and pressure, downstream pressure and air mass flow were measured, discharge coefficient was calculated as the ratio between the experimental and the theoretical flow rate as explained above. Its performance is qualitatively quite as expected: increasing with the percentage of opening of the valve, and at the same, it is increasing with the expansion ratio. Figure 8 shows the result of waste-gate discharge coefficient for measured points. It is important to remark that discharge coefficient is not so totally linear with the waste-gate opening from 0% to 15%. Figure 7 shows that there is more dispersion in mass flow at this low waste-gate opening. Due to higher expansion ratio in the turbine, the waste-gate was left open. But the discharge coefficient has a linear relation at higher waste-gate openings, that is, from 15% to 40% and more dispersion at lower openings and there is also some dependence on pressure ratio. So, the waste-gate is also related to the width of the turbulent boundary layer. 20

Waste-gate discharge coefficient for measured points (legends refer to closed WG expansion ratio).
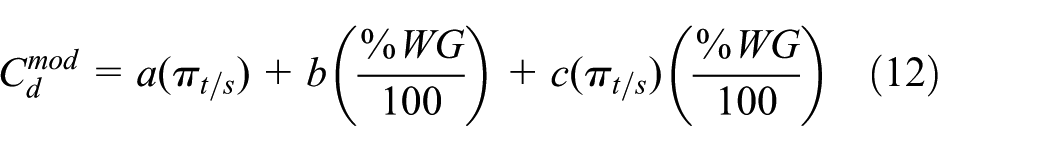
In order to obtain an expression that can be used for predicting a variety of operating conditions at which an engine works, a polynomial equation form is provided as a function of expansion ratio and waste-gate valve opening as shown in equation (12) (Table 2). Using the experimental data, the empirical model is fitted in order to predict the discharge coefficient of a waste-gate valve as shown in Figure 9. By this empirical model, it is easy to estimate the mass flow through waste-gate using the predicted discharge coefficient in equation (13). This model can be used in 1D simulations in order to improve the predictions of overall engine performance. It can be observed that the waste-gate valve position has been divided by 100 in order to obtain fitting coefficients with orders of magnitude around unity

Model goodness of fit.

SSE: sum of the square due to error; RMSE: root mean square error.

Modeled discharge coefficient of the waste-gate valve.
In Figure 10, the modeled waste-gate discharge coefficient was compared with the discharge coefficient calculated from the measured points. As shown, predicted waste-gate discharge coefficient well agreed with the measured one. A root means square error of 0.0253 was observed. This is about 3.6% of the maximum measured

Modeled discharge coefficient against measured discharge coefficient.
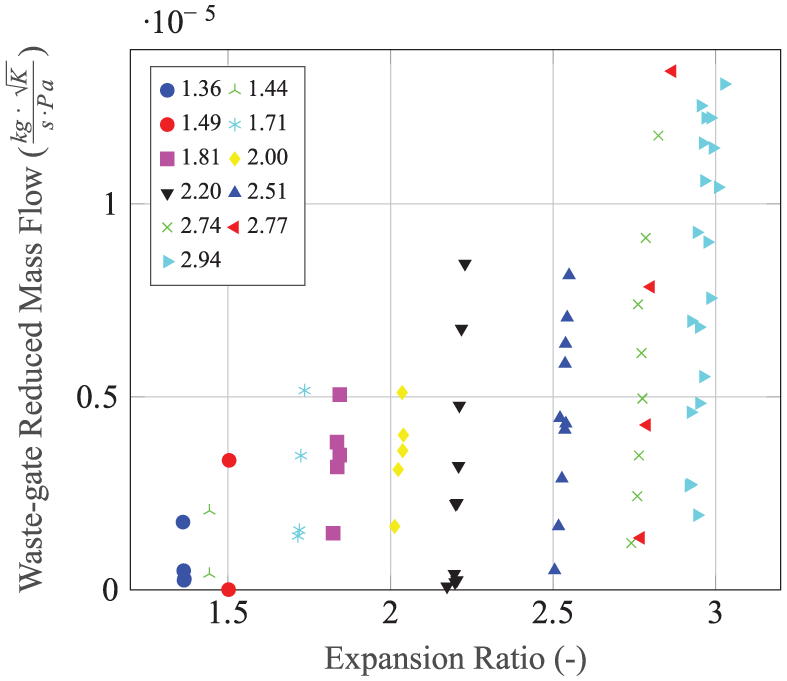
Figure 11 shows the modeled reduced mass flow through the waste-gate valve, which is calculated from equation (13) and is compared to the experimental waste-gate reduced mass flow. A root means square of 5.0176e−07

Modeled WG reduced mass flow against measured WG reduced mass flow.
Conclusion
An experimental methodology has been developed to make possible a proper characterization of discharge coefficient of a waste-gate valve integrated with a turbocharger. The turbocharger was tested in a turbocharger gas stand with two different turbine inlet temperatures. In order to estimate the mass flow through the waste-gate for full engine load points, two test campaigns were done. At first, the points were measured by blocking the waste-gate valve mechanically. After that, the stepper motor was mounted on the turbocharger. With this system, it was possible to study the behavior of the turbocharger with the waste-gate valve partially opened. For each of those points, waste-gate mass flow was calculated. Subsequently, even the corresponding discharge coefficient was evaluated. On the turbocharger gas stand, it is important to ensure that turbine inlet temperature, turbocharger speed, and turbine expansion ratio are same between tests A and B. In the end, a procedure is used to fit the discharge coefficient of the waste-gate valve to mathematical expression in order to be used in 1D gas dynamic codes. The error in mass flow prediction using this procedure is small when compared with the relevant magnitude of turbine power.
It was possible to discover that stepper motors do not totally close the waste-gate valve at high turbine pressure ratios. Proposed empirical model of
Footnotes
Appendix 1
Academic Editor: Filippo Berto
Declaration of conflicting interests
The author(s) declared no potential conflicts of interest with respect to the research, authorship, and/or publication of this article.
Funding
The author(s) disclosed receipt of the following financial support for the research, authorship, and/or publication of this article: This work was partially funded by FEDER and Government of Spain through Project TRA2016-79185-R.