
Abstract
During the offshore installation process, any disturbance such as heave motion may lead to a significant impact on the equipment, which may damage the equipment permanently. The shock isolator for the installation can provide good performance for the equipment and has the ability to adapt to various ocean conditions. Therefore, an experimental facility of offshore installation is set up, and the dynamic model is presented. The model includes the effect of the tensioning and relaxing of rope and the displacement constraint of shock isolator. Considering the maximal travel range of the isolator finalized as a constant force isolator, the optimum control strategy is conducted to mitigate the peak force transferred to the equipment during the landing process. Finally, the experimental results are compared to the simulation results under typical operating conditions. Then, the effective of this optimum strategy can be verified by comparing the passive control strategy. It can be found that when the optimal control strategy can reduce the peak acceleration of equipment under the harsh sea condition.
Introduction
The offshore installation is a complex project and will face many difficulties such as the complex ocean condition. Some works on the offshore hoisting process are reported in the literatures. Idres et al. 1 and Ellermann et al. 2 developed a nonlinear coupled model of crane and cargo based on the assumption that the cargo was a point mass. Cha et al. 3 established the coupled model between the floating crane and the cargo considering the geometries of cargo. 4 Zhang et al. 5 built the nonlinear dynamic model–incorporated ship motions coupled with linear large load swings which were set up in the background of offshore turbine. From these dynamic models, the heave motion of the floating crane can be obtained during the hoisting process.
A number of control techniques for offshore hoisting process have been proposed in the literatures. Zhang 6 designed a passive shock isolator with an optimized throttling orifice for heavy structure installation. The passive heave compensation system for the offshore hoisting process is studied by the Huster et al. 7 and Ni et al. 8 With the development of the equipment, such as offshore wind turbine, the mass and the volume of equipment increase continuously. The passive shock isolator has some limitations due to the lack of feedback and regulation mechanism. In order to reduce the effect of the heave motion and increase installation capacity in the harsh condition, the feedback control strategy should be introduced into the system.
The past method for the offshore lifting operation uses either winches or hydraulic pistons to control the payout of the winch line. BW Nam et al.9,10 used displacement, velocity of equipment for as the feedback signal to compensate the lifting rope force during the deep-water lifting process. M Kjell and M Hansen 11 present a dynamic model loading and unloading of a payload from a floating platform to a fixed platform. The displacement, velocity, and acceleration of payload are used as the feedback signal for a proportional–integral–derivative (PID) controller. But, the above method focused on the hoisting process. For the landing process, the equipment motion is restricted by the installation platform. What is more, any external disturbance may result in impact on the equipment, which may damage the whole structure permanently. Therefore, this impact energy should be absorbed to prevent the equipment being damaged.
Mikułowski and Jankowski 12 investigated the ultimate limits for improvement due to the various strategies of active control to mitigate the peak force transferred to the aircraft. Wu et al. 13 used the genetic algorithm (GA) as the optimization technique and chose damping performance to be the optimization object. Shi et al. 14 proposed the multi-objective optimization problem considering mass variation and generated optimum trade-off charts for the design of a semi-active shock absorber for landing gear.
Due to the heave motion and the displacement constraint of installation platform, the hoisting rope can be relaxed and tensioned alternately, and the multiple impacts may occur between the equipment and the installation platform during the landing process. Therefore, the previous dynamic model and control strategies have some limitations when they are used in the offshore installation process.
In this article, an experimental facility of offshore installation is constructed, and the dynamic model of offshore installation is proposed. A shock isolator is presented to absorb the impact energy and attenuate the dynamic response of the equipment during the landing process. The dynamic model includes the tensioning and relaxing of hoisting rope and the stroke of constraint of shock isolator. Aimed to obtain the constant force isolator with a given stroke, the optimum control strategy is used to minimize the peak force transferred to the equipment. Then, the effectiveness of this optimum control strategy can be verified by comparing the passive control strategy.
Mathematical model of offshore installation
Here, the structure of installation device is shown as in Figure 1. During the offshore installation, the motion of equipment can be restricted in the z-direction by the positioning system. Therefore, the motion of equipment in the horizontal plane is not considered. In Figure 1, it includes the winch, equipment, cylinder, plunger, accumulator, one-way valve, and proportional valve. The shock isolator is set up to absorb the impact damage to prevent the equipment being damaged. A one-way valve is in parallel with the proportional valve so that the plunger can reset quickly when the equipment is lifted again. Therefore, the multiple impacts can be isolated due to the heave motion of equipment. Here, it is assumed that the equipment is located right above the installation platform and the release height is H. z1 represents the position of the equipment. S0 is the maximum stroke of the plunger.

Diagram of installation model system.
Winch’s motion
The winch is located at the tip of the floating crane. The motion of floating crane tip can be supposed to combine with a variety of sinusoidal waves. 15 These sinusoidal waves usually range the amplitude of few meters with the wave frequencies of 0.05–0.2 Hz. Therefore, some typical amplitudes and frequencies of waves can be chosen for the simulation given in equation (1) 16

where the positive constants
Therefore, the winch motion considering the release velocity can be expressed by

where v0 is the release velocity of equipment.
Dynamic motion of the equipment
The installation process mainly includes two processes: one is the hoisting process, and the other is the landing process as shown in Figure 2. During the hoisting process, the equipment is just released down by the winch, while the landing process is that the plunger lands on the installation platform, and the cylinder is started to be compressed.

Diagram of installation process.
Hoisting process
The model is represented by a 1 degree-of-freedom (DOF) system and modeled by the following equation

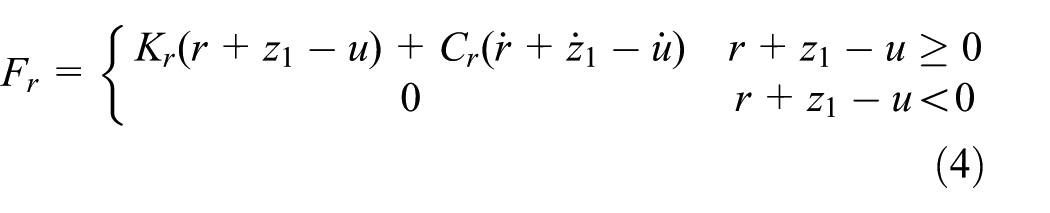
where m1 and m2 are mass of the equipment and plunger, respectively. Fr is the tensioning force of hoisting rope. Kr and Cr are the stiffness and damping of the hoisting rope.
Landing process
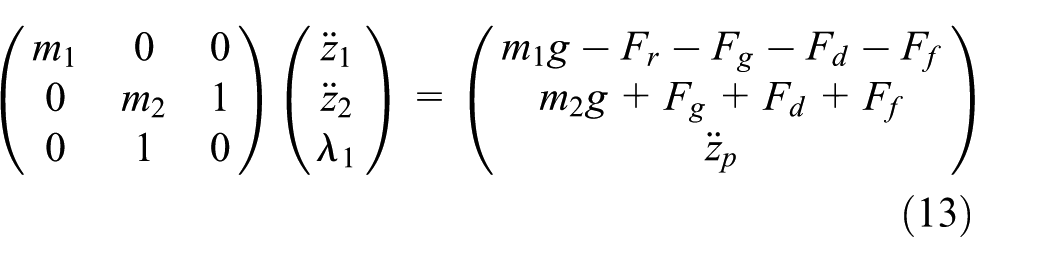
The landing process can be modeled as the following equation

The resultant force Ft can be modeled as a sum of four forces

where Fg, Fd, and Ff are pneumatic force produced by the accumulator, hydraulic damping force produced by the proportional valve and the friction force, respectively.
Assuming the compressing process of the air chamber in the accumulator is adiabatic, the pneumatic force Fg is modeled in accordance with the polytropic law for compression of gases

where
The hydraulic damping force Fd is produced mainly by the proportional valve which can be controlled by the voltage signal V. On the control region in the valve, there is a dead region that needs to be exited in order to let the oil through. Otherwise the valve flow rate has a linear relation with the control signal. The steady state flow equation for the valve is

where a, b, and n are the coefficients of the valve, which can be obtained by the product description. V is the control voltage of valve.
Figure 3 gives the relationship among the flow rate, differential pressure, and control voltage.

Relationship among the flow rate, differential pressure, and control voltage.
The hydraulic force Fd is modeled in the standard way as

where Cd is the orifice discharge coefficient, As is the cross-sectional area of the one-way valve, and
The friction between the plunger and the cylinder is assumed to be modeled by


where c1 is the friction coefficient and c2 is the dry friction coefficient.
When the plunger contacts with the installation platform, displacement constraint equations from the installation platform should be considered

where zp is the position of the installation platform. In the actual condition, the installation platform is fixed at the seafloor, and its displacement can be considered as a constant. Then, the Lagrange multiplier
When the plunger completes its stroke, the displacement constraint is applied at the equipment. Therefore, the following displacement constraints will be introduced into the dynamic motions

Then, the Lagrange multiplier

Control strategy
The offshore installation process is affected by the amplitude, frequency of heave motion. The common objective is to minimize the peak force, that is, peak acceleration occurring in the landing process. Different configurations of control voltage may have different displacement–force curves when absorbing the same shock energy during the landing process as shown in Figure 4. There are two performance indexes during the landing process given as follows


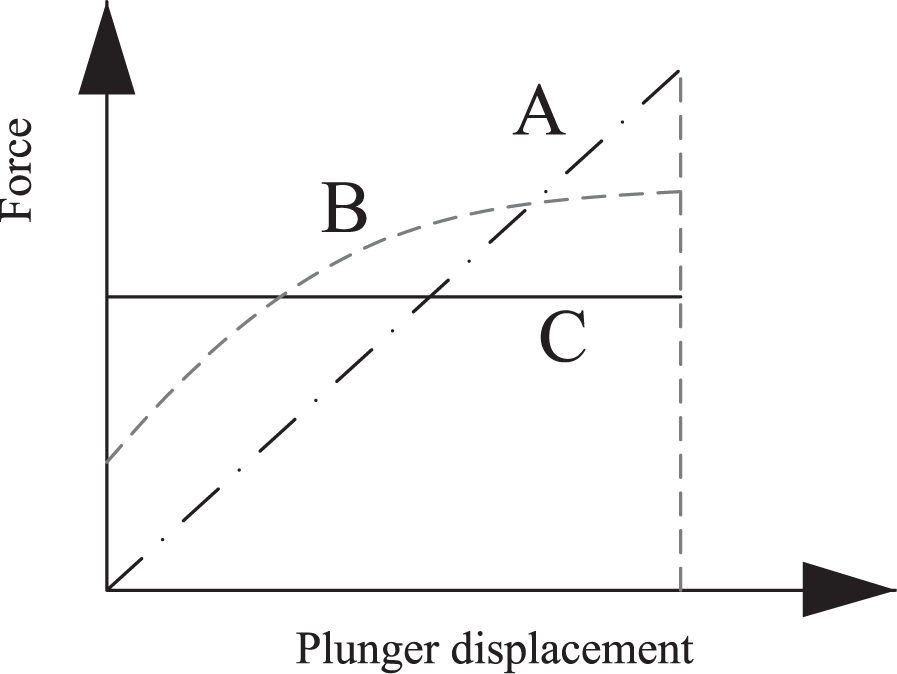
Relationship between the force and plunger displacement.
In Figure 4, the curves A, B, and C represent the displacement–force curve for linear isolator, nonlinear isolator, and constant force isolator, respectively. From Figure 4, it can be found that the constant force isolator has the lowest peak force when the three shock isolators dissipate the same amount of energy with the same displacement limit. For the same displacement and energy, the peak acceleration by a constant force isolator can be as low as 50% of that by a linear spring force. 19 Therefore, the optimization objective is that the external force of equipment with respect to the stroke is constant.
Passive control strategy
To obtain the desired displacement–force characteristic, the motion of equipment is supposed to have constant deceleration during the landing process. Therefore, the displacement of equipment can be expressed as

where u0 is the landing velocity of equipment.
The oil flow rate can be obtained as

From equations (8), (18), and (19), the optimal control voltage is calculated as

Owing to the larger mass of the equipment compared with the isolator, the mass of the isolator is neglected. From the kinetic equilibrium of the equipment, an equation can be obtained as
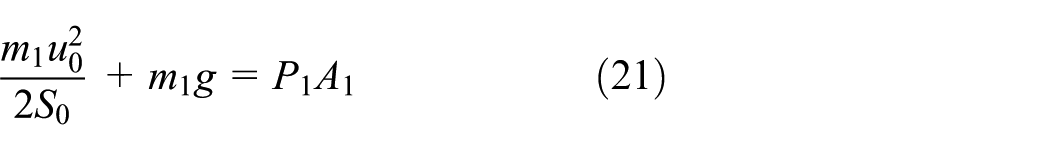
According to equations (20) and (21), the control voltage can be derived without considering the effect of the tensioning force

Considering the dead region of the valve, the above control voltage can be rewritten as
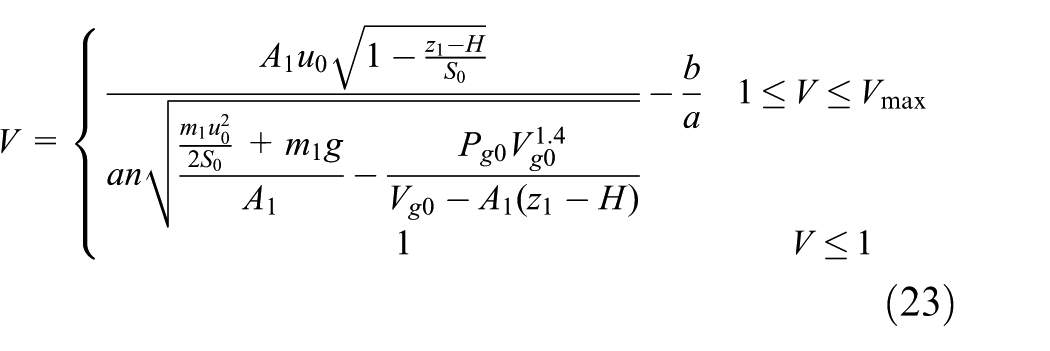
where Vmax is the maximum voltage which is restricted by the proportional valve.
Clearly, the control voltage depends on the landing velocity u0 and the displacement of equipment z1. The landing velocity u0 can be estimated according to the heave motion and the release velocity in advance. Thus, this control strategy uses only displacement of equipment as the feedback signal. This strategy can be realized by variable orifice structure shown as in the literature. 20
Optimal control strategy
According to the actual installation condition, the landing velocity is affected by the heave motion, the release height, and release velocity. Thus, it is an unknown variable which should be estimated by operation conditions. In the face of the complex wave condition, it is difficult to estimate the landing velocity accurately. Therefore, the control voltage of valve is actively modified during the landing process and the acceleration of equipment, displacement of equipment, pressure in the cylinder, and tensioning force of hoisting rope are introduced as the feedback signal. As shown in Figure 4, ideally, the impact energy can be equally distributed with respect to the shock isolator stroke like curve C. Therefore, the optimal resultant force Fto during the landing process is constant as follows

The acceleration of equipment should not exceed the limit acceleration alimit. Otherwise, the equipment may be damaged. Therefore, the limit force Flimit can be obtained as follows

The optimized result is to keep the optimal resultant force Fto at a desired limit force Flimit. Thus, the damping force produced by the proportional valve should satisfy the following condition

From equations (9) and (20), the optimal control voltage is calculated as
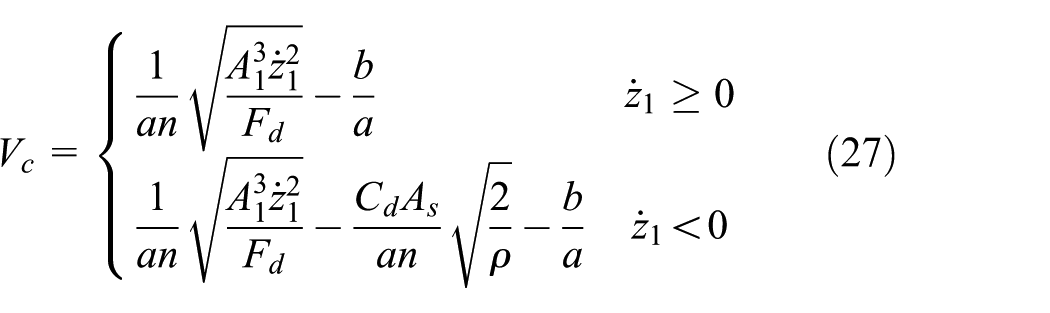
In case the resultant force Ft inevitably exceeds the Flimit, the control voltage is set to Vmax and stay until the resultant force Ft attains Flimit. Hence, the control voltage can be set actively according to the following equations
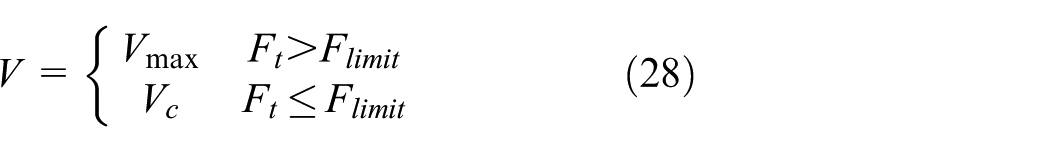
Considering the dead region of the valve, the optimal control voltage can be rewritten as

Therefore, the control voltage can be actively controlled according to the given limits.
Then, the control algorithm flow chart is given in Figure 5.
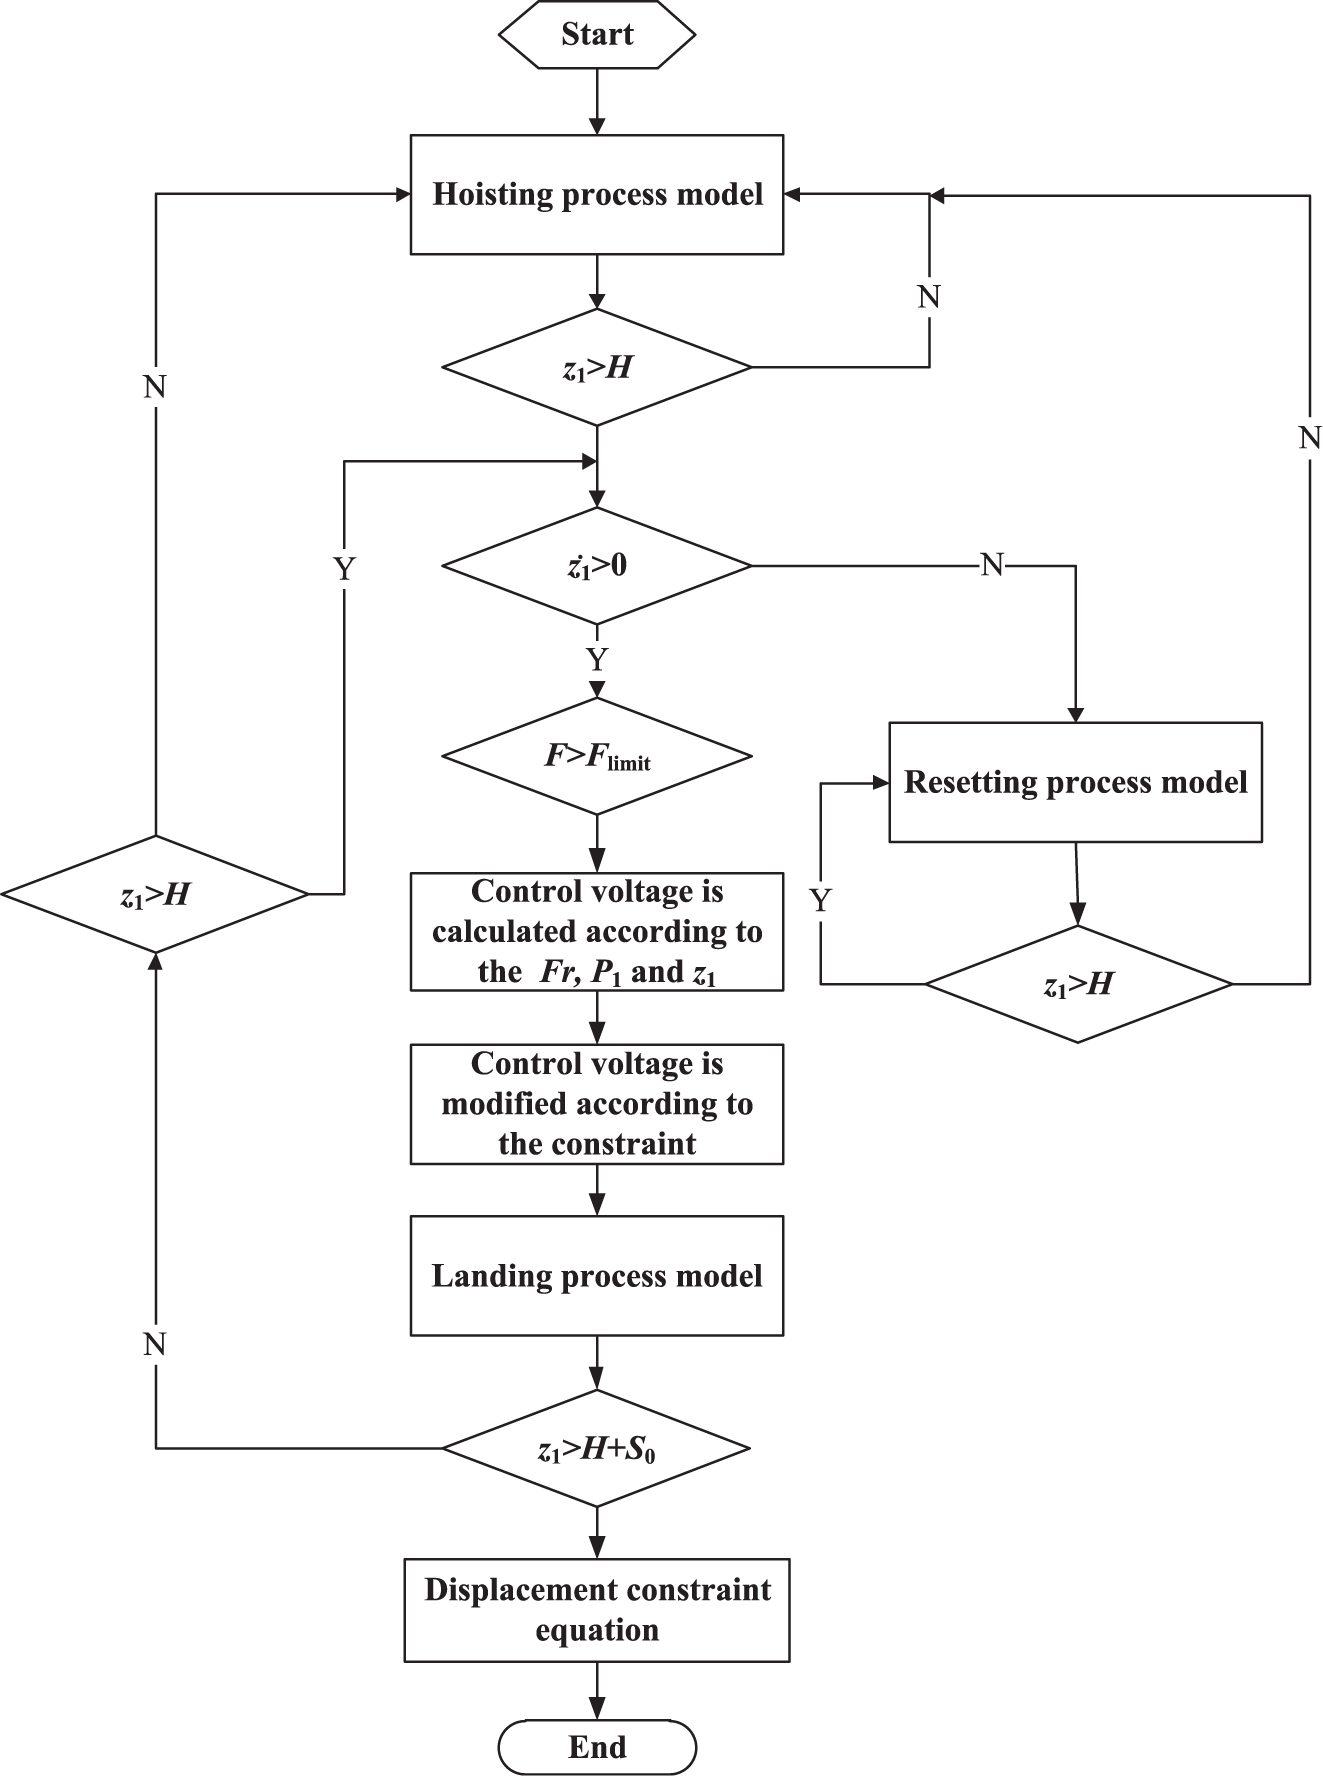
Control algorithm flow chart.
Experiments
Experiment facility
To validate the theoretical analysis, a simulated experimental facility is constructed show as in Figure 6. The facility consists of a rope hoisting system, a vertical moving and guided load mass, a shock isolator, a proportional valve and one-way valve, and a data acquisition system. The heave motion of the load mass can be produced by the motor. To realize the optimal control strategy, the signals of load mass acceleration, displacement of plunger, oil pressure, and tensioning force are used as feedback signal for the controller. The load mass is hoisting down and then lands on the installation platform until the hoisting rope is released completely.

Experimental facility: (a) schematic diagram of facility and (b) actual picture of facility.
Results and discussion
Based on the above analysis, two control strategies are compared in this section. The mass of equipment is 500 kg, and the initial gas pressure is 2 MPa. The release velocity and release height are v0 = 3 m/min and 0.23 m, respectively. The coefficients of proportional are a = 0.1053, b =−0.0526, and
The motion of floating crane is tested, and the testing statistical results are given in Table 1.
Testing results of floating crane motion.

According to the testing results, the amplitude of heave motion is 26.65–48.21 mm, and the period of heave motion is 6.66–9.09 mm under the less than three-level sea state. The amplitude of heave motion is 105.89–145.19 mm, and the period of heave motion is 6.71–7.52 mm under the three-level sea state. The amplitude of heave motion is 152.48–165.46 mm, and the period of heave motion is 6.33–8.0 mm under the more than three-level sea state. Therefore, the amplitude of heave motion is suggested to be less than 0.2 m, and the period of equipment is suggested to be more than 6 s base on the above three conditions. Therefore, three operation conditions are chosen to validate the above two control strategies:
Operation condition 1. This is the more than three-level sea state, and the amplitude and frequency of heave motion are 0.2 m and 0.16 Hz, respectively.
Operation condition 2. This is the three-level sea state, and the amplitude and frequency of heave motion are 0.1 m and 0.16 Hz, respectively.
Operation condition 3. To obtain the effect of the amplitude and frequency of heave motion, the amplitude and frequency of heave motion are 0.2 m and 0.1 Hz, respectively.
Operation condition 1
Figure 7 gives the displacement of the load mass under the two control strategies.

Displacement of load mass under the operation condition 1: (a) passive control strategy and (b) optimal control strategy.
From the displacement curves in Figure 7, the whole installation includes the hoisting process and the landing process. It can be found that the load mass has two landing times before finalizing the installation. When the optimal control strategy is used, the load mass moves down at a constant velocity approximately during the landing process. Thus, the effect of the heave motion on the motion of the load mass can be reduced greatly.
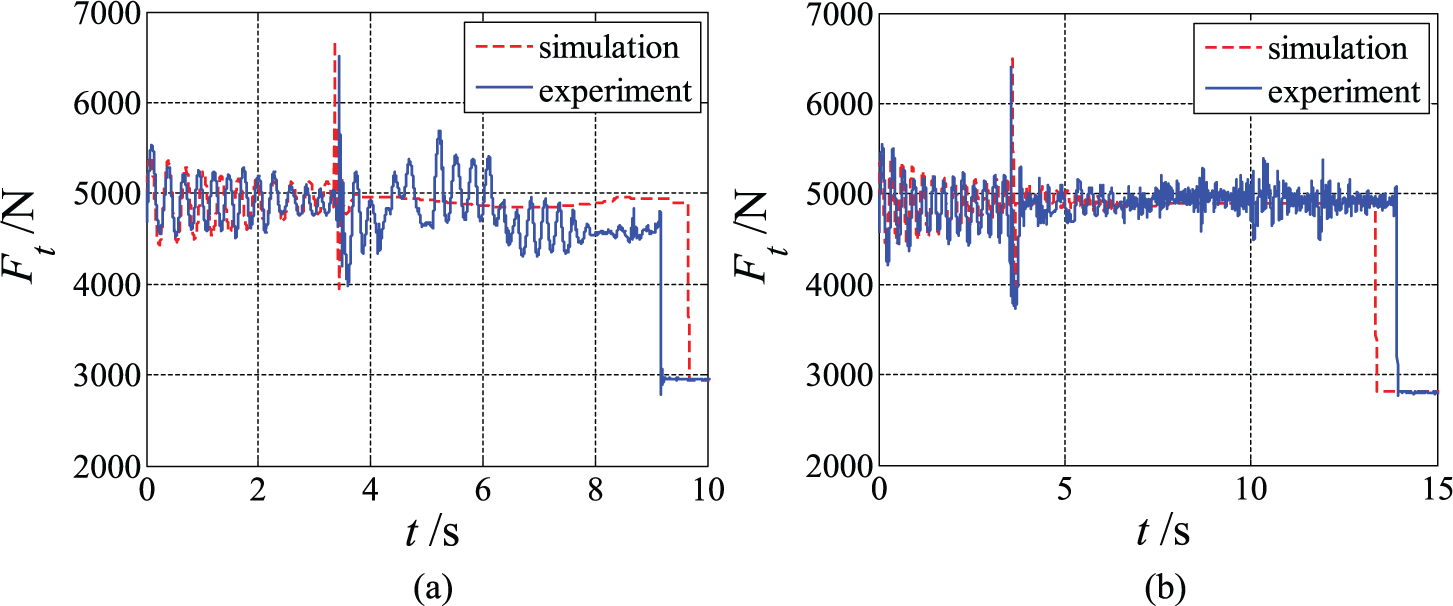
Figure 8 gives the resultant force Ft of the load mass. In Figure 8, the resultant force Ft has a peak value with short pulse width when the plunger lands on the installation platform. When the optimal control strategy is used, the peak value of the resultant force Ft is smaller than that in the passive control strategy. Thus, the peak acceleration of the load mass can be decreased using the optimal control strategy. During the landing process, the resultant force Ft fluctuates in a small range and is closer to a constant force when the optimal control strategy is used.

Resultant force of load mass under operation condition 1: (a) passive control strategy and (b) optimal control strategy.
Figure 9 gives the control voltage of the proportional valve. It can be found that the control voltage calculated by the simulation model has good agreement with the test results.
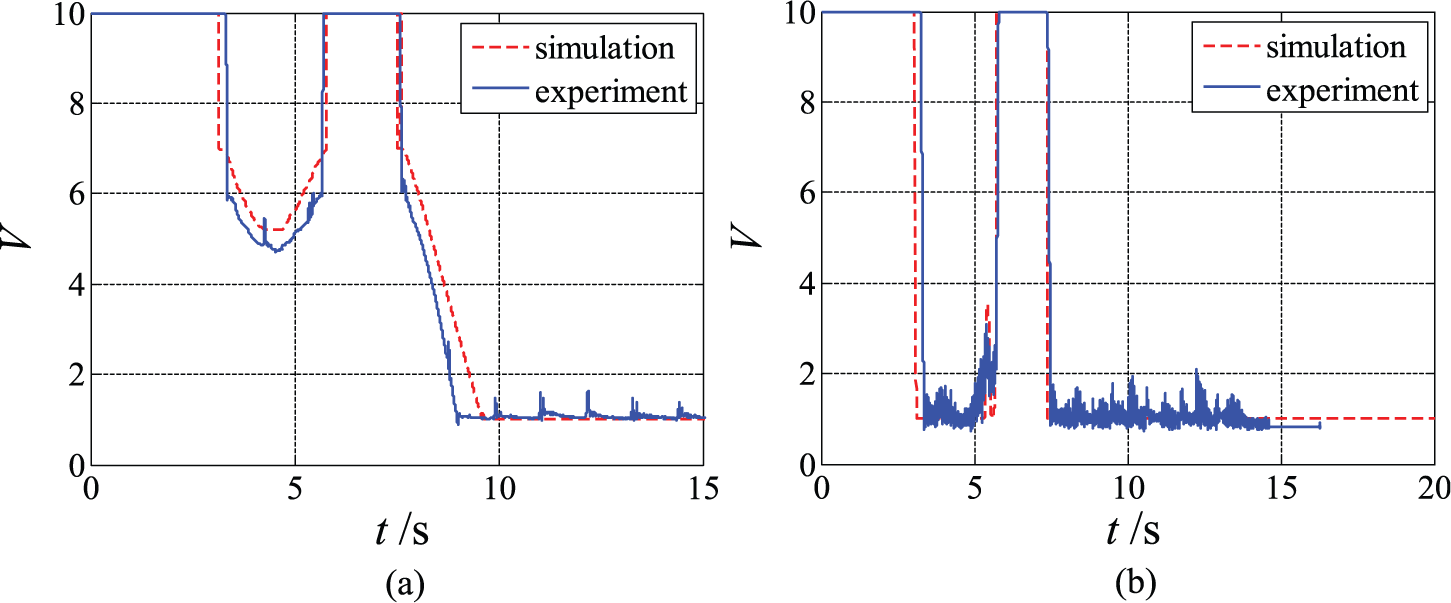
Control voltage under operation condition 1: (a) passive control strategy and (b) optimal control strategy.
Operation condition 2
Figure 10 gives the displacement of the load mass under the two control strategies. From Figure 10, it can be found that the motion of the load mass is more stable compared to condition 1 due to the lower frequency of the heave motion. The load mass has only one landing time before finalizing the installation. During the landing process, the motion of load mass is closer to the uniform motion when the optimal control strategy is used. Thus, the effect of the heave motion can be decreased.

Displacement of load mass under operation condition 2: (a) passive control strategy and (b) optimal control strategy.
Figure 11 gives the resultant force Ft of the load mass. When the plunger lands on the installation platform, the peak value of the resultant force Ft is produced. The peak value of the resultant force Ft is smaller than that in condition 1 due to the lower frequency of the heave motion. When the optimal control strategy is used, the peak value of the resultant force Ft is slightly smaller than that in the passive control strategy. Therefore, the peak acceleration of load mass is almost equal to that in the passive control strategy. During the landing process, the resultant force Ft fluctuates in a small range. When the load mass is lifted again, the amplitude of the load mass can be decreased by the optimal control strategy.

Resultant force of load mass under operation condition 2: (a) passive control strategy and (b) optimal control strategy.
Figure 12 gives the control voltage of the proportional valve. It can be found that the control voltage calculated by the simulation model has good agreement with the test results.

Control voltage under operation condition 2: (a) passive control strategy and (b) optimal control strategy.
The results of the comparison between condition 1 and condition 2 show that the peak acceleration and the landing times of load mass decrease with the decreasing of the frequency of the heave motion.
Operation condition 3
Figure 13 gives the displacement of the load mass under the two control strategies. From Figure 13, it can be found that the load mass has only one landing time during the whole installation process. The motion of load mass is more stable compared to condition 1 due to the smaller amplitude of heave motion. When the optimal control strategy is used, the load mass moves down at a constant velocity approximately during the landing process. Thus, the effect of the heave motion on the motion of the load mass can also be decreased.

Displacement of load mass under operation condition 3: (a) passive control strategy and (b) optimal control strategy.
Figure 14 gives the resultant force Ft of the load mass. When the plunger lands on the installation platform, the peak value of the resultant force Ft is also produced. The peak value of the resultant force Ft is smaller than that in condition 1 due to the smaller amplitude of the heave motion. When the optimal control strategy is used, the peak value of the resultant force is slightly smaller than that in the passive control strategy. Therefore, the peak acceleration of load mass is almost equal to that in the passive control strategy. During the landing process, the fluctuation range of the resultant force Ft can be decreased using the optimal control strategy.
Resultant force of load mass under operation condition 3: (a) passive control strategy and (b) optimal control strategy.
Figure 15 gives the control voltage of the proportional valve. It can be found that the control voltage calculated by the simulation model has good agreement with the test results.

Control voltage under operation condition 3: (a) passive control strategy and (b) optimal control strategy.
The results of the comparison between condition 1 and condition 3, the peak acceleration, and landing times of the load mass decrease with the decreasing of the amplitude of the heave motion.
In conclusion, it can be found that the dynamic responses of the simulation results are close to the experimental results even though there are still some differences considering the unknown resistance and other nonlinearities in the physical construction. Thus, the correctness of the control strategies can be validated. The peak acceleration of the load mass and the landing time can be decreased with the decreasing of the amplitude and the frequency of the heave motion. The peak acceleration of the load mass and the landing time decrease with the decreasing of the amplitude and frequency of the heave motion. When the heave motion has a larger frequency and amplitude, the peak acceleration of load mass can be reduced greatly using the optimal control strategy. When the heave motion has a lower frequency and smaller amplitude, the passive control strategy can be effective as the optimal control strategy. When the optimal control strategy is used, the motion of load mass is more stable and the resultant force Ft fluctuates in a small range during the landing process.
Conclusion
In this article, the simulation experimental setup of the offshore installation is designed according to the offshore installation process. This experimental setup consists of installation frame, hydraulic buffer, hoisting rope, motor, and control system. Then, a dynamic model of the offshore installation is presented according to the installation process. In the model, the effect of the tensioning and relaxing of hoisting rope and the displacement constraint of shock isolator are considered. The control voltage is formulated as an optimization problem to minimize the peak acceleration of the equipment while keeping the maximal deflection of the isolator within a limit. The heave motion of floating crane is tested, and three typical operating conditions are used as the system input. Then, an experiment is designed to verify the effectiveness of the model by comparing the experimental results to the simulation results.
The simulation results are very close to the experimental results that prove the correctness of the two control strategies. The peak acceleration of the equipment and the landing time can be decreased with the decreasing of the amplitude and frequency of the heave motion. When the heave motion has lower frequency or smaller amplitude, the passive control strategy can be effective as the optimal control strategy, while the heave motion has a larger frequency and amplitude, the peak acceleration of equipment can be reduced greatly by the optimal control strategy. The motion of equipment can be more stable, and the effect of the heave motion can be reduced during the landing process using the optimal strategy.
Footnotes
Handling Editor: Francesco Massi
Declaration of conflicting interests
The author(s) declared no potential conflicts of interest with respect to the research, authorship, and/or publication of this article.
Funding
The author(s) disclosed receipt of the following financial support for the research, authorship, and/or publication of this article: The authors acknowledge research support from National Natural Science Foundation of China (grant no. 51205249).